ORIGINAL ARTICLE
Assessing Biodiversity of Benthic Macroinvertebrates and
Influences of Several Environmental Factors on the Community Structure in Upo Wetland by Long-term Ecological Monitoring
Hyoung-Gon Kim, Dong-Jun Lee, Chun-Sik Yoon, Seon-Woo Cheong
*Department of Biology & Chemistry, Changwon National University, Changwon 51140, Korea
Abstract
We assessed the distribution of benthic macroinvertebrate at four surveying sites in Upo Wetland, a Ramsar site and the largest wetland in Korea, from February 2006 to November 2013. A long-term ecological monitoring was done monthly by using quantitative sampling method with dip net for analyzing the community change and correlation between the biodiversity and the environmental factors because environmental factors have a decisive effect on the community structure of the benthic macroinvertebrates. Total samples from the Upo Wetland area were classified into 3 phyla, 6 classes, 17 orders, 68 families, 176 species, and 25,720 individuals. Among the 176 species, 62 of the species had not been previously reported in this area.
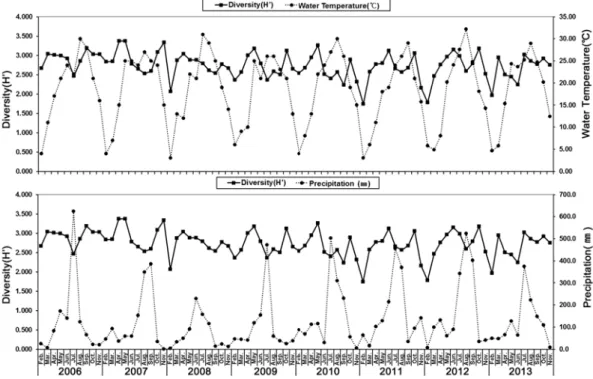
Asellus sp., Diplonychus esakii, and Gyraulus chinensis were the most common species in Upo Wetland. The change patterns of annual species diversity and species richness were calculated by using the average number of monthly occurring species and individuals. Diversity index increased from March to May and decreased after that showing lower diversity indices in July and August. It increased again in September and in October. Richness index showed similar tendency and fell around February and July, followed by a rising tendency around May and October. Correlation and regression analyses were performed with the change of biodiversity and each environmental factor. We found that water temperature have very significant positive correlation with species diversity in spring, and have significant indices in autumn and winter. On the other hand, precipitation showed a significantly negative correlation value in summer and autumn suggesting it has an effect on the community structure of benthic macroinvertebrates.
Key words : Ecological monitoring, Species diversity, Water temperature, Precipitation, Correlation, Community structure
1. Introduction 1)
Generally, wetland means a land that is permanently or seasonally saturated with water, or the soil of the land contains water for a certain period. However, biologically formed wetlands are lands where water is the primary factor for determining the biota(Keddy, 2010; Ramsar Cooperation, 2010). Wetlands have a high biodiversity; hence, they are widely recognized
as ecologically significant. These are also important in regulating floods or droughts and in the purifi -cation of contaminants(Verhoeven et al., 2006).
Benthic macroinvertebrates have the highest species diversity and individual biomass, and hence, occupy a pivotal position in the food chain as a lower level consumer(Pennak, 1989). They are very useful for assessing the condition of flat water ecosystem as they do not travel long distances and many of these
Received 23 November, 2015; Revised 2 April, 2016;
Accepted 5 April, 2016
*