Vol.24 No.1 p24-40, June 2007
책임저자:이충기, 대구광역시 남구 대명동 317-1, 영남대학교 의과대학 내과학교실(류마티스・감염내과) Tel: (053) 620-3841, Fax: (053) 654-8386, E-mail: [email protected]
Identification of Interleukin 1-Responsive Genes in Human Chondrosarcoma SW1354 cells by
cDNA Microarray Technology
Jun-Ha Jeon, Yong-Wook Jung, Dae-Young Yun, Hyun-Do Kim, Chang-Mo Kwon, Young-Hoon Hong, Jae-Ryong Kim*, Choong-Ki Lee
Department of Internal Medicine and *Department of Biochemistry and Molecular Biology, College of Medicine, Yeungnam University, Daegu, Korea
-Abstract-
Background:Accumulating evidence shows that interleukin(IL)-1 plays a critical role in inflammation and connective tissue destruction observed in both osteoarthritis and rheumatoid arthritis. IL-1 induces gene expression related to cytokines, chemokines and matrix metalloproteinases by activation of many different transcription factors.
Materials and Methods:The chondrosarcoma cell line, SW1353, is known to be a valuable in vitro system for investigating catabolic gene regulation by IL-1β in chondrocytic cells. To explore and analyze the changes in gene expression by IL-1 responsible for arthritis, SW1353 was treated with IL-1 for 1, 6 and 24 h and then total RNAs were purified for each time.
The changes in gene expression were analyzed with 17k human cDNA microarrays and validated by semi-quantitative RT-PCR.
Results:Greater than a two-fold change was observed in 1,200 genes including metallo- thioneins, matrix metalloproteinases, extracellular matrix proteins, antioxidant proteins, cytoskeleton proteins, cell cycle regulatory proteins, proteins for cell growth and apoptosis, signaling proteins and transcription factors. These changes appeared to be correlate with the pathophysiological changes observed in early osteoarthritis.
Conclusion:cDNA microarray analysis revealed a marked variability in gene expression, and
provided insight into the overall molecular changes. The result of this study provide initial
information for further studies to identify therapeutic targets in osteoarthritis pathogenesis.
1)Introduction
Osteoarthritis is primarily a disease affecting joint cartilage resulting in severe pain and is the most common debilitating condition in the elderly. The social, medical and financial aspects are rapidly increasing as society is aging. Previously, osteoarthritis had been considered part of the natural aging process but recently there have been studied concerning the metabolic alterations of the articular cartilage independent on the natural aging processes. It is widely accepted that osteoarthritis characteristically involves the processes of cartilage synthesis and degradation resulting in mechanical and biochemical instability with fibrotic changes marked by soft brownish discoloration and a rough surface. As the lesion progresses, subchondral bone becomes exposed with full thickness loss of the cartilage matrix. Especially in early stage osteoarthritis, the main pathologic changes are induced by an imbalance between synthesis and degradation of extracellular matrix rather than chondrocyte loss caused by apoptosis and necrosis.
1)Chondrocyte metabolic activity is controlled by various growth factors and cytokines. Insulin-like growth factor-1 and transforming growth factor-β enhance extracellular matrix formation, but interleukin-1 and tumor necrosis factor-
α induce matrix metalloproteinase expression and result in degradation of the extracellular matrix.
2)IL-1, the prime proinflammatory cytokine, plays an important role in the pathogenesis of osteoarthritis. As has been shown in animal model, IL-1 antagonist can prevent inflammation and tissue loss.
3)IL-1 has 3 subtypes IL-1α, IL-1β, IL-1Ra. IL-1α and IL-1β are agonists for IL-1 receptor, but IL-1Ra is antagonistic for the IL-1 receptor.
4)IL-1α and IL-1β are synthesized from a 31kDa precursor protein and IL-1β becomes active if broken into 17kDa by an IL-1β cleavage enzyme (ICE, caspase-1).
IL-1β is known to exist in cartilage, cartilage
synovial membrane and cartilage synovial
fluid.
5)Activated IL-1β signals the receptor
IL-1R on the cell membrane, activates
mitogen-activated protein kinase (MAPK)
extracellular-signal regulated kinase (ERK),
protein 38 (p38) and c-jun N-terminal kinase
(JNK). The resultant increases in transcription
factors such as NF-κB and AP-1 activate
the signaling processes, thus leading to diverse
gene expressions.
6)Golring et al. showed
that IL-1β decreases the expression level of
collagen II but increases the expression of
immediate early genes such as egr-1, c-jun,
c-fos, jun-B, collagenase, stromelysin and
matrix metalloprotease.
7)Islam et al. reported
the expression of protein tyrosin kinases
Key Words: Interleukin-1beta, Chondrosarcoma, Microarray Analysis, Osteoarthritis
using cDNA microarrays, RT-PCR and Western blot technique in the human osteoarthritis chondrocyte.
8)Vincenti and Brinckerhoff reported changes in expression of translation factors, cytokines, growth factors, protease, extracellular matrix, cell adherent protein and signaling molecules, by analyzing genes with 1.2k cDNA microarrays after IL-1β treatment in human chondrosarcoma cells (SW1353).
9)Aigner et al. investigated genes expressed in the cartilage of normal, early, and late phase osteoarthritis employing 1.2k cDNA microarrays and identified the enhanced expression of collagen fiber type 2, 6, fibronectin, and MMPs.
10)Knorr et al.
reported that the expressions of chitinase-3 like protein 2 and chitinase-3 like protein 1 were decreased in osteoarthritis as compared to normal cartilage.
11)Huh et al. investigated the genes controlled by TNF-α in rheumatoid arthritis.
12)Shi et al. analyzed IL-1 or TNF- α inducible genes in SW1353 cells using the Affimatrix oligonucleotide array, which contains approximately 12,600 probe sets interrogating about 8,700 annotated genes, and revealed that IL-1 and TNF-α each activate a distinct set of genes in SW1353 cells and chondrocyte.
IL-1β might serve an important role in the pathogenesis osteoarthritis.
13)However, it is difficult to understand the overall mechanisms and comprehensive gene expressions involved in inflammation and to identify the novel genes involved in pathogenesis. This study was designed to elucidate more thoroughly
the mechanisms induced by IL-1β using gene expression analysis in the human chondrosarcoma cell SW1353 by employing highly concentrated human 17k cDNA microarrays.
Materials and Methods
Materials. Human chondrosarcoma, SW1353 (HTB-94) was obtained from the Korea Tissue Cell Bank (Seoul, Korea). Human 17 k cDNA microarrays were purchased from GenomicTree Inc. (Daejeon, Korea). Dulbecco’s modified Eagle’s medium (DMEM), diapase, and a penicillin-streptomycin-fungizone antibiotic solution were from Life technologies, Inc.
(Gaithersburg, MD) and MMLV reverse transcriptase, dNTP mix, nick translation system from Promega Corp. (Madison, WI), and interleukin-1β (IL-1β) from R&D Systems Inc., (Minneapolis, MN). Primers for IL-1β responsive genes were from Bioneer Inc.
(Daejeon, Korea) (Table 1).
Cell culture. SW1353 cells were cultivated in DMEM supplemented with 10% FBS and 1% antibiotic-antimycotic solution at 37℃ in a humidified atmosphere containing 5% CO2 and 95% air.
IL-1 β treatment. Cells were cultured at 70% confluence in 150 mm culture plates.
After discarding the media, cells were starved
in DMEM for 24 h. Cells were washed 2
times with DMEM and treated with or
without 10 ng/mL IL-1 for 1, 6, and 24 h at
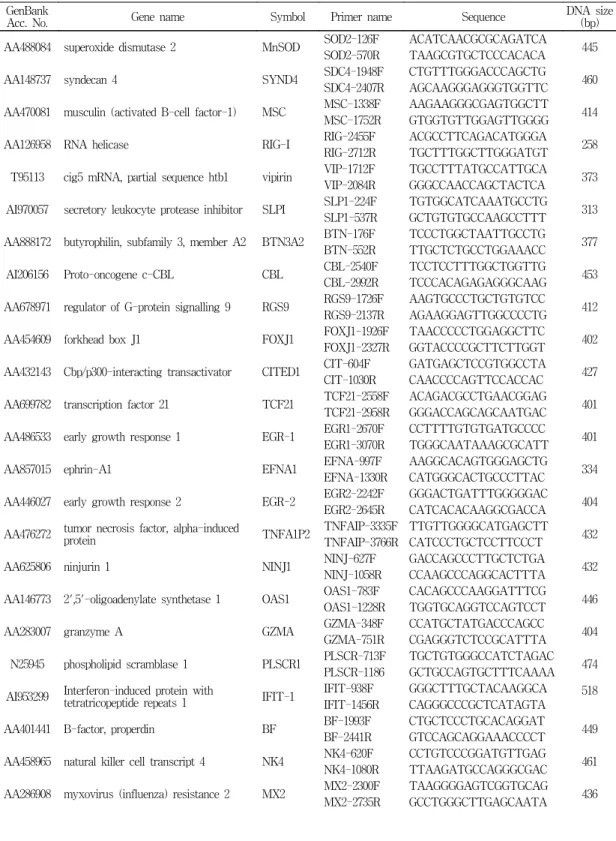
Table 1. Primers for PCR
GenBankAcc. No. Gene name Symbol Primer name Sequence DNA size
(bp)
AA488084 superoxide dismutase 2 MnSOD SOD2-126F ACATCAACGCGCAGATCA
SOD2-570R TAAGCGTGCTCCCACACA 445
AA148737 syndecan 4 SYND4 SDC4-1948F CTGTTTGGGACCCAGCTG
SDC4-2407R AGCAAGGGAGGGTGGTTC 460
AA470081 musculin (activated B-cell factor-1) MSC MSC-1338F AAGAAGGGCGAGTGGCTT MSC-1752R GTGGTGTTGGAGTTGGGG 414
AA126958 RNA helicase RIG-I RIG-2455F ACGCCTTCAGACATGGGA
RIG-2712R TGCTTTGGCTTGGGATGT 258
T95113 cig5 mRNA, partial sequence htb1 vipirin VIP-1712F TGCCTTTATGCCATTGCA VIP-2084R GGGCCAACCAGCTACTCA 373
AI970057 secretory leukocyte protease inhibitor SLPI SLP1-224F TGTGGCATCAAATGCCTG SLP1-537R GCTGTGTGCCAAGCCTTT 313
AA888172 butyrophilin, subfamily 3, member A2 BTN3A2 BTN-176F TCCCTGGCTAATTGCCTG BTN-552R TTGCTCTGCCTGGAAACC 377
AI206156 Proto-oncogene c-CBL CBL CBL-2540F TCCTCCTTTGGCTGGTTG
CBL-2992R TCCCACAGAGAGGGCAAG 453
AA678971 regulator of G-protein signalling 9 RGS9 RGS9-1726F AAGTGCCCTGCTGTGTCC RGS9-2137R AGAAGGAGTTGGCCCCTG 412
AA454609 forkhead box J1 FOXJ1 FOXJ1-1926F TAACCCCCTGGAGGCTTC
FOXJ1-2327R GGTACCCCGCTTCTTGGT 402
AA432143 Cbp/p300-interacting transactivator CITED1 CIT-604F GATGAGCTCCGTGGCCTA CIT-1030R CAACCCCAGTTCCACCAC 427
AA699782 transcription factor 21 TCF21 TCF21-2558F ACAGACGCCTGAACGGAG
TCF21-2958R GGGACCAGCAGCAATGAC 401
AA486533 early growth response 1 EGR-1 EGR1-2670F CCTTTTGTGTGATGCCCC EGR1-3070R TGGGCAATAAAGCGCATT 401
AA857015 ephrin-A1 EFNA1 EFNA-997F AAGGCACAGTGGGAGCTG
EFNA-1330R CATGGGCACTGCCCTTAC 334
AA446027 early growth response 2 EGR-2 EGR2-2242F GGGACTGATTTGGGGGAC EGR2-2645R CATCACACAAGGCGACCA 404
AA476272 tumor necrosis factor, alpha-induced
protein TNFA1P2 TNFAIP-3335F TTGTTGGGGCATGAGCTT
TNFAIP-3766R CATCCCTGCTCCTTCCCT 432
AA625806 ninjurin 1 NINJ1 NINJ-627F GACCAGCCCTTGCTCTGA
NINJ-1058R CCAAGCCCAGGCACTTTA 432
AA146773 2',5'-oligoadenylate synthetase 1 OAS1 OAS1-783F CACAGCCCAAGGATTTCG OAS1-1228R TGGTGCAGGTCCAGTCCT 446
AA283007 granzyme A GZMA GZMA-348F CCATGCTATGACCCAGCC
GZMA-751R CGAGGGTCTCCGCATTTA 404
N25945 phospholipid scramblase 1 PLSCR1 PLSCR-713F TGCTGTGGGCCATCTAGAC PLSCR-1186 GCTGCCAGTGCTTTCAAAA 474
AI953299 Interferon-induced protein with
tetratricopeptide repeats 1 IFIT-1 IFIT-938F GGGCTTTGCTACAAGGCA 518
IFIT-1456R CAGGGCCCGCTCATAGTA
AA401441 B-factor, properdin BF BF-1993F CTGCTCCCTGCACAGGAT
BF-2441R GTCCAGCAGGAAACCCCT 449
AA458965 natural killer cell transcript 4 NK4 NK4-620F CCTGTCCCGGATGTTGAG NK4-1080R TTAAGATGCCAGGGCGAC 461
AA286908 myxovirus (influenza) resistance 2 MX2 MX2-2300F TAAGGGGAGTCGGTGCAG MX2-2735R GCCTGGGCTTGAGCAATA 436
37℃ in 5% CO2 humidified air.
RNA extraction. Total RNA in SW1353 cells treated with or without IL-1β was purified by acid-phenol-guanidium thiocyanate- chloroform extraction.
14)RNA concentrations were determined by measuring absorbance at 260 nm using a UV-spectrophotometer (Shimadzu, Japan) and stored at -70℃.
Northern blot analysis. Ten micrograms of total RNA were separated on a 1%
formaldehyde agarose gel. The RNAs were then transferred to a nylon membrane by vacuum transfer and cross-linked with UV.
The membranes were then prehybridized overnight at 42℃ with a hybridization buffer (0.1 M sodium phosphate pH 7.2, 0.25 M sodium chloride, 2.5 mM EDTA, 50%
formamide, and 7% SDS) containing a 32P- labeled c-Jun and c-Fos probes. Membranes were then washed and exposed to X-ray films at 70℃. Equal RNA loadings were confirmed by hybridization with a 32P- labeled GAPDH probe.
cDNA microarray experiments and data
analysis. cDNA microarray experiments were performed as described by Yang et al.
15)Briefly, total RNA (100 mg)was reverse transcribed in the presence of Cy3-dUTP or Cy5-dUTP (25 mM stock, NEN Life Science Products) at 42℃ for 2 h. The labeled cDNA was then hybridized with the cDNA microarray at 65℃ for 16 h. The hybridized slides were washed, scanned with an Axon 4000B scanner (Axon Instruments), and analyzed using GenePix Pro 4.0 (Axon Instruments).
Raw data were normalized and analyzed using GeneSpring 6.0 (Silicon Genetics). Genes were filtered according to their intensities in the control channel.
If control channel values were below 80 in all of the samples, we considered them to be unreliable genes. Intensity-dependent normalization (LOWESS) was performed, where the ratio was reduced to the residual of the Lowess fit of the intensity versus ratio curve. Average normalized ratios were calculated by dividing the averaged normalized signal channel intensity by the averaged normalized control
AA863383 pim-2 oncogene PIM2 PIM2-1611F CTTACCTGCCTCAGCCCA
PIM2-1926R GCTCAGGAGGAGGTTGCA 328
AA236164 cathepsin S CTSS CTSS-3614F TCTGCCTGCTGTTCTCCC
CTSS-3941R ACGAGGGGCTCCATAAGG 328
AA668821 chitinase 3-like 2 CHI3L2 CHI-727F ACAGAGGGCCAAGCTCCT
CHI-1194R TTCACAAGGAGCCAAGGC 468
AA708905 WAS protein family, member 2 WASF2 WAS-2974F GGTTTGGGCCTAATGGCT WAS-3354R CTGAGGAGGCTTCGCAAG 381
AI659145 serum amyloid A2 SAA2 SAA2-70F TCAGCAGCCGAAGCTTCT
SAA2-455R ACTTTGAATCCCTGCCCC 386
AI921598 glycoprotein, synaptic 2 GPSN2 GPSN-267F CACGTGGCTCTTCCTGCT
GPSN-588R GGACAGGCGGGCTTTATT 322
AA455235 aldehyde dehydrogenase 1 ALDH1A3 ALDH-3012F TGGCTTCCCTTCATCAGC ALDH-3385R AGGATCGGAATTCCCAGG 374
channel intensity. Welch’s ANOVA test was performed for p-values =0.1 or 0.05 to identify genes in differentially expressed samples.
Correlation analysis was performed using Pearson correlation (-1 to 1). Spots showing changes of 2-fold or more were considered significant.
Semi-quantitative reverse transcription- polymerase chain reaction (RT-PCR). To validate the differential expressions of genes screened by cDNA microarray analysis, we used semi-quantitative RT-PCR.
16)The levels of amplified DNAs by RT-PCR were quantified using the UTHSCSA ImageTool program (developed at the University of Texas Health Science Center at San Antonio, Texas and available at http://ddsdx.uthscsa.
edu/dig/ itdesc.html).
Results
Northern blot analysis to check responses of SW1353 cells to IL-1β treatment showed peak c-fos expression by 1 h and declined by 6 and 24 h (Fig. 1), indicating that the signaling processes of SW1353 were adequate for IL-1β stimulation. With these adequate responses, the RNAs controlled by IL-1β were analyzed using cDNA microarrays.
After treatment of SW1353 with IL-1β for 1, 6, and 24 h, cells were harvested, RNAs were purified and then analyzed by 17k cDNA microarray. For the RNAs from control cells without IL-1β treatment, cDNA
probes were manufactured with cy3-dUTP of green fluorescence and for the RNAs of treated cells, cDNA probes with cy5-dUTP of red fluorescence. The mixture of same amounts of cDNA probes from control cells and IL-1β treated cells was applied to 17k cDNA microarrays. On microarray analysis, the genes suppressed by IL-1β treatment exhibited green fluorescence, while enhanced genes exhibited red fluorescence with yellow meaning no changes (Fig. 2). Among the genes showing fluorescence above 200 in green or red, there were 4,200 increasing Fig. 1. Fos expression in IL-1β-stimulated cells.
SW1353 cells were treated with or without 10 ng/mL IL-1β for the indicated times.
The level of c-Fos expression was analyzed
by Northern blotting. Equal loading of RNA
was estimated with a GAPDH probe and
by RNA staining with ethidium bromide in
the agarose gel.
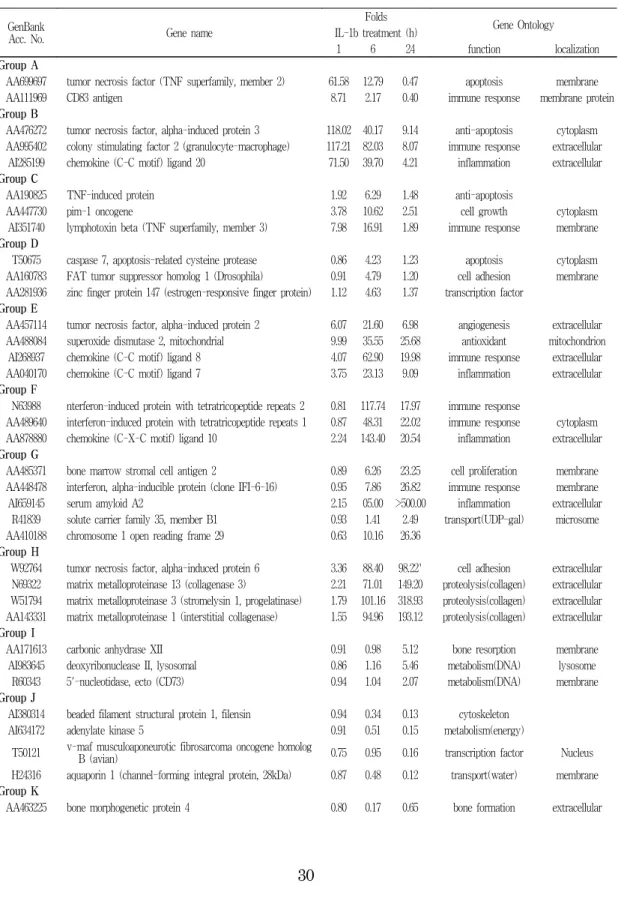
Table 2. The groups of genes demonstrating similar patterns
GenBankAcc. No. Gene name
Folds
Gene Ontology IL-1b treatment (h)
1 6 24 function localization
Group A
AA699697 tumor necrosis factor (TNF superfamily, member 2) 61.58 12.79 0.47 apoptosis membrane
AA111969 CD83 antigen 8.71 2.17 0.40 immune response membrane protein
Group B
AA476272 tumor necrosis factor, alpha-induced protein 3 118.02 40.17 9.14 anti-apoptosis cytoplasm AA995402 colony stimulating factor 2 (granulocyte-macrophage) 117.21 82.03 8.07 immune response extracellular
AI285199 chemokine (C-C motif) ligand 20 71.50 39.70 4.21 inflammation extracellular Group C
AA190825 TNF-induced protein 1.92 6.29 1.48 anti-apoptosis
AA447730 pim-1 oncogene 3.78 10.62 2.51 cell growth cytoplasm
AI351740 lymphotoxin beta (TNF superfamily, member 3) 7.98 16.91 1.89 immune response membrane Group D
T50675 caspase 7, apoptosis-related cysteine protease 0.86 4.23 1.23 apoptosis cytoplasm AA160783 FAT tumor suppressor homolog 1 (Drosophila) 0.91 4.79 1.20 cell adhesion membrane AA281936 zinc finger protein 147 (estrogen-responsive finger protein) 1.12 4.63 1.37 transcription factor
Group E
AA457114 tumor necrosis factor, alpha-induced protein 2 6.07 21.60 6.98 angiogenesis extracellular AA488084 superoxide dismutase 2, mitochondrial 9.99 35.55 25.68 antioxidant mitochondrion
AI268937 chemokine (C-C motif) ligand 8 4.07 62.90 19.98 immune response extracellular AA040170 chemokine (C-C motif) ligand 7 3.75 23.13 9.09 inflammation extracellular Group F
N63988 nterferon-induced protein with tetratricopeptide repeats 2 0.81 117.74 17.97 immune response
AA489640 interferon-induced protein with tetratricopeptide repeats 1 0.87 48.31 22.02 immune response cytoplasm AA878880 chemokine (C-X-C motif) ligand 10 2.24 143.40 20.54 inflammation extracellular Group G
AA485371 bone marrow stromal cell antigen 2 0.89 6.26 23.25 cell proliferation membrane AA448478 interferon, alpha-inducible protein (clone IFI-6-16) 0.95 7.86 26.82 immune response membrane
AI659145 serum amyloid A2 2.15 05.00 >500.00 inflammation extracellular
R41839 solute carrier family 35, member B1 0.93 1.41 2.49 transport(UDP-gal) microsome AA410188 chromosome 1 open reading frame 29 0.63 10.16 26.36
Group H
W92764 tumor necrosis factor, alpha-induced protein 6 3.36 88.40 98.22` cell adhesion extracellular N69322 matrix metalloproteinase 13 (collagenase 3) 2.21 71.01 149.20 proteolysis(collagen) extracellular W51794 matrix metalloproteinase 3 (stromelysin 1, progelatinase) 1.79 101.16 318.93 proteolysis(collagen) extracellular AA143331 matrix metalloproteinase 1 (interstitial collagenase) 1.55 94.96 193.12 proteolysis(collagen) extracellular Group I
AA171613 carbonic anhydrase XII 0.91 0.98 5.12 bone resorption membrane
AI983645 deoxyribonuclease II, lysosomal 0.86 1.16 5.46 metabolism(DNA) lysosome R60343 5'-nucleotidase, ecto (CD73) 0.94 1.04 2.07 metabolism(DNA) membrane Group J
AI380314 beaded filament structural protein 1, filensin 0.94 0.34 0.13 cytoskeleton
AI634172 adenylate kinase 5 0.91 0.51 0.15 metabolism(energy)
T50121 v-maf musculoaponeurotic fibrosarcoma oncogene homolog
B (avian) 0.75 0.95 0.16 transcription factor Nucleus
H24316 aquaporin 1 (channel-forming integral protein, 28kDa) 0.87 0.48 0.12 transport(water) membrane Group K
AA463225 bone morphogenetic protein 4 0.80 0.17 0.65 bone formation extracellular
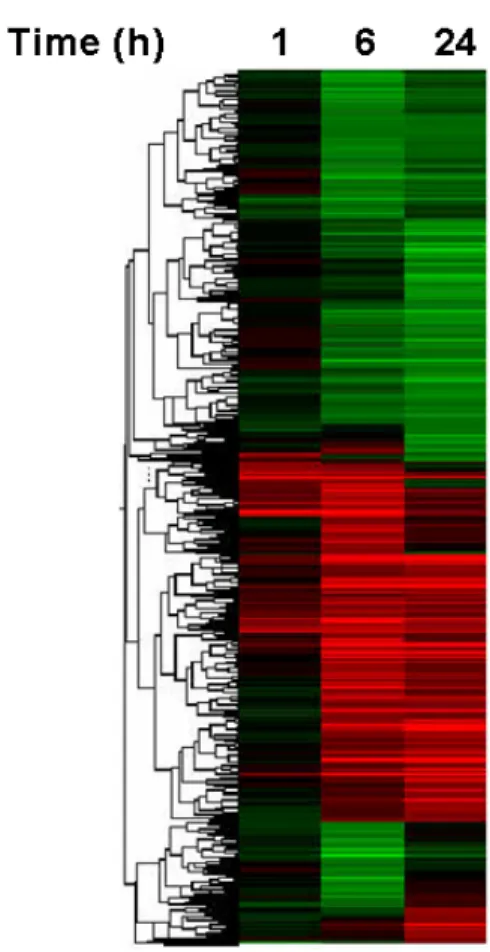
fluorescence by more than 2 fold according to IL-1β treatment times. For those genes having a value above 700, there were 1,200 that doubled. Stratified analysis showed the changing patterns of these 1,200 genes (Fig.
3). Green means decreased expression, red;
enhanced expression, black; no change according to IL-1β treatment times and the intensity of color is proportionate to change.
The groups of genes demonstrating similar
changing patterns were analyzed by k-means clustering and included 12 groups (group A to group L) (Fig. 4 and Table 2). The genes of
W93379 NIMA (never in mitosis gene a)-related kinase 2 0.64 0.27 0.88 cell cycle nucleus AI818293 D site of albumin promoter (albumin D-box) binding protein 0.89 0.02 1.44 transcription factor
AA505136 PHD protein Jade-1 0.73 0.24 0.72
Group L
AA287316 histone 1, H4b 1.15 0.26 0.28 chromosome assembly nucleus
AA868008 histone 1, H4f 1.28 0.27 0.32 chromosome assembly nucleus
AA482119 inhibitor of DNA binding 3, dominant negative helix-
loop-helix protein 1.10 0.18 0.33 transcription corepressor nucleus N74882 distal-less homeo box 5 0.47 0.15 0.31 transcription factor nucleus AA452909 nuclear receptor subfamily 2, group F, member 1 0.74 0.26 0.27 transcription factor nucleus
Fig. 2. cDNA microarray images (A) and scattered plots (B) for IL-1b responsive genes in SW1353 cells. Cy5-labeled cDNA (red, IL- 1b-stimulated cells) and Cy3-labeled cDNA (green, IL-1b-unstimulated cells) were mixed and hybridized with 17k cDNA microarrays.
The microarrays were scanned and analyzed.
One Total The ratios of Cy5 to Cy3 fluorescent intensities of each genes were compared and plotted.
Fig. 3. Hierarchical clustering of IL-1b- responsive genes in SW1353 cells.
Genes showing changes of more
than 2 folds in its expression by
IL-1b treatment were clustered
using Genespring 6.1.
group A had a pattern that peaked at 1 h, and then decreased to pre-treatment levels
(Fig. 4-1-A). Many genes related to cell signal transmission, especially expression of TNF for cell death and CD83 antigen for immune response, were prominent in this group. Group B peaked at 1 h and decreased at 6 and 24 h, although remaining elevated above base line values (Fig. 4-1-B). This group consisted of colony stimulating factor 2, chemokine (CC motif) ligand 20, TNF-α induced protein 3 and others involved in inflammation and immune responses. The genes belonging to group C started to increase at 1 h, peaked at 6 h and then returned to the one hour reading by 24 h (Fig. 4-1-C).
About 44 genes were in group C, lymphotoxin-β of TNF- family for cell death, pim-1 for cell growth and TNF-induced protein to inhibit cell death showed remarkable changes in Fig. 4-1. K-mean clustering of IL-1b -responsive
genes in SW1353 cells. Genes showing changes of more than 2 folds in its expression by IL-1b treatment were clustered using Genespring 6.1.
Fig. 4-2. K-mean clustering of IL-1b-responsive genes in SW1353 cells. Genes showing changes of more than 2 folds in its expression by IL-1b treatment were clustered using Genespring 6.1.
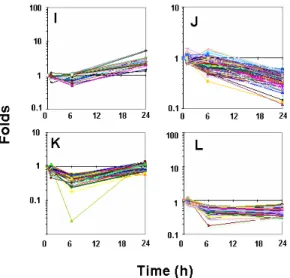
Fig. 4-3. K-mean clustering of IL-1b-responsive
genes in SW1353 cells. Genes showing
changes of more than 2 folds in its expression
by IL-1b treatment were clustered using
Genespring 6.1.
expression and the proteins combining metal ions, metallothionein, were noticeable. Group D genes had maximum expression by hour 6 but were unchanged at 1 h and lower than base level at 24 h (Fig. 4-1-D) especially those participated in transcription factors such as FAT tumor suppressor homolog 1 for cell adherence, zinc finger protein 147, and caspase 7 were prominent in this group.
Genes in group E were enhanced at 1 h, peaked at 6 h, and then tended to decrease.
However, at 24 h, levels were still elevated above that of 1h measurements, in contrast to group C (Fig. 4-2-E). Chemokine (CCmotif) ligand 7 and 8 related to inflammation, and mitochondrial superoxide dismutase and TNF-α induced protein 2 for angiogenesis were prominent in group E. Group F, even though it was similar to group C and group E, showed increases at 1 and 6 h, and a slight decrease at 24 h (Fig. 4-2-F). The expression of chemokine (CC motif) ligand 10, and interferon-induced protein with tetratricopeptide repeats 1, 2 were prominent in addition to the characteristic genes of transcription factors, cell death and immune inflammatory responses. Group G included genes showing a steady increase at 1, 6 and 24 h. Serum amyloid A2 was the most prominent among them, and was expressed more than 100 fold at 6 h and 200 fold at 24 h (Fig. 4-2-G). Others such as bone marrow stromal cell antigen 2, interferon-induced protein for cell growth, solute carrier family
35 (zinc transporter) and chromosome 1 open
reading frame 29 of unknown function were
noticeable. In group H, similar to group G,
genes expressed a steady level at 6 and
24 h (Fig. 4-2-H). Expression of MMP-3
(stromelysin 1), MMP-1 (interstitial collagenase),
MMP-13 (collagenase 3), TNF-induced protein
6 for cell adherence, B-factor (properdin) for
proteolysis were prominent. Genes of Group
I had enhanced expression at 24 h but no
changes at 1and 6 h (Fig. 4-3-I) and DNAse
II, 5'-nucleotidase, carbonic anhydrase XII
for ECF acidity and bone resorption were
remarkable. Group J had characteristics of
decreased expressions at 6 and 24 h compared
to those at 1 h (Fig. 4-3-J). The decreases were
remarkable with beaded filament structural
protein 1 (filensin) related to cytoskeleton,
aquaporin-1 for water transportation, adenylate
kinase 5 for intracellular ATP control and
translation factor v-maf musculoaponeurotic
fibrosarcoma oncogene homolog B. There
were also genes responsible for cell adherence,
cytoskeleton, glycoprotein metabolism, proteolysis,
ribosome proteins, signaling proteins and
translation factors. Group K genes had
decreased expression at 1 h, nadir at 6 h,
and then recoverd to basal level at 24 h
(Fig. 4-3-K). Prominent in this group were
D site of albumin promoter (albumin D-box)
binding protein, bone morphogenetic protein
4, PHD protein Jade-1 and NIMA-related
kinase 2. There were also other genes for
controlling cell cycle, cell growth, DNA
repair and metabolism and translation in this group. Group L, the largest group, consisted of genes whose expressions were suppressed from hour 6 to hour 24 inclusively (Fig.
4-3-L). Group L contained genes for cell cycle, cytoskeleton, mitochondria, energy, protein, lipid, carbohydrate metabolism and translation factors. Among the cited genes, distal-less homeo box 5, inhibitor of DNA binding 3, nuclear receptor subfamily 2,
histone 1 gene for forming nucleosome binding DNA had marked changes.
Since cDNA microarray analysis revealed many false positives, it is necessary to repeat tests and statistical analyses or to validate the results with other methods of quantifying gene expression.
17)In this study RT-PCR was performed for 31 prominent genes in cDNA microarray analysis to verify the expression patterns. Most results were Table 3. Validation of cDNA microarray data by RT-PCR
GenBank
Acc. No. Gene name Symbol
Folds Expression
pattern in RT-PCR IL-1b treatment (h)
1 6 24
AA488084 superoxide dismutase 2 MnSOD 10.5 37.1 26.5 similar
AA148737 syndecan 4 (amphiglycan, ryudocan) SYND4 4.24 16.7 2.73 different
AA470081 musculin (activated B-cell factor-1) MSC 4.27 14.1 2.76 similar
AA126958 RNA helicase RIG-I 1.47 18.7 7.9 similar
T95113 cig5 mRNA, partial sequence htb1 vipirin 0.7 55.1 8.54 similar
AI970057 secretory leukocyte protease inhibitor SLPI 0.24 7.04 30.4 similar
AA888172 butyrophilin, subfamily 3, member A2 BTN3A2 0.99 2.67 30 similar
AI206156 Proto-oncogene c-CBL CBL 0.53 0.04 1 No band
AA678971 regulator of G-protein signalling 9 RGS9 0.77 0.19 0.27 similar
AA454609 forkhead box J1 FOXJ1 0.14 0.15 0.13 No band
AA432143 Cbp/p300-interacting transactivator CITED1 0.57 0.27 0.11 similar
AA699782 transcription factor 21 TCF21 1.18 6.45 0.7 No band
AA486533 early growth response 1 EGR-1 11.1 0.39 0.36 similar
AA857015 ephrin-A1 EPLG1 2.04 0.88 1.09 similar
AA446027 early growth response 2 EGR-2 6.87 1.88 0.94 No band
AA476272 tumor necrosis factor, alpha-induced protein TNFA1P2 132 49.1 9.83 similar
AA625806 ninjurin 1 NINJ1 2.41 7.22 2.15 similar
AA146773 2',5'-oligoadenylate synthetase 1 OAS1 0.99 9.75 10.7 similar
AA283007 granzyme A GZMA 1 0.24 1 No band
N25945 phospholipid scramblase 1 PLSCR1 0.8 10.7 8.34 similar
AI953299 Interferon-induced protein with tetratricopeptide repeats 1 IFIT-1 0.99 69.2 44.2 similar
AA401441 B-factor, properdin BF 0.89 38.4 65.9 similar
AA458965 natural killer cell transcript 4 NK4 2.95 25.4 32.1 similar
AA286908 myxovirus (influenza) resistance 2 MX2 1.11 9.95 12.8 similar
AA863383 pim-2 oncogene PIM2 1.28 2.15 0.14 similar
AA236164 cathepsin S CTSS 1.22 4.59 10.9 No band
AA668821 chitinase 3-like 2 CHI3L2 0.88 9.43 16.3 similar
AA708905 WAS protein family, member 2 WASF2 1.08 1.43 0.15 different
AI659145 serum amyloid A2 SAA2 1 1 1 similar
AI921598 glycoprotein, synaptic 2 GPSN2 0.24 1.03 0.88 different
AA455235 aldehyde dehydrogenase 1 ALDH1A3 0.79 0.4 0.1 different