289
Genotyping of the Wild Mushroom Lentinula edodes from Mt. Jungwang and Mt. Gariwang in Korea
Yeun Sug Jeong
1, Yeongseon Jang
1, Rhim Ryoo
1, Ki-Hwan Kim
2and Kang-Hyeon Ka
1*
1Division of Wood Chemistry and Microbiology, National Institute of Forest Science, Seoul 02455, Korea
2C&K Genomics, Seoul 08826, Korea
ABSTRACT : Lentinula edodes is an edible wild mushroom that can be found in mountainous regions of the Korean peninsula.
Wild oak mushrooms were collected from Quercus mongolica at an elevation of more than 1,000 m on Mt. Jungwang and Mt.
Gariwang in Gangwon province. We examined 10 oak mushroom strains to evaluate the genetic similarity among strains. Genetic similarity was determined based on the analysis of microsatellite markers (Led A2, Led A8, Led B2, Led B6, and Led D6) registered in the National Center for Biotechnology Information. We also performed dual culture tests on potato dextrose agar for 2 months at 25 °C. The observed heterozygosity across all microsatellites ranged from 0.00 and 0.60 among 5 microsatellite markers, and the polymorphism information content values of Led A2, Led A8, Led B2, Led B6, and Led D6 were 0.0000, 0.8144, 0.6194, 0.4892, and 0.5702, respectively (mean value = 0.4987). Confrontation lines between strains were formed for almost all combinations. In conclusion, the oak mushroom populations of Mt. Jungwang and Mt. Gariwang have mixed gene pools. However, further studies are needed to identify genetic similarities and variations among these populations.
KEYWORDS : Gene diversity, Lentinula edodes, Microsatellite markers, Population
Introduction
Lentinula edodes (shiitake) is one of the most important edible mushrooms in the world. The fungus is distributed in Asia and some subtropical regions. Republic of Korea, China, Taiwan, and Japan cultivate and consume shiitake mushrooms [1]. In the majority of cases, cultivated shii- take mushrooms have different cultivar names; therefore, several names can exist for describing the same species.
This makes it difficult to accurately match names and species. For the last decade, several molecular marker techniques have been utilized to classify different strains of shiitake. Restriction fragment length polymorphism (RFLP), randomly amplified polymorphic DNA (RAPD),
inter-simple sequence repeats (ISSR), and sequence cha- racterized amplified region (SCAR) have been used. How- ever, these methods have limitations regarding economic efficiency, reliability, and analysis time. In order to over- come these limitations, amplified fragment length poly- morphism (AFLP) and simple sequence repeats (SSR) are being used as promising alternative methods [2-4]. SSR also referred to as microsatellites consist of short DNA sequence motifs that are abundant in the genomes of pro- karyotic and eukaryotic organisms [5]. They are useful for tracking the country of origin and for distinguishing between individual strains. They have several alleles, high heterozygosity, and many polymorphous nucleotides. In addition, a number of repeated sequences can be easily calculated, and these short DNA sequence motifs exhibit a low rate of mutations [1]. Compared to the other tech- niques, co-dominant SSR was shown to be highly poly- morphic, reproducible, stable, reliable, easy to score, fast, and accurate [6, 7]. Using Suillus bovinus, Pleurotus ostre- atus, and Agaricus bisporus, it has been reported that microsatellite markers are useful for genetic studies on mushrooms [2]. Moreover, this analysis can reveal genetic linkage maps, genetic diversity analysis, molecular eco- logy, and phylogenetics.
In this study, we identified genotypes of wild L. edodes strains collected in Mt. Jungwang and Mt. Gariwang using
*Corresponding author E-mail: [email protected] Received September 17, 2016 Revised November 7, 2016 Accepted November 8, 2016
This is an Open Access article distributed under the terms of the Creative Commons Attribution Non-Commercial License (http://
creativecommons.org/licenses/by-nc/3.0/) which permits unrestricted non-commercial use, distribution, and reproduction in any medium, provided the original work is properly cited.
Kor. J. Mycol. 2016 December, 44(4): 289-295 https://doi.org/10.4489/KJM.2016.44.4.289 pISSN 0253-651X • eISSN 2383-5249
© The Korean Society of Mycology
microsatellite markers to understand the population struc- ture of this mushroom.
Materials and Methods
Sampling and cultivation
We used 10 Lentinula edodes strains registered in the National Institute of Forest Science (NIFoS, Table 1). Each strain was isolated from mushrooms collected from Mt.
Jungwang and Mt. Gariwang in Korea (Fig. 1). They were maintained at 4°C on slants of potato dextrose agar (PDA;
Difco, Detroit, MI, USA).
DNA extraction, amplification, and genotyping
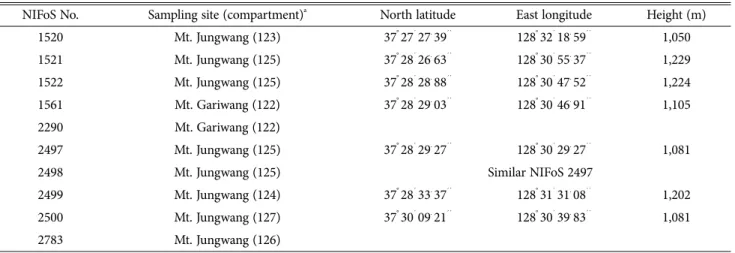
We isolated the genomic DNAs of 10 shiitake strains using the DNeasy Plant mini kit (Qiagen, Germantown, MD, USA). We made microsatellite markers using sequ- ence information from GenBank (DQ231475-DQ-23479) and the Primer3 v0.4 program. One of each primer pair was labeled with 6 FAM fluorescent dyes (Table 2). PCR was performed using a Thermocycler (Bio-Rad, Hercules, CA, USA). Each 25 mL reaction mixture contained 30 ng of DNA, 1X PCR buffer, 2.5 mM of dNTPs, 200 nM of each primer, and 1 U of Taq polymerase. A first denatu- ration step was performed at 95°C for 3 minutes, followed by 30 cycles at 94°C for 30 seconds, 54°C or 56°C for 30 Table 1. Sampling site of the shiitake mushrooms
NIFoS No. Sampling site (compartment)a North latitude East longitude Height (m) 1520 Mt. Jungwang (123) 37° 27´ 27. 39´´ 128° 32´ 18. 59´´ 1,050 1521 Mt. Jungwang (125) 37° 28´ 26. 63´´ 128° 30´ 55. 37´´ 1,229 1522 Mt. Jungwang (125) 37° 28´ 28. 88´´ 128° 30´ 47. 52´´ 1,224 1561 Mt. Gariwang (122) 37° 28´ 29. 03´´ 128° 30´ 46. 91´´ 1,105
2290 Mt. Gariwang (122)
2497 Mt. Jungwang (125) 37° 28´ 29. 27´´ 128° 30´ 29. 27´´ 1,081
2498 Mt. Jungwang (125) Similar NIFoS 2497
2499 Mt. Jungwang (124) 37° 28´ 33. 37´´ 128° 31´ 31. 08´´ 1,202 2500 Mt. Jungwang (127) 37° 30´ 09. 21´´ 128° 30´ 39. 83´´ 1,081
2783 Mt. Jungwang (126)
NIFoS, National Institute of Forest Science.
aOne division of separated mountains in Korea.
Fig. 1. Location of the wild Lentinula edodes strains collected in Mt. Jungwang and Mt. Gariwang, Pyeongchang-gun, Gangwon province in Korea.
seconds, and 72°C for 1 minute. A final extension step was performed at 72°C for 5 minutes. PCR products were separated and analyzed by an ABI 3730xl DNA analyzer (Applied Biosystems, Foster city, CA, USA). We analyzed allele sizes using GENE MAPPER version 4.0 (Applied Biosystems), and calculated allele numbers and heterozy- gosity [1].
Analysis of variation and population relationship We calculated the polymorphism information content (PIC) using the PowerMarker program [8]. The allelic and genotypic frequencies were calculated using the analyzed samples. The genetic variability of the sample as a whole was estimated based on the number of alleles per locus (total numbers of alleles/numbers of loci).
The percentage of polymorphic loci = numbers of poly- morphic loci/total number of loci analyzed × 100, and PIC contents = PIC = 1 −Σi=1Pi2 − Σi=1Σi=i+1Pi2Pj2
Phylogenetic analysis
The dataset was converted to frequency data using the PowerMarker v3.0 software. Calculation of genetic dist- ance among samples indicated the population structure.
Various distance measures used for frequency data have been described [9, 10]. For evolutionary studies, the clus- tering of operational taxonomic units (OTUs) naturally lead to a phylogenetic tree. The neighbor joining method was used to reconstruct the phylogeny from a distance matrix [9].
Confrontation test
The confrontation test was applied to assess the homo- geneity among the 10 strains. The strains were inoculated
on PDA agar plates and incubated at 25°C for 21 days.
Mycelium disks (ca. 8 mm) from different strains were inoculated on a PDA agar plate on both sides and incu- bated at 25°C. Among the 10 strains, 45 combinations were performed. After 2 months, we assessed samples for the presence of confrontation lines.
Results and Discussion
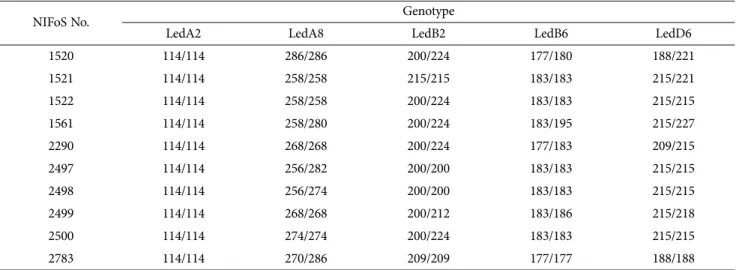
The allele sizes of all 10 L. edodes strains was analyzed for the 5 microsatellite markers evaluated (Table 3). Led A8 is the allele for 8 types, specifically 256, 258, 268, 270, 274, 280, 282, and 286 bp (Fig. 2). Led B2 is the allele for 5 types, specifically 200, 209, 212, 215, and 224 bp. Led B6 is the allele for 5 types, specifically 177, 180, 183, 186, and 195 bp. Led D6 is the allele for 6 types, specifically 188, 209, 215, 218, 221, and 227 bp. Led A2 is the allele for 114 bp only (Table 3). Table 4 shows the statistical analysis of the genotypic characteristics from the 10 shiitake analyzed in this study. The number of alleles ranged from 1 to 8 with an average value of 5/
locus, and the observed allele frequency was the highest in Led A2 (1.00) followed by Led B6, Led D6 (0.60), Led B2 (0.50), and Led A8 (0.25). The genotype number ran- ged from 1 to 8 and the average value was 5.40/locus. Led A8 had the highest gene diversity (He) among the 5 mar- kers, followed by Led B2 (0.6650), Led D6 (0.6000), and Led B6 (0.5300). Led A2 did not demonstrate gene diver- sity in this study. The observed heterozygosity (Ho) ranged from 0.4000 to 0.6000, except for Led A2. In addition, Led B2 had the highest heterozygosity among the 5 mar- kers. PIC values ranged from 0.0000 to 0.8144 with an average of 0.4987/locus, and a relatively high polymor- Table 2. Summary data of the five microsatellite markers used in this study
Locus Genbank No. Primer sequence Size range (bp) Motifsa Tm (°C)
LedA2 DQ231475
5‘-FAM ACT GGT GCT TTA GTG GTC G-3’
78~121 Ramdom 54
5‘-TTC GGA TCC CTT TGC CTC-3’
LedA8-F DQ231476
5‘-FAM TCA TCT CCT TC CAT GTT CC-3
247~286 Ramdom 54
5‘-CAA TAC CGG TAA CAC GTC C-3’
LedB2-F DQ231477
5‘-GAM ACC ACC TTC CTT GAT CTC C-3’
185~213 (GGT)n 54
5‘-CTA AAC ACC AAC ATC CGC C-3’
LedB6-F DQ231478
5‘-GAM GGT GAG AAA GAG ATC GAG G-3’
175~239 (GGT)n 54
5‘-GTG GCC GTG ATG TTC CTT-3’
LedD6-F DQ231479
5‘-FAM GCT CCT TCA CCT CGA CTT TGA-3’
182~257 (CCA)n 56
5‘-AGT GAA GGA ACA CCA CGG TCA-3’
aRepeated sequence indicates the motif of the strain allele.
phism was found in Led A8 (0.8144) > Led B2 (0.6194)
> Led D6 (0.5702) > Led B6 (0.4892) > Led A2 (0.0000).
The average PIC value among the 5 markers was 0.4987.
We also examined samples for the presence of confron- tation lines in order to identify the homozygosity and heterozygosity of the 10 shiitake strains (Table 5). Five Table 3. Genotypes of the 10 shiitake strains analyzed using the 5 markers
NIFoS No. Genotype
LedA2 LedA8 LedB2 LedB6 LedD6
1520 114/114 286/286 200/224 177/180 188/221
1521 114/114 258/258 215/215 183/183 215/221
1522 114/114 258/258 200/224 183/183 215/215
1561 114/114 258/280 200/224 183/195 215/227
2290 114/114 268/268 200/224 177/183 209/215
2497 114/114 256/282 200/200 183/183 215/215
2498 114/114 256/274 200/200 183/183 215/215
2499 114/114 268/268 200/212 183/186 215/218
2500 114/114 274/274 200/224 183/183 215/215
2783 114/114 270/286 209/209 177/177 188/188
NIFoS, National Institute of Forest Science.
Fig. 2. Electropherogram of Led A8 microsatellite marker in the wild Lentinula edodes. Results of genotype analysis performed using the GENEMAPPER v4.0 software on raw data obtained from analysis using a genetic analyzer on NIFoS 1520 (A), NIFoS 1561 (B), NIFoS 2497 (C), NIFoS 2498 (D), and NIFoS 2783 (E). X-axis, DNA size; Y-axis, peak signal height; NIFoS, National Institute of Forest Science.
cases among the 45 combinations (NIFoS 1520 × 1561, 1522 × 1651, 1561 × 2498, 2497 × 2498, 2497 × 2500) showed no confrontation lines. However, the other 40 combinations showed distinct confrontation lines (Table 5). Analysis of the population relationships using the ex- pectation-maximization (EM) algorithm function, a nei- ghbor joining method, showed genetic similarity based on frequency data (Fig. 3). Ten shiitake strains were grouped into 3 clades, and there was no correlation bet- ween geographical locations and genetic distance.
We used five microsatellite markers in this study. The marker Led A2 showed no genetic diversity of shiitake strains. All strains showed different genotypes regarding the other 4 markers. Led A8 had the highest allele num- ber, genotype number, and PIC. The PIC was estimated as the probability that a particular strain is informative with respect to segregation of its inherited alleles. Statis- tical analysis of PIC is an indicator of the power of discri- mination. PIC values greater than 0.5 indicate a high
power of discrimination [1]. The average PIC value for the five markers was 0.4987. However, the PIC values of three markers (Led B2, Led D6, and Led B6) were larger than 0.5; therefore, they were used to distinguish shiitake diversity. When the 10 strains were cultivated on PDA agar plates for the dual culture assay, 40/45 combinations formed combination lines. Confrontation lines indicate that tested strains are not compatible with each other although they are the same species. The neighbor-joining tree with the 10 L. edodes strains showed genetic distance among them. Strains were grouped into 3 clades; strains in clade I and III were originated from Mt. Jungwang, and strains in clade II from Mt. Gariwang and Mt. Jung- wang. When collected in the same compartment, genetic distances are closer than when collected in different com- partments. Strains in clade II were from 4 compartments in 2 mountains. NIFoS 2497 and 2498 were collected from the same site and the genotypic difference was small.
Xiang et al. [11] reported that genetic diversity was closely Table 4. Statistic analysis of the genotypic characteristics of the 10 shiitake strains
Locus Major allele frequency
Genotype
numbers Sample size Allele numbers Gene Diversitya (He)
Observed
Heterozygosityb (Ho) PICc
LedA2 1.00 1 10 1 0.0000 0.0000 0.0000
LedA8 0.25 8 10 8 0.8350 0.4000 0.8144
LedB2 0.50 5 10 5 0.6650 0.6000 0.6194
LedB6 0.65 6 10 5 0.5300 0.4000 0.4892
LedD6 0.60 7 10 6 0.6000 0.5000 0.5702
Mean 0.60 5.40 10 5 0.5260 0.3800 0.4987
aGene diversity, often referred to as expected heterozygosity, is defined as the probability that two randomly chosen alleles from the pop- ulation are different.
bObserved heterozygosity is the proportion of heterozygous individuals in the population.
cA closely related diversity measure is the polymorphism information content (PIC).
Table 5. Dual culture assay results using on the 10 shiitake strains
NIFoS 1520 1521 1522 1561 2290 2497 2498 2499 2500 2783
1520 Ο Ο X Ο Ο Ο Ο Ο Ο
1521 Ο Ο Ο Ο Ο Ο Ο Ο
1522 X Ο Ο Ο Ο Ο Ο
1561 Ο Ο X Ο Ο Ο
2290 Ο Ο Ο Ο Ο
2497 X Ο X Ο
2498 Ο Ο Ο
2499 Ο Ο
2500 Ο
2783
Ο indicates formation of a confrontation line. X indicates no formation of the confrontation line.
NIFoS, National Institute of Forest Science.
related to geographical distribution. However, NIFoS 2499 and 2290 were collected from two distant locations, but their genotypic difference was small. Chiu et al. [12] rep- orted that neighboring isolated shiitake mostly belong to different somatic compatibility groups, implying that the territory of L. edodes in the wild is very small. The smallest fruiting territory of L. edodes genes proved to be less than 20 cm in diameter. L. edodes possess a tetropo- lar incompatibility system, which allows mating between basidiospores from the same parent, at a rate of 25% [13].
Various genotypes in the same species are the consequ- ence of adaptation as a result of environmental change and preservation. This property of L. edodes in the nat- ural environment is useful for the development and imp- rovement of new L. edodes cultivars. The genetic diver- sity indicates that the total genetic characteristics in the genome of a species play important roles in the species’
survival and adaptability. Analysis of genetic diversity and population structure provide important information for surveying the origin and evolution of a species, and for identifying potential genetic resources for further utiliza- tion [14]. Ten shiitake mushrooms in the two mountains had various genotypic characteristics and they revealed no correlation with geographical distribution. This means that correlation between genetic diversity and geogra- phical location is not absolute. L. edodes has high repro- ducibility, polymorphism, reliability, and stability when using the microsatellite technique [2]. Microsatellite mar- ker data was able to contribute as the groundwork for selecting hybrid parent strains for producing superior
strains of L. edodes. In addition, microsatellites can signi- ficantly increase the density of markers, and can be used to compare and integrate different genetic maps. They can also aid in the location of genes of interest that have been identified in various crosses. Based on these advantages of the SSR and microsatellite techniques, they can be be- neficial in constructing a genetic map of L. edodes [2]. An increased number of markers could be used to determine the genotypic variety of shiitake, and for construction of linkage maps, cross breeding, mapping of quantitative trait loci, evolutional science. The markers can also aid in the protection of our mushroom under UPOV institu- tion and varied illegal cloned strains.
In conclusion, the oak mushroom populations of Mt.
Jungwang and Mt. Gariwang have a mixed gene pools.
However, further studies are needed to identify genetic similarities and variations among them.
Acknowledgements
This study was supported by grants from the general project (FP 0801-2016-01) of the National Institute of Forest Science and the Golden Seed Project of Breeding of new strains of shiitake for cultivar protection and sub- stitution of import (213003-04-4-SBH10), National Insti- tute of Forest Science, Republic of Korea.
REFERENCES
1. Kim KH, Kim YY, Ka KH, Lee HS, Bak WC, Jeong SJ, Seong Fig. 3. Neighbor joining tree showing the genetic relationships among the 10 strains of Lentinula edodes using five microsatellite markers. NIFoS, National Institute of Forest Science.
JY, Suh DS. Microsatellite markers for population-genetic stu- dies of shiitake (Lentinula edodes) strains. Genes Genomics 2009;31:421-30.
2. Xiao Y, Liu W, Dai Y, Fu C, Bian Y. Using SSR markers to evaluate the genetic diversity of Lentinula edodes natural germ- plasm in China. World J Microbiol Biotechnol 2010;26:527- 36.
3. Liu J, Wang ZR, Li C, Bian YB, Xiao Y. Evaluating genetic div- ersity and constructing core collections of Chinese Lentinula edodes cultivars using ISSR and SRAP markers. J Basic Micro- biol 2015;55:749-60.
4. Qin LH, Tan Q, Chen MJ, Pan YJ. Use of intersimple sequence repeats markers to develop strain-specific SCAR markers for Lentinula edodes. FEMS Microbiol Lett 2006;257:112-6.
5. Karaoglu H, Lee CM, Meyer W. Survey of simple sequence repeats in completed fungal genomes. Mol Biol Evol 2005;22:
639-49.
6. Terashima K, Matsumoto T, Hasebe K, Fukumasa-Nakai Y.
Genetic diversity and strain-typing in cultivated strains of Lentinula edodes (the shiitake mushroom) in Japan by AFLP analysis. Mycol Res 2002;106:34-9.
7. Terashima K, Matsumoto T. Strain typing of shiitake (Lentin- ula edodes) cultivars by AFLP analysis, focusing on a heat-
dried fruiting body. Mycoscience 2004;45:79-82.
8. Liu J. Power Marker v3.0 manual [Internet]. Power marker;
2016. Available from: http://statgen.ncsu.edu/powermarker/
downloads/Manual.pdf.
9. Liu K, Muse SV. PowerMarker: integrated analysis environ- ment for genetic marker data. Bioinformatics 2005;21:2128-9.
10. Nei M. Estimation of average heterozygosity and genetic dist- ance from a small number of individuals. Genetics 1978;89:
583-90.
11. Xiang X, Li C, Li L, Bian Y, Kwan HS, Nong W, Cheung MK, Xiao Y. Genetic diversity and population structure of Chinese Lentinula edodes revealed by InDel and SSR markers. Mycol Prog 2016;15:37.
12. Chiu SW, Wang ZM, Chiu WT, Lin FC, Moore D. An integ- rated study of individualism in Lentinula edodes in nature and its implication for cultivation strategy. Mycol Res 1999;103:
651-60.
13. Li AZ, Xu XF, Lin FX, Cheng SM, Lin FC. Cloning and iden- tification of partial DNA fragment for the B mating-type fac- tor in Lentinula edodes using degenerate PCR. World J Micro- biol Biotechnol 2007;23:411-5.
14. Rice WR. Analyzing tables of statistical tests. Evolution 1989;
43:223-5.