論文
Regional Differences of Chinese Passengers Satisfaction in Incheon International Airport
Myung Woo Lee*, Yeon Cheol Choi**, Kee Woong Kim***, Jeong-Tae Song****
권역차이에 따른 중국인 승객의 인천공항 이용 만족도
이명우*, 김기웅**, 송정태***, 최연철****
ABSTRACT
1983년에 중국 정부가 자국민의 해외 여행을 허가한 이래, 중국의 아웃바운드 해외 관광 시장은 비약적으로 발전하였다. 대한민국은 이러한 현상의 최대 수혜 국가 중 하나가 되었 으며, 항공운송 분야에 있어 특히 혜택을 보았다. 현재 인천국제공항의 전체 이용객 중 23.9%가 중국인이며, 추후에도 중국여객들이 인천국제공항의 주요한 고객으로 남을 것으로 전망된다. 중국의 광활한 영토와 13억이 넘는 인구를 고려할 때, 중국을 하나의 시장으로만 보는 것이 아니라 여러 지역들이 모인 집합체로 바라볼 필요성이 제기된다. 이렇게 할 시, 각 지역마다 다른 중국여객들이 공항 이용에 있어 보이는 태도와 행동양상의 차이점을 파악 하여, 차별화된 서비스 제공의 밑바탕이 될 수 있다. 이를 통하여 중국여객들의 인천국제공 항 이용 시 고객 가치와 만족도의 향상에 기여할 수 있다. 본 연구는 중국 정부가 경제, 사 회 등의 요소를 고려하여 공인한 방식대로 중국 전체를 다섯 개의 권역으로 분할하여 중국 여객들이 인천국제공항 이용에 있어 느끼는 만족도를 조사하고자 한다. 특별히 면세점 이용 과 관련된 만족도에 중점을 두고자 한다. 권역별로 지니는 차이점을 분석하여, 권역별로 상 이한 서비스 전략을 추진하기 위한 전략적 뱡향성을 제시한다.
Key Words : 지역 분할(Regional Segmentation), 인천국제공항(Incheon Int’l Airport), 서비스 (Service), 중국여객 행동(Chinese, Passenger Behavior)
2015년 11월 20일 접수 ~ 2015년 12월 17일 심사완료 게재 확정일 (2015년 12월 20일)
* 서울대학교 자유전공학부
** 한국항공대학교 항공경영학과
*** 인천국제공항공사
**** 한서대학교
연락저자, E-mail : [email protected] 충남 태안군 남면 신온리 태안비행장
I. Introduction
Ever since the Chinese government allowed cross-border travel of its citizens in 1983, the Chinese outbound travel market has grown at an explosive pace. In 2014 the total number of Chinese outbound tourists was one hundred seven million, making it the single greatest outbound travel market.
Being sited next to China, the Republic of Korea has been one of the greatest beneficiaries of this phenomenon. The number of Chinese tourists visiting Korea, so-called
"yo-u-ker"s increased steadily since 2000, and in 2014 alone one million one-hundred thirteen thousand "yo-u-ker"s visited Korea. With an estimation that by the year 2018 ten million Chinese tourists will visit Korea [1], the importance they have in the Korean tourism and air travel market will become even more significant.
The most prevalent mode of travel of these
Chinese tourists heading torwards Korea is air
travel, arriving at airports such as Incheon
http://dx.doi.org/10.12985/ksaa.2015.23.4.133International Airport (IIA). In 2014 more than ten million Chinese citizens used IIA, which makes up 23.9% of the total passengers who used IIA last year [2]. As a huge percentage of passengers using IIA are Chinese, the following study draws on the importance of implementing a systematic approach to understand in which ways these passengers act, and what their needs are [3].
Most of all, considering the fact that China consists of a land mass of more than 9 million square kilometers and a population greater than 1 billion, this study considers the importance of seeing China not just as a single market, but a collection of various regions with differently acting populations. Hence this study divided mainland China into five regions. With this division, this study focused on how passengers from different regions think about when using IIA's service, and what characteristics the Chinese passengers show in terms of overseas tourism and airport usage. If seen that there is a distinction among the passengers depending on each region, the goal of this study is to interpret the differences depending on each region.
Finally, with the obtained results, this study aims at providing a strategic recommendation in order to successfully correspond to Chinese passengers using IIA.
II. Regional Division of China
China consists of 23 provinces, 5 autonomous regions, 4 municipalities and 2 special administrative regions. Due to the inconvenience and complexity of seeing all these regions individually, the Chinese government groups administrative regions under the category of 7 regions [4]. These greater regions are used for the management of economic development initiatives. One individual region consists of provinces, autonomous regions or cities that share similar characteristics geographically, economically, culturally, and etc...
The seven regions discussed above are North China, Northeast China, East China, South China, Southwest China, Northwest China, and Western Region. North China is located in the North-Eastern region, and includes Beijing and Tianjin. Northeast China is at the Far East region, and includes Shenyang. East China is located below North China and includes Shanghai. South China is at the southernmost part and includes Guangzhou. Northeast China is located in central China, and includes Chongqing. Southeast China is southern of Northeast China, and includes Chengdu. The West Region is located at the far West of China, and includes Tibet.
For the purpose of accomplishing this study, it is necessary to look at Chinese passengers in terms of air travel and airport usage. Hence there was a change of the regional organization. The Western Region was eliminated due to political and economic circumstances, and a low number of Western Region residents visiting Korea, leading to trouble in acquiring samples required for this study.
Northeast China and Southeast China were consolidated in this study into Northwest/Southwest China due to the facts that the population of the two regions individually is rather small and that the number of direct flights to IIA are limited, which causes difficulties in collecting samples otherwise. Moreover, the fact that the Chinese government includes these two regions in the
"Western Grand Development" project highlights that the two regions are economically in a similar position,
As mentioned above, the following study shortly divided China into five regions:
Northeast, North, East, South and Southwest/Northwest China.
III. Research Construct
3.1 Research Methodology
The following study is an empirical study focusing on differences among the 5 regions in terms of choosing Korea as a tourism destination and in the usage patterns and needs regarding airport service.
3.2 Survey Construct
For positive analysis of the following research, a survey was conducted on Chinese passengers waiting to board flights in the airside region. Surveys were conducted on the third and fourth weeks of September 2015, in front of boarding gates of flights directly headed to representative cities in the five regions. They were conducted 15~30 minutes before boarding began, allowing passengers to be surveyed after they have finished using concierge services. Between 1 to 4 cities in each region have been chosen as representative cities of each region, based on the frequency of direct flights to/from IIA. Surveyors incorporated were those who could fluently communicate in Chinese.
The contents of the survey provided to Chinese passengers at IIA for the following research are as follows:
A) Airport Choice Factors (Purpose of visit, purpose of airport choice, source of airport -related information, etc...)
B) Airport Usage Satisfaction Rate (Arrival/
Departure Service, Duty-Free Satisfaction, etc.) C) Intention of Airport Re-Visit (Intention of
IIA Re-Visit, Intention of IIA Recommen- dation to others, etc.)
D) Population Characteristics (sex, age, place of residence, income, etc.)
The answers were in the order of 'Highly satisfied' (1), 'Satisfied' (2), 'Normal' (3), 'Unsatisfied' (4) and 'Highly Unsatisfied' (5).
The total number of survey sheets that were retained was 850. The number of surveys retained by region was 236 for North-East China, 151 for North China, 194 for East
China, 140 for South China and 129 for NorthWest/SouthWest China.
For questions regarding purpose of visit, air ticket reservation method and other questions that lead to answers that cannot be scaled, a nominal scale was used. For questions such as departure/arrival service, which can be scaled, a 5-point likert scale was used.
For statistical analysis of the following study SPSS version 22.0 was used. The methodology used was the Analysis of Variance (ANOVA), Levene's Test for Equality of Variances, and Scheffe's Analysis.
IV. Empirical Research 4.1 Characteristics of Samples
In order to directly survey passengers who have used services at IIA, the survey was undertaken at the airport. Considering that the survey asks questions regarding both arrival and departure services, surveys were conducted at the airside departure area.
The general characteristics of the 850 samples is as follows: in terms of age, 2%
were less than 20 years old, 47% were 20~29 years old, 34% were between 30~39, 12% were 40~49, 4% were 50~59 and 1% were 60 or older. It can be seen that passengers in their 20~30s are the main users of IIA. Looking at monthly earningss, 16% of the total passengers earned less than 7,000 yuan a month, 28%
earned 7,000~9,000 yuan per month while 56%
earned more than 9,000 yuan per month.
Hence it can be presented that a majority of Chinese passengers entering Korea are affluent [6].
4.2 Empirical Analysis 4.2.1 Analysis of Variance
In total, 68 questions were asked per questionnaire. Out of these 68 quesitons, 50 answers were measured on an interval scale.
The remaining 18 questions were either on a
nominal scale, or were open response
Sum of Squares df Mean
Square F Sig
re-use
between groups 3.322 4 .831 1.958 .099
within groups 358.382 845 .424
total 361.705 849
recom
between groups 2.427 4 .607 1.229 .297
within groups 416.943 845 .493
total 419.369 849
Acheck
between groups 1.256 4 .314 .515 .725
within groups 515.244 845 .610
total 516.500 849
Owifi between groups 6.565 4 1.641 1.807 .125
within groups 767.604 845 .908
total 774.169 849
Table 1. ANOVA Rejected Variables
(I) Region (J) Region (I-J) SE sig. level 95% conf. inter
lower higher
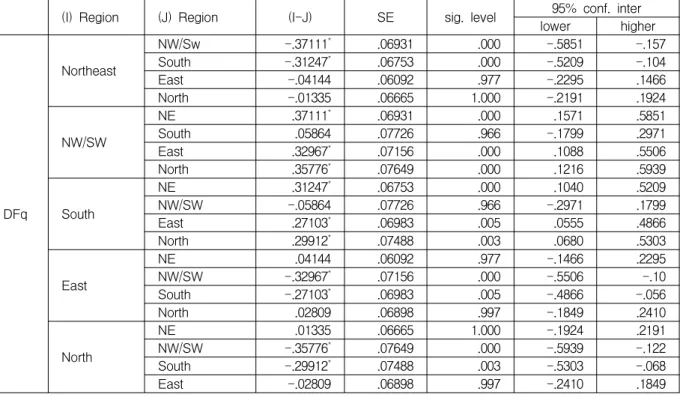
DFq
Northeast
NW/Sw -.37111* .06931 .000 -.5851 -.157
South -.31247* .06753 .000 -.5209 -.104
East -.04144 .06092 .977 -.2295 .1466
North -.01335 .06665 1.000 -.2191 .1924
NW/SW
NE .37111* .06931 .000 .1571 .5851
South .05864 .07726 .966 -.1799 .2971
East .32967* .07156 .000 .1088 .5506
North .35776* .07649 .000 .1216 .5939
South
NE .31247* .06753 .000 .1040 .5209
NW/SW -.05864 .07726 .966 -.2971 .1799
East .27103* .06983 .005 .0555 .4866
North .29912* .07488 .003 .0680 .5303
East
NE .04144 .06092 .977 -.1466 .2295
NW/SW -.32967* .07156 .000 -.5506 -.10
South -.27103* .06983 .005 -.4866 -.056
North .02809 .06898 .997 -.1849 .2410
North
NE .01335 .06665 1.000 -.1924 .2191
NW/SW -.35776* .07649 .000 -.5939 -.122
South -.29912* .07488 .003 -.5303 -.068
East -.02809 .06898 .997 -.2410 .1849
Table 2. Scheffe's Analysis for DFq
questions. Hence the 50 variables that can be used to attempt ANOVA were used in the statistical analysis. These 50 variables can be classified into the following: 1. Airline re-use/recommendation, 2. Arrival Service related satisfaction, 3. Departure Service related satisfaction, 4. Other Service related satisfaction, 5. Duty Free Service related satisfaction, 6.
Airport re-use/recommendation.
ANOVA was attempted on the 50 variables with a significance probability of 5% (0.05).
According to the results, 46 variables turned
out to be having similar variance, while 4
variables failed to pass ANOVA. This means
that there was a difference in variance. The 4
variables were intention of airline re-use
(re-use), intention of recommendation of airline
(recom), satisfaction regarding immigration
processing waiting time (Acheck), and airport
Wifi usage (Owifi). As these all had a
significance level above 0.05, these were chosen
to be left out for further analysis.
(I) Region (J) Region (I-J) SE sig. level 95% conf. inter lower higher
DFt
Northeast
NW/Sw -.36047* .07174 .000 -.5819 -.1390
South -.27143* .06989 .005 -.4872 -.0557
East .02764 .06305 .996 -.1670 .2223
North .06164 .06899 .939 -.1513 .2746
NW/SW
NE .36047* .07174 .000 .1390 .5819
South .08904 .07996 .871 -.1578 .3359
East .38810* .07406 .000 .1595 .6167
North .42211* .07917 .000 .1777 .6665
South
NE .27143* .06989 .005 .0557 .4872
NW/SW -.08904 .07996 .871 -.3359 .1578
East .29907* .07227 .002 .0760 .5222
North .33307* .07750 .001 .0938 .5723
East
NE -.02764 .06305 .996 -.2223 .1670
NW/SW -.38810* .07406 .000 -.6167 -.1595
South -.29907* .07227 .002 -.5222 -.0760
North .03401 .07139 .994 -.1864 .2544
North
NE -.06164 .06899 .939 -.2746 .1513
NW/SW -.42211* .07917 .000 -.6665 -.1777
South -.33307* .07750 .001 -.5723 -.0938
East -.03401 .07139 .994 -.2544 .1864
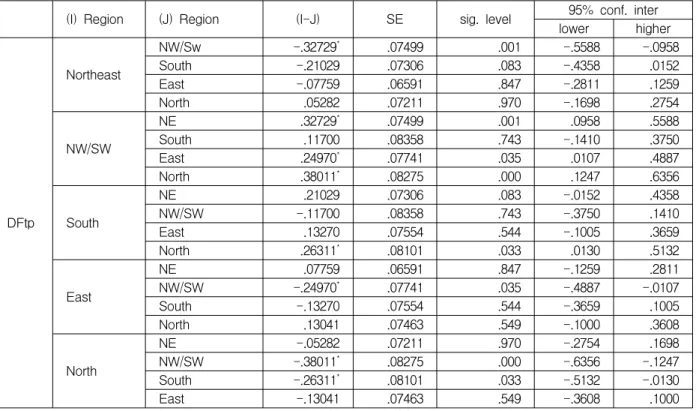
Table 3 Scheffe's Analysis for DFt
(I) Region (J) Region (I-J) SE sig. level 95% conf. inter
lower higher
DFtp
Northeast
NW/Sw -.32729* .07499 .001 -.5588 -.0958
South -.21029 .07306 .083 -.4358 .0152
East -.07759 .06591 .847 -.2811 .1259
North .05282 .07211 .970 -.1698 .2754
NW/SW
NE .32729* .07499 .001 .0958 .5588
South .11700 .08358 .743 -.1410 .3750
East .24970* .07741 .035 .0107 .4887
North .38011* .08275 .000 .1247 .6356
South
NE .21029 .07306 .083 -.0152 .4358
NW/SW -.11700 .08358 .743 -.3750 .1410
East .13270 .07554 .544 -.1005 .3659
North .26311* .08101 .033 .0130 .5132
East
NE .07759 .06591 .847 -.1259 .2811
NW/SW -.24970* .07741 .035 -.4887 -.0107
South -.13270 .07554 .544 -.3659 .1005
North .13041 .07463 .549 -.1000 .3608
North
NE -.05282 .07211 .970 -.2754 .1698
NW/SW -.38011* .08275 .000 -.6356 -.1247
South -.26311* .08101 .033 -.5132 -.0130
East -.13041 .07463 .549 -.3608 .1000