A study of consumers’ perceptions and prediction of consumption patterns for generic health functional foods
Nam E Kang
1, Ju Hyeon Kim
2, Yeon Kyoung Lee
3, Hye Young Lee
4and Woo Kyoung Kim
5§1
Department of Food and Nutrition, Eulji University, Seongnam, Gyunggi 461-723, Korea
2
Major of Hotel Culinary Art, Department of Tourism Information Management, Dong Seoul College, Seongnam, Gyunggi 461-714, Korea
3
Food Standardization Division, Food Standardization Department, Food Safety Bureau, Korea Food & Drug Administration, Osong Health Technology Administration Complex, Chungcheong 363-951, Korea
4
Functional Food Standardization Division, Food Standardization Department, Food Safety Bureau, Korea Food & Drug Administration, Osong Health Technology Administration Complex, Chungcheong 363-951, Korea
5
Department Food Science and Nutrition, Dankook University, 126 Jukjeon-dong, Suji-gu, Yongin, Gyunggi 448-701, Korea
Abstract
The Korea Food and Drug Administration (KFDA) revised the Health Functional Food Act in 2008 and extended the form of health functional foods to general food types. Therefore, this study was performed to investigate consumers’ perceptions of the expanded form of health functional food and to predict consumption patterns. For this study, 1,006 male and female adults aged 19 years and older were selected nationwide by multi-stage stratified random sampling and were surveyed in 1:1 interviews. The questionnaire survey was conducted by Korea Gallup. The subjects consisted of 497 (49.4%) males and 509 (50.6%) females. About 57.9% of the subjects recognized the KFDA's permission procedures for health functional foods. Regarding the health functional foods that the subjects had consumed, red ginseng products were the highest (45.3%), followed by nutritional supplements (34.9%), ginseng products (27.9%), lactobacillus-containing products (21.0%), aloe products (20.3%), and Japanese apricot extract products (18.4%). Opinions on expanding the form of health functional foods to general food types scored 4.7 points on a 7-point scale, showing positive responses. In terms of the effects of medicine-type health functional foods versus generic health functional foods, the highest response was ‘same effects if the same ingredients are contained’ at a rate of 34.7%. For intake frequency by food type, the response of ‘daily consistent intake’ was 31.7% for capsules, tablets, and pills, and 21.7% for extracts. For general food types, ‘daily consistent intake’ was 44.5% for rice and 22.8% for beverages, which were higher rates than those for medicine types. From the above results, consumers had positive opinions of the expansion of health functional foods to generic forms but are not expected to maintain accurate intake frequencies or amounts. Thus, continuous promotion and education are needed for proper intake of generic health functional foods.
Key Words: Health functional foods, generic functional food, consumers’ perception, consumption pattern, health claim
Introduction
6)Recent increases in the prevalence rates of chronic diseases along with rapid increases in aging populations have led to great demands for foods with health-improving functionalities. Korea entered the era of an aging society in 2000, and it is expected that the ratio of the population over age 65 will reach 14.3%
in 2018 and 20.8% in 2026, becoming a super-aged society [1].
A variety of health functional foods have been developed and sold to minimize the functional deterioration of the body.
Health functional foods are becoming of major interest in the health and food industries, as the tertiary function of foods, i.e., physiological regulation, is preferred worldwide, including in
Korea [2]. The worldwide market for health functional foods has been growing by 10% each year; in the USA it has grown by 6% annually. In addition, the market for the health functional foods has been rapidly growing in Japan [3]. In Korea, the total sales of domestic health functional foods were 700.9 billion won (domestic sales: 663.7 billion, export: 37.1 billion) as of 2006, among which red ginseng products accounted for 40.2% of the total sales, followed by aloe products, nutritional supplements, glucosamine-containing products, γ-linolenic acid-containing products, and chlorella products; these 6 products captured 81.5%
of the total sales [4].
In Korea, Health Functional Food Acts have been enforced since 2004 to control foods manufactured or processed in forms
This research was supported by a grant (09082KFDA103) from Korea Food & Drug Administration in 2009.
§Corresponding Author: Woo Kyoung Kim, Tel. 82-31-8005-3172, Fax. 82-31-8005-3170, Email. [email protected] Received: January 4, 2011, Revised: March 29, 2011, Accepted: March 29, 2011
ⓒ2011 The Korean Nutrition Society and the Korean Society of Community Nutrition
This is an Open Access article distributed under the terms of the Creative Commons Attribution Non-Commercial License (http://creativecommons.org/licenses/by-nc/3.0/) which permits unrestricted non-commercial use, distribution, and reproduction in any medium, provided the original work is properly cited.
of tablets, capsules, powders, granules, liquids, or pills using ingredients or components with functionalities useful to the human body, which are thus defined as 'health functional foods' [5]. Recently, the Korea Food and Drug Administration (KFDA) expanded the forms of health functional foods, where manufacture was previously limited to 6 forms including tablets, powders, granules, liquids, pills, and capsules. Now manufacturers of health functional foods can use general foodstuffs such as vegetable oil and tofu according to the revision of 'regulations on health functional foods' in 2008 to invigorate the health functional foods industry and enhance convenience for consumer intake [5].
As of March 2009, the numbers of health functional foods recognized as general foodstuff forms in Korea included 4 items of 3 types: vegetable oil, rice, and gum [6]. As of May 2009 in Japan, Foods for Specified Health Uses (FOSHU) as general foodstuff forms included a total of 855 permitted products, among which 179 were powdered soft drinks, 124 were soft drinks, and 61 were tea-type beverages [7]. Thus, it is expected that various types of health functional foods will be developed and sold in Korea as well.
Liberalization of the forms of health functional foods has been welcomed because it will contribute to industry expansion by allowing the development of numerous types of products.
However, some problems are also expected; for example, specific ingredients may be highly concentrated, health claims, which are not permitted for general foods, may be made, and intake cannot be accurately controlled in the form of general foods.
Therefore, this study was conducted to investigate nationwide consumer perceptions on health functional foods as well as consumers’ choices of food type for health functional foods after the form is extended to general foods.
Materials and Methods
Subjects and survey period
The subjects in this study were adult males and females 19 years of age and older who resided in Korea; they were selected by multi-stage stratified random sampling from 16 cities/
provinces based on administrative districts by the National Statistics Office. Sampling error was estimated with 95%
confidence. A total of 1,006 subjects were included (effective sample): 497 males (49.4%) and 509 females (50.6%). The survey period was Sept 2-Sept 21 (20 days) in 2009, and the survey was conducted by Korea Gallup.
Survey content and methods
A survey questionnaire was developed to investigate consumer perceptions on generic health functional foods and patterns of consumption. The survey was conducted via 1:1 interviews with
a trained interviewer. The questionnaire content included general characteristics, perceptions on health functional foods, purchase behavior toward health functional foods, current status of intake of health functional foods, perceptions on generic health functional foods, and expected intake patterns for generic health functional foods.
Statistical analysis
The collected data were statistically analyzed with weight assignments using PASW (ver. 17.0), and then frequencies, percentages, means, and standard deviations were obtained.
Chi-square tests, Student’s t-test, and Duncan multiple tests were performed to determine significant differences by each factor.
Results
General characteristics
The general characteristics of the subjects are shown in Table 1. The nationwide survey results of 1,006 adults included 497 (49.4%) males and 509 (50.6%) females. In the age distribution, 203 (20.2%) were in their 20s, 219 (21.8%) in their 30s, 228 (22.7%) in their 40s, 165 (16.4%) in their 50s, and 190 (18.9%) in their 60s or over, with even distribution by gender and age.
In terms of regions, 497 (49.4%) were from a metropolitan region, with 163 (16.2%) from Gyeongnam, 138 (13.7%) from Gyeongbuk, 106 (10.5%) from Jeolla, and 102 (10.2%) from Chungcheong; the regions were sampled in proportion to the population, with the highest ratios in metropolitan regions. In terms of areas, 476 (47.3%) were from large cities, 432 (42.9%) from small and medium cities, and 98 (9.7%) from eup or myeon.
For academic background, 440 (43.7%) were high school graduates and 390 (38.8%) were college students or graduates.
In terms of household income, 55 (5.5%) earned less than 1 million won, 171 (17.0%) between 1-2 million won, 270 (26.8%) between 2-3 million won, 295 (29.4%) between 3-4 million won, 96 (9.5%) between 4-5 million won, 105 (10.4%) more than 5 million won, and 14 (1.4%) were unknown/not answered. For occupation, 252 (25.0%) were self-employed, 212 (12.1%) were labor workers, 162 (16.1%) were office workers, 253 (25.2%) were housewives, 69 (6.9%) were students, and 57 (5.7%) were unemployed/other.
Perceptions on health functional foods
The subjects’ degree of interest in health functional foods was investigated using a 7-point scale (1 = not interested, 7 = very much interested); the total average score was 4.1 points: 3.8 points for the males and 4.3 points for the females, with a significant difference between the males and females (P < 0.05).
By age, the average was 3.5 points for those in their 20s, 3.9
Type Number of subjects (%)
Sex Male 497 (49.4)
Female 509 (50.6)
Age
(years) 19-29 203 (20.2)
30-39 219 (21.8)
40-49 228 (22.7)
50-59 165 (16.4)
over 60 190 (18.9)
Region Metropolitan 497 (49.4)
Gyeongnam 163 (16.2)
Gyeongbuk 138 (13.7)
Jeolla 106 (10.5)
Chungcheong 102 (10.2)
Area Large city 476 (47.3)
Small or medium city 432 (42.9)
Eup/myeon 98 (9.7)
Academic background Elementary school and lower 91 (9.0)
Middle school 83 (8.3)
High school 440 (43.7)
College and higher 390 (38.8)
Unknown/not answered 2 (0.2)
Monthly household income
Less than 1 million won 55 (5.5)
1-2 million won 171 (17.0)
2-3 million won 270 (26.8)
3-4 million won 295 (29.4)
4-5 million won 96 (9.5)
More than 5 million won 105 (10.4)
Unknown/not answered 14 (1.4)
Occupation Self-employed 252 (25.0)
Labor worker 212 (21.1)
Office worker 162 (16.1)
Housewife 253 (25.2)
Student 69 (6.9)
Unemployed/others 58 (5.8)
Total 1,006 (100)
Table 1. General characteristics of the subjects
Type N Score1)
Sex Male 497 3.8 ± 1.7*2)
Female 509 4.3 ± 1.6
Age 20s 203 3.5 ± 1.8a3)
30 219 3.9 ± 1.6b
40s 228 4.3 ± 1.6c
50s 165 4.4 ± 1.7c
60s and higher 190 4.3 ± 1.7c
Academic background
Elementary school and lower 91 4.1 ± 1.8NS4)
Middle school 83 4.4 ± 1.7
High school 440 4.2 ± 1.7
College and higher 390 3.8 ± 1.6
Not answered 2 3.1 ± 1.9
Region Large city 476 4.1 ± 1.6NS
Small or medium city 432 4.1 ± 1.8
Eup/myeon 98 4.2 ± 1.6
Total 1,006 4.1 ± 1.7
1)Mean ± standard deviation, 7-point scale: not interested 1 point - very much interested 7 points
2)*: T-test results, significant difference between males and females at P< 0.05
3)a b c: Duncan's multiple range test results, significant differences at P< 0.05
4)NS: not significant
Table 2. Degrees of interest in health functional foods
Type Yes (I know) No (I don't know) Unknown/not answered Total
SexNS1) Male 281 (56.4) 214( 43.0) 3 (0.6) 497 (100.0)
Female 302 (59.4) 205 (40.4) 1 (0.3) 509 (100.0)
Age*2) 20s 108 (53.2) 93 (46.0) 1 (0.7) 203 (100.0)
30s 121 (55.1) 99 (44.9) 0 (0.0) 219 (100.0)
40s 157 (68.9) 71 (31.1) 0 (0.0) 228 (100.0)
50s 97 (58.7) 68 (41.3) 0 (0.0) 165 (100.0)
Over 60s 100 (52.4) 88 (46.1) 3 (1.5) 190 (100.0)
Academic backgroundNS Elementary School and Lower 37 (41.3) 52( 57.0) 2 (1.7) 91 (100.0)
Middle school 44 (52.2) 38 (46.1) 1 (1.6) 83 (100.0)
High school 262 (59.7) 176 (40.0) 1 (0.3) 440 (100.0)
College and Higher 237 (60.8) 153 (39.2) 0 (0.0) 390 (100.0)
Not answered 2 (100) 0 (0.0) 0 (0.0) 2 (100.0)
RegionNS Large city 259 (54.5) 217 (45.5) 0 (0.0) 476 (100.0)
Small or Medium city 259 (59.9) 169 (39.1) 4 (1.0) 432 (100.0)
Eup/myeon 64 (65.9) 33 (34.1) 0 (0.0) 98 (100.0)
Total 583 (57.9) 419 (41.7) 4 (0.4) 1,006 (100.0)
1)NS: not significant
2)*: chi-square test, significant difference at P< 0.05
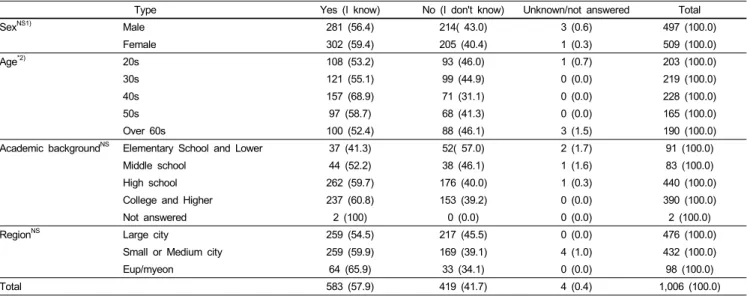
Table 3. Degrees of knowledge of approval procedures for health functional foods (%)
for those in their 30s, 4.3 for those in their 40s, 4.4 for those in their 50s, and 4.3 for those in their 60s or over, showing increased interest with age (P < 0.05). There was no difference by academic background or region (Table 2).
When asked whether they knew about the KFDA approval
procedures for health functional foods, 57.9% answered 'yes' and
41.7% answered 'no', showing that more than half of the subjects
were aware of the procedures. In terms of age groups, subjects
in their 40s and 50s showed higher rates of knowing the approval
procedures (P < 0.05), but no difference was observed by gender,
academic background, or region (Table 3).
Type
Function label Dosage label
Total#1) Always
check
Sometimes
check Not interested Do not know Always check
Sometimes
check Not interested Do not know
Sex*2) Male 122 (37.0) 98 (29.8) 106 (32.2) 3 (0.9) 180 (55.0) 81 (24.6) 67 (20.5) 0 (0.0) 328 (100.0) Female 197 (51.5) 104 (27.1) 80 (20.9) 2 (0.5) 265 (69.1) 79 (20.7) 38 (10.0) 1 (0.2) 383 (100.0)
Age 20s 35 (31.7) 41 (36.7) 34 (30.3) 1 (1.3) 57 (51.5) 26 (23.6) 28 (24.9) 0 (0.0) 111 (100.0)
30s 67 (45.5) 44 (29.8) 36 (24.7) 0 (0.0) 99 (67.0) 31 (20.7) 17 (11.8) 1 (0.6) 148 (100.0)
40s 90 (50.6) 49 (27.4) 38 (21.4) 1 (0.6) 116 (65.4) 41 (22.9) 21 (11.7) 0 (0.0) 178 (100.0)
50s 66 (41.8) 29 (27.2) 36 (29.2) 0 (1.8) 87 (66.3) 26 (20.2) 18 (13.5) 0 (0.0) 131 (100.0)
Over 60s 59 (41.8) 39 (27.2) 42 (29.2) 3 (1.8) 85 (59.7) 36 (25.1) 22 (15.2) 0 (0.0) 142 (100.0) Academic
background Elementary
school and lower 12 (22.5) 16 (29.5) 25 (46.2) 1 (1.8) 28 (50.6) 13 (24.7) 13 (24.6) 0 (0.0) 55 (100.0) Middle school 27 (42.9) 13 (21.3) 23 (35.8) 0 (0.0) 35 (54.8) 20 (31.7) 8 (13.5) 0 (0.0) 63 (100.0) High school 152 (48.0) 85 (26.9) 77 (24.3) 3 (0.8) 199 (62.6) 72 (22.7) 47 (14.7) 0 (0.0) 317 (100.0) College and
higher
127 (46.3) 85 (31.1) 60 (22.1) 1 (0.5) 184 (67.1) 53 (19.2) 37 (13.4) 1 (0.3) 274 (100.0)
Not answered 0 (0.0) 2 (100.0) 0 (0.0) 0 (0.0) 0 (0.0) 2 (100.0) 0 (0.0) 0 (0.0) 2 (100.0)
Region Large city 140 (41.3) 106 (31.4) 91 (27.0) 1 (0.3) 203 (60.0) 88 (25.9) 47 (14.1) 0 (0.0) 338 (100.0) Small or medium
city
137 (46.2) 79 (26.7) 77 (25.8) 4 (1.3) 188 (63.1) 61 (20.4) 48 (16.2) 1 (0.3) 297 (100.0)
Eup/myeon 42 (55.2) 16 (21.4) 18 (23.4) 0 (0.0) 54 (72.0) 11 (15.2) 10 (12.8) 0 (0.0) 75 (100.0) Total 319 (44.8) 202 (28.4) 186 (26.1) 5 (0.7) 445 (62.6) 160 (22.5) 105 (14.8) 1 (0.1) 711 (100.0)
1)#: Response of subjects who had experience to purchase the health functional food
2)*: chi-square test, significant difference at P< 0.05
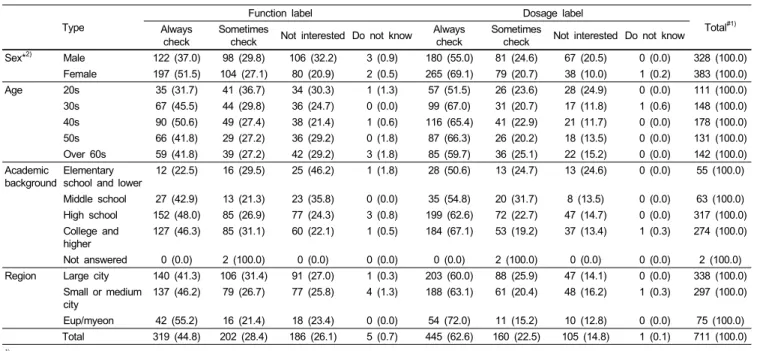
Table 4. Degrees of checking health claims and dosage labels when purchasing health functional foods (%)
Purchase behavior for health functional foods
The degree of checking health claim labels on packages when purchasing health functional foods was 44.8% for ‘always check’, 28.4% for ‘sometimes check’, and 26.1% for ‘not interested’.
51.5% of females and 37.0% of males answered that they ‘always check’ the health claim, which is a significant difference between males and females (P < 0.05). However, no significant differences were observed by age, academic background, and region. The degree of checking the daily dosage written on a package was 62.6% for ‘always check’, 22.5% for ‘sometimes check’, and 14.8% for ‘not interested’. 69.1% of females and 55.0% of males answered that they ‘always check’ the dosage label, which is a significant difference between males and females (P <
0.05).There were no significant differences by age, academic background, or region (Table 4).
Current status of consuming health functional foods
The results for intake experience, purpose, and the effects of consuming health functional foods are shown in Table 5. In terms of the health functional foods that subjects had experience consuming, red ginseng products scored the highest (45.3%), followed by nutritional supplements (34.9%), ginseng products (27.9%), lactobacillus-containing products (21.0%), aloe products (20.3%), and Japanese apricot extract products (18.4%). The purpose for consuming health functional foods differed according to food item, but 70-80% of the subjects considered ‘health improvement’ as the primary purpose. The effects of taking health functional foods were measured on a 7-point scale and scored 4.5-5.0 points.
Perceptions on generic health functional foods
Opinions on expanding the liberalization of food forms to general food types were evaluated on a 7-point scale, and the overall average score was 4.7 points; no significant differences were observed by gender, age, academic background, or region and area (Table 6). In terms of perceptions of the effects of medicine-type health functional foods and general-type health functional foods, the highest response ratio was 34.7% for ‘same effects if the same ingredients are contained’, followed by 31.3%
for ‘general food types are more effective’ and 26.4% for
‘medicine types are more effective’ (Table 7). In academic background groups, ‘medicine type is more effective’ was the highest response in the elementary school and lower group and the middle school group with 31.6% and 36.0%, respectively, and ‘general food type is more effective’ was the highest in the high school group with 35.1%, and ‘same effect if the same ingredient are contained’ was the highest in college and higher group with 40.0% (P < 0.05). For region, ‘general food type is more effective’ was the highest in the large city group with 35.5%, and ‘same effect if the same ingredient are contained’
was the highest in small or medium city group and eup/myeon group with 35.7% and 33.1%, respectively (P < 0.05).
Prediction of intake patterns for generic health functional foods
Opinions on intake frequency and amount by types of health
functional foods are shown in Tables 8 and 9. For intake
frequency, the response rate for ‘daily consistent intake’ was
31.7% for capsules, tablets, and pills, and 21.7% for extracts,
and for general food types, the response rates were 44.5% for
Health functional foods
Intake experience
no. of subjects (%) Intake purpose
no. of subjects (%)
Intake effect1)
Yes No Health
improvement
Disease prevention
Disease treatment
Weight reduction
Unknown/not answered
Red ginseng products 456 (45.3) 550 (54.7) 402 (88.2) 47 (10.2) 6 (1.3) 0 (0.0) 1 (0.3) 4.8 ± 1.2
Nutritional supplements 351 (34.9) 654 (65.1) 312 (88.8) 30 (8.6) 6 (1.6) 3 (0.9) 0 (0.0) 4.5 ± 0.9
Ginseng Products 281 (27.9) 725 (72.1) 244 (87.1) 34 (12.0) 3 (0.9) 0 (0.0) 0 (0.0) 4.7 ± 1.0
Lactobacillus products 211 (21.0) 795 (79.0) 175 (82.8) 20 (9.6) 6 (2.8) 10 (4.8) 0 (0.0) 4.4 ± 1.1
Aloe products 204 (20.3) 802 (79.7) 160 (78.1) 21 (10.2) 11 (5.3) 10 (4.9) 3 (1.4) 4.4 ± 1.1
Apricot extract products 185 (18.4) 821 (81.6) 155 (83.7) 17 (9.2) 8 (4.2) 1 (0.8) 4 (2.1) 4.5 ± 1.1 Grape seed oil products 182 (18.1) 824 (81.9) 156 (85.6) 11 (5.9) 2 (1.1) 9 (4.9) 4 (2.4) 4.2 ± 0.9 Glucosamine products 145 (14.4) 861 (85.6) 86 (59.3) 37 (25.8) 17 (11.4) 1 (1.0) 4 (2.5) 4.5 ± 1.1
EPA/DHA products 133 (13.2) 873 (86.8) 104 (78.6) 19 (14.1) 7 (5.6) 1 (1.1) 1 (0.6) 4.4 ± 1.2
Squalene products 129 (12.8) 877 (87.2) 104 (80.6) 17 (13.5) 8 (5.9) 0 (0.0) 0 (0.0) 4.4 ± 1.1
Processed chitosan products 114 (11.3) 892 (88.7) 95 (83.7) 14 (12.6) 1 (1.1) 0 (0.0) 3 (2.6) 4.4 ± 1.0
Royal-jelly products 112 (11.1) 894 (88.9) 98 (88.2) 12 (10.6) 1 (1.2) 0 (0.0) 0 (0.0) 4.8 ± 1.2
Chlorella products 107 (10.7) 899 (89.3) 86 (80.4) 13 (11.9) 2 (1.9) 5 (4.5) 1 (1.3) 4.4 ± 0.9
Green tea extract products 106 (10.5) 900 (89.5) 89 (84.0) 7 (6.5) 1 (1.1) 6 (6.1) 2 (2.2) 4.4 ± 1.1
Mushroom products 85 (8.5) 921 (91.5) 78 (91.1) 6 (6.6) 2 (2.3) 0 (0.0) 0 (0.0) 4.5 ± 1.2
Soy protein products 73 (7.3) 933 (92.7) 61 (83.8) 7 (9.8) 1 (1.0) 4 (5.5) 0 (0.0) 4.4 ± 1.2
γ-linolenic acid products 60 (5.9) 946 (94.1) 42 (70.8) 14 (23.1) 2 (3.6) 0 (0.0) 1 (2.4) 4.7 ± 1.1
Yeast products 59 (5.8) 947 (94.2) 48 (81.8) 6 (10.8) 2 (3.5) 2 (3.9) 0 (0.0) 4.6 ± 0.9
Eel oil products 42 (4.2) 964 (95.8) 38 (91.1) 4 ( 8.9) 0 (0.0) 0 (0.0) 0 (0.0) 4.7 ± 0.8
Enzyme products 42 (4.2) 964 (95.8) 34 (79.0) 3 (6.2) 1 (3.1) 5 (11.7) 0 (0.0) 4.8 ± 1.1
Processed pollen products 37 (3.7) 969 (96.3) 36 (97.4) 1 (2.6) 0 (0.0) 0 (0.0) 0 (0.0) 4.6 ± 0.9
Fermented plat extract products 25 (2.5) 981 (97.5) 21 (85.5) 3 (11.8) 1 (2.7) 0 (0.0) 0 (0.0) 4.6 ± 0.8
Plant sterol products 25 (2.5) 981 (97.5) 23 (90.4) 2 (9.6) 0 (0.0) 0 (0.0) 0 (0.0) 4.0 ± 0.7
Processed chlorophyll products 22 (2.1) 984 (97.9) 17 (76.6) 3 (13.4) 1 (3.1) 1 (6.9) 0 (0.0) 4.3 ± 1.1
β-carotene products 16 (1.6) 990 (98.4) 13 (82.8) 2 (12.8) 1 (4.4) 0 (0.0) 0 (0.0) 4.6 ± 1.2
Lecithin products 15 (1.5) 991 (98.5) 12 (80.8) 0 (0.0) 1 (9.2) 1 (10.0) 0 (0.0) 4.4 ± 0.9
Fructooligosaccharide products 14 (1.4) 992 (98.6) 9 (68.8) 4 (26.0) 1 (5.2) 0 (0.0) 0 (0.0) 4.2 ± 0.8
Alkoxy glycerol products 14 (1.4) 992 (98.6) 11 (75.2) 3 (24.8) 0 (0.0) 0 (0.0) 0 (0.0) 4.8 ± 1.2
Propolis products 13 (1.3) 993 (98.7) 9 (71.5) 2 (17.8) 1 (10.7) 0 (0.0) 0 (0.0) 4.8 ± 1.0
Germ products 12 (1.2) 994 (98.8) 10 (86.0) 1 (8.3) 1 ( 5.7) 0 (0.0) 0 (0.0) 4.4 ± 0.9
Chitooligosaccharide products 12 (1.2) 994 (98.8) 9 (75.2) 1 (6.8) 0 ( 0.0) 1 (5.7) 2 (12.3) 4.7 ± 1.1 Soft shelled turtle products 11 (1.1) 995 (98.9) 10 (87.4) 1 (12.6) 0 (0.0) 0 (0.0) 0 (0.0) 5.0 ± 1.0
Spirulina products 10 (1.0) 996 (99.0) 7 (65.0) 4 (35.0) 0 (0.0) 0 (0.0) 0 (0.0) 4.1 ± 1.4
Germ oil products 10 (1.0) 996 (99.0) 8 (84.0) 1 (9.5) 1 (6.5) 0 (0.0) 0 (0.0) 4.9 ± 1.3
Octacosanol products 6 (0.6) 100 (99.4) 4 (63.5) 2 (24.9) 1 (11.5) 0 (0.0) 0 (0.0) 4.9 ± 1.3
Mucopolysaccharide·protein products 4 (0.4) 1,002 (99.6) 3 (66.0) 1 (19.2) 1 (14.8) 0 (0.0) 0 (0.0) 4.9 ± 1.3
Red yeast rice products 1 (0.1) 1,005 (99.9) 1 (100.0) 0 (0.0) 0 (0.0) 0 (0.0) 0 (0.0) 4.0 ± 0.0
1)Mean ± standard deviation, 7-point scale: no effect at all 1 point - excellent effect 7 points, values of subjects who had experience taking the health functional food Table 5. Experience, purpose, and effects of taking health functional foods
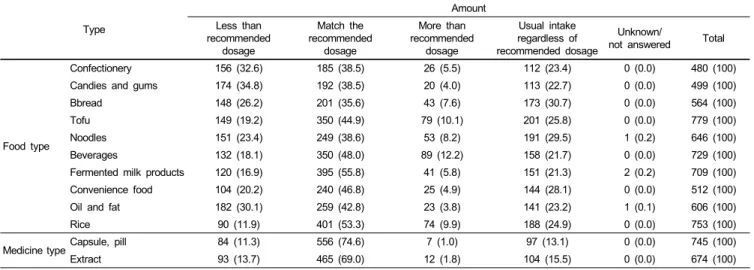
rice and 22.8% for beverages, which were higher than those for medicine types, and for other general food types, ‘occasional intake whenever I want’ was the highest response. For intake amount, medicine types showed a 70% response rate for ‘match the recommended dosage’ but general food types showed lower response rates than medicine types and ‘less than the recommended dosage’ or ‘usual intake regardless of the recommended dosage’
were the primary responses. For the types of foods to be consumed according to health claims of health functional foods, the results showed that tofu, rice, beverages, fermented milk, and vegetable oils were highly preferred regardless of health claims.
When consuming health functional foods to alleviate physical
fatigue, 72% of the respondents answered that they consumed
them as medicine type such as capsule, tablet, and pill; and for
general food types, 76.9% consumed them as tofu, 75.5% as rice,
74.9% as beverages, 68.8% as fermented milk, and 63.7% as
noodles. When taking health functional foods to alleviate fatigue,
increase calcium absorption, improve bowel movement/increase
beneficial intestinal bacteria, and maintain blood pressure health,
the responses for taking medicine types and general food types
were similar. However, when consuming health functional foods
for weight reduction, skin health, liver function, and blood
Type No. Score1)
Sex Male 497 4.6 ± 1.5NS2)
Female 509 4.7 ± 1.5
Age 20s 203 4.7 ± 1.4
30s 219 4.6 ± 1.5
40s 228 4.7 ± 1.4
50s 165 4.7 ± 1.6
60s and higher 190 4.6 ± 1.5
Academic
background Elementary school and lower 91 4.2 ± 1.6 NS3)
Middle school 83 4.5 ± 1.5
High school 440 4.8 ± 1.5
College and higher 390 4.6 ± 1.4
Not answered 2 6.1 ± 1.9
Region Large city 476 4.7 ± 1.4NS
Small or medium city 432 4.6 ± 1.6
Eup/myeon 98 4.8 ± 1.4
Total 1,006 4.7 ± 1.5
1)Mean ± standard deviation, 7-point scale: very much negative 1 point - very much positive 7 points
2)NS: not significant
3)Except ‘not answered’ data
Table 6. Opinions regarding expanding the form of generic health functional foods
Type Medicine type is more
effective General food type is more
effective Same effect if the same
ingredients are contained I don't know Total
Sex Male 135 (27.2) 156 (31.4) 166 (33.4) 40 (8.0) 497 (100.0)
Female 131 (25.7) 158 (31.1) 183 (35.9) 37 (7.2) 509 (100.0)
Age 20s 52 (25.4) 54 (26.6) 88 (43.2) 10 (4.8) 203 (100.0)
30s 61 (27.7) 71 (32.6) 74 (33.6) 14 (6.2) 219 (100.0)
40s 52 (22.8) 84 (36.7) 79 (34.8) 13 (5.7) 228 (100.0)
50s 55 (33.0) 55 (33.1) 46 (28.1) 10 (5.9) 165 (100.0)
60s and higher 47 (24.7) 51 (26.7) 62 (32.4) 31 (16.2) 190 (100.0)
Academic background*1)
Elementary school and lower 29 (31.6) 18 (20.2) 27 (30.3) 16 (17.9) 91 (100.0)
Middle school 30 (36.0) 24 (29.1) 21 (25.5) 8 (9.4) 83 (100.0)
High school 107 (24.3) 154 (35.1) 143 (32.5) 36 (8.1) 440 (100.0)
College and higher 100 (25.6) 118 (30.1) 156 (40.0) 17 (4.4) 390 (100.0)
Not answered 1 (29.5) 0 (0.0) 2 (70.5) 0 (0.0) 2 (100.0)
Region* Large city 118 (24.8) 169 (35.5) 162 (34.1) 27 (5.6) 476 (100.0)
Small or medium city 117 (27.1) 117 (27.2) 154 (35.7) 43 (10.0) 432 (100.0)
Eup/myeon 30 (31.1) 28 (28.8) 32 (33.1) 7 (7.0) 98 (100.0)
Total 266 (26.4) 315 (31.3) 349 (34.7) 77 (7.6) 1,006 (100.0)
1)*: chi-square test, significant difference at P< 0.05
Table 7. Perceptions on the effects of medicine type health functional foods and general food type health functional foods by number of subjects (%)
circulation improvement, the respondents preferred general food types to medicine types. And when taking health functional foods for joint and cartilage health, eye health, blood glucose control, and immune function, respondents preferred medicine types to general food types (Fig. 1).
Discussion
This study was performed to investigate the perceptions of consumers regarding the expanded form of health functional
foods and to predict consumption patterns.
The degree of interest in health functional foods was 4.1 points out of a 7-point scale, and females (4.3 points) had significantly higher interest than males (3.8 points), which is consistent with a report showing that females were highly interested in health functional foods and tended to frequently consume them [8]. To sell health functional foods, a company that develops a relevant health functional food must submit data to KFDA to prove its functionality, which is then evaluated through an evidence-based ranking system [9]. About 57.9% of the subjects recognized the KFDA's permission procedures for such health functional foods, which is a higher percentage than that found in a study of adults in the Busan and Gyeongnam areas in 2006, which showed that 20.8% of males and 33.1% of females were aware of the establishment of laws and regulations on health functional foods [10]. The recognition of laws and regulations or permission procedures for health functional foods has increased with time, but it still remains low. The ratio of subjects who checked health claim labels on packages when purchasing health functional foods was low at 44.8%, and the ratio of those who reviewed intake or dosage information was 62.2%. Therefore, permission procedures for health functional foods and education on intake purposes and intake methods should be continuously promoted.
In this study, among health functional foods, experience consuming red ginseng products was highest (45.3%) followed by nutritional supplements, ginseng products, lactobacillus- containing products, and aloe products. According to data from the 2007 National Health and Nutrition Survey, 33.4% of the national population had experience taking vitamin/mineral supplements or health functional foods, with 28.4% being males and 38.5% females, thus showing higher intake in females [11].
In a survey of college students, intakes were in the order of
nutritional supplements, red ginseng products, and ginseng
Type Frequency
Daily consistent intake Occasional intake No intake Unknown/not answered Total
Food type Confectionery 54 (5.3) 426 (42.3) 526 (52.3) 0 (0.0) 1,006 (100)
Candies and gums 74 (7.4) 424 (42.2) 507 (50.4) 0 (0.0) 1,006 (100)
Bread 39 (3.8) 525 (52.2) 442 (44.0) 0 (0.0) 1,006 (100)
Tofu 132 (13.1) 648 (64.4) 224 (22.2) 3 (0.3) 1,006 (100)
Noodles 5 9(5.9) 587 (58.3) 360 (35.8) 0 (0.0) 1,006 (100)
Beverages 229 (22.8) 500 (49.7) 276 (27.4) 1 (0.1) 1,006 (100)
Fermented milk products 179 (17.8) 530 (52.6) 297 (29.5) 0 (0.0) 1,006 (100)
Convenience food 104 (10.4) 408 (40.6) 494 (49.1) 0 (0.0) 1,006 (100)
Oil and fat 90 (8.9) 516 (51.3) 399 (39.7) 1 (0.1) 1,006 (100)
Rice 448 (44.5) 305 (30.3) 253 (25.2) 0 (0.0) 1,006 (100)
Medicine type Capsule, pill 319 (31.7) 426 (42.4) 261 (26.0) 0 (0.0) 1,006 (100)
Extract 219 (21.7) 455 (45.3) 332 (33.0) 0 (0.0) 1,006 (100)
Table 8. Estimation of intake frequency according to types of generic health functional foods by number of subjects (%)
Type
Amount Less than
recommended dosage
Match the recommended
dosage
More than recommended
dosage
Usual intake regardless of recommended dosage
Unknown/
not answered Total
Food type
Confectionery 156 (32.6) 185 (38.5) 26 (5.5) 112 (23.4) 0 (0.0) 480 (100)
Candies and gums 174 (34.8) 192 (38.5) 20 (4.0) 113 (22.7) 0 (0.0) 499 (100)
Bbread 148 (26.2) 201 (35.6) 43 (7.6) 173 (30.7) 0 (0.0) 564 (100)
Tofu 149 (19.2) 350 (44.9) 79 (10.1) 201 (25.8) 0 (0.0) 779 (100)
Noodles 151 (23.4) 249 (38.6) 53 (8.2) 191 (29.5) 1 (0.2) 646 (100)
Beverages 132 (18.1) 350 (48.0) 89 (12.2) 158 (21.7) 0 (0.0) 729 (100)
Fermented milk products 120 (16.9) 395 (55.8) 41 (5.8) 151 (21.3) 2 (0.2) 709 (100)
Convenience food 104 (20.2) 240 (46.8) 25 (4.9) 144 (28.1) 0 (0.0) 512 (100)
Oil and fat 182 (30.1) 259 (42.8) 23 (3.8) 141 (23.2) 1 (0.1) 606 (100)
Rice 90 (11.9) 401 (53.3) 74 (9.9) 188 (24.9) 0 (0.0) 753 (100)
Medicine typeCapsule, pill 84 (11.3) 556 (74.6) 7 (1.0) 97 (13.1) 0 (0.0) 745 (100)
Extract 93 (13.7) 465 (69.0) 12 (1.8) 104 (15.5) 0 (0.0) 674 (100)
Table 9. Estimation of intake amount according to the type of generic health functional foods by number of subjects (%)
products [12]. In elementary students and adolescents, the intake of nutritional supplements was highest; however, in middle and older age groups, intakes of red ginseng products and ginseng products were highest [13]. The subjects in the present study were in their adult or older years, and thus the intake of red ginseng products seemed to be higher. In terms of the purpose for consuming health functional foods, the response ‘health improvement’ was highest with 70-80%, which is higher than 45.0% in a 2006 survey [10] and 64.3% in a 2008 study [11].
Consumer perceptions on expanding the forms to general food types were evaluated on a 7-point scale and the overall average score was 4.7 points. A view that medicine types and general food types have the same effects if they contain the same ingredients was held by 34.7%, which suggests a positive evaluation for general food type health functional foods.
However, for generic health functional foods, the subjects responded more with ‘occasional intake whenever I want’ than with ‘daily consistent intake’. For intake amount, medicine types showed higher responses for ‘match the recommended dosage’
but generic health functional foods, although different depending on type, showed higher responses for ‘less than the recommended
dosage’ or ‘usual intake regardless of the recommended dosage’.
Thus education and promotion of accurate intake frequencies and amounts should be carried out when general food type (generic) health functional foods are developed and sold.
The types of general foods preferred for health functional foods included tofu, rice, beverages, fermented milk, and noodles, but the predicted intake ratios of general food types were different depending on the health claims assigned. In the case of taking health functional foods to alleviate fatigue, increase calcium absorption, improve bowel movement/increase beneficial intestinal bacteria, and maintain blood pressure health, the responses for consuming medicine types and general food types were similar.
However, in the case of consuming health functional foods for
weight reduction, skin health, liver function, and blood circulation
improvements, the respondents highly preferred general food
types. And when consuming health functional foods for joint and
cartilage health, eye health, blood glucose control, and immune
function, the respondents preferred medicine types. It is important
to understand such tendencies of consumers when developing
health functional foods. FOSHU in Japan are similar to the
generic health functional foods of Korea in terms of labeling
Alleviate physical fatigue Promote absorption of calcium
Improve bowel movement Assist in adjusting blood pressure
Reduced body fat Improve water content in skin
Improve liver health Assist in blood circulation
Improve bone/joint health Alleviate eye fatigue
Assist in adjusting blood sugar Enhance immune function Fig. 1. Food types according to the health claims of health functional foods
to indicate functionality on generic health functional foods. Until the present time (May 2009), when classifying FOSHU in Japan according to target functionality, products for regulating bowel conditions were highest at 310 products, followed by those for blood cholesterol improvement (129 products) and blood glucose improvement (127 products). For bowel-improving products, powdered beverages were highest followed by fermented milk, lactobacillus-containing drinks, and table sugar (oligosaccharides).
For cholesterol-improving products, the items were in the order of powdered beverages, beverages, and powdered jelly drinks, and for glucose-improving products, the order was tea-type beverages, powdered beverages, and dried soups, showing various food types depending on their functionality [6]. As of 2009, three forms of general food (rice, gum, and vegetable oil) had been approved as health functional foods in Korea, and it is expected that other such products will be developed in the future.
From the above results, Korean consumers showed favorable responses to generic health functional foods but cannot be expected to regularly consume accurate amounts; thus, several measures as well as education are needed to address these concerns.
References
1. Korea National Statistical Office. Population projections for Korea: 2005-2050. 2006.
2. Hel KO, Lee EH, Kim SW, Kim KJ, Cha KO. Consumer's Trend and Market. Seoul: Kyomunsa; 2006. p.79-89.
3. Lee SY. Trends and prospect in market of health functional food.
Food Sci Ind 2007;40:16-20.
4. Korea Food and Drug Administration. A Study for Improving Food & Drug Statistical Year Book. 2007.
5. Kim JY. Current status of health/functional food-past, present and the future. Safe Food 2008;3:6-11.
6. Korea Food and Drug Administration [Internet]. Functional ingredients [cited 2009 Jun 09]. Available from: http://hfoodi.
kfda.go.kr/material/mat2_list.jsp?cateIdx=22.
7. Ministry of Helath, Labor and Welfare, Japan [Internet]. Food with health claims, food for special dietary uses, and nutrition labeling [cited 2009 Dec 11] Available from: http://www.
mhlw.go.jp/english/topics/foodsafety/fhc/index.html.
8. Park JH, Kwon OO. A study on consumption behavior of health functional food. Korean J Food Mark Econ 2007;24:43-57.
9. Korea Food and Drug Administration [Internet]. KFDA approval procedure for health functional food [cited 2009 Jun 09].
Available from: http://hfoodi.kfda.go.kr/material/material.jsp?cate Idx=57.
10. Kim H, Kim M. A study on health-functional foods intake pattern of consumers in Busan and Gyeongnam region. J Korean Living Sci Assoc 2006;15:341-52.
11. Ministry of Health & Welfare. Report of National Health and Nutrition Survey 2007. 2008.
12. Kim SH. A study on the use of health functional foods and its related influencing factors of university students in Korea.
Korean J Food Cult 2010;25:150-9.
13. Kim WY. Tolerable upper Intake Levels for Vitamins and Minerals in Functional Foods for Health (Vitamins and Minerals I) 04052KFDA124. 2004.
14. Jeoug SJ. Plan of information service publicity through the survey on the consumer’s usage and recognition of functional food [master’s thesis]. Anseong: Chung-Ang University; 2007.