INTRODUCTION
Ultrasound (US) elastography is a non-invasive tool used in chronic liver disease for staging liver fibrosis or predicting
Technical Performance of Two-Dimensional Shear Wave Elastography for Measuring Liver Stiffness: A Systematic Review and Meta-Analysis
Dong Wook Kim, MD
1*, Chong Hyun Suh, MD
1*, Kyung Won Kim, MD, PhD
1, Junhee Pyo, MS
2, Chan Park, MD
3, Seung Chai Jung, MD, PhD
11Department of Radiology and Research Institute of Radiology, University of Ulsan College of Medicine, Asan Medical Center, Seoul, Korea; 2WHO Collaborating Center for Pharmaceutical Policy and Regulation, Department of Pharmaceutical Science, Utrecht University, Utrecht, Netherlands;
3Department of Radiology, Chonnam National University Hospital, Gwangju, Korea
Objective: To assess the technical performance of two-dimensional shear wave elastography (2D-SWE) for measuring liver stiffness.
Materials and Methods: The Ovid-MEDLINE and EMBASE databases were searched for studies reporting the technical performance of 2D-SWE, including concerns with technical failures, unreliable measurements, interobserver reliability, and/or intraobserver reliability, published until June 30, 2018. The pooled proportion of technical failure and unreliable measurements was calculated using meta-analytic pooling via the random-effects model and inverse variance method for calculating weights.
Subgroup analyses were performed to explore potential causes of heterogeneity. The pooled intraclass correlation coefficients (ICCs) for interobserver and intraobserver reliability were calculated using the Hedges-Olkin method with Fisher’s Z transformation of the correlation coefficient.
Results: The search yielded 34 articles. From 20 2D-SWE studies including 6196 patients, the pooled proportion of technical failure was 2.3% (95% confidence interval [CI], 1.3–3.9%). The pooled proportion of unreliable measurements from 20 studies including 6961 patients was 7.5% (95% CI, 4.7–11.7%). In the subgroup analyses, studies conducting more than three measurements showed fewer unreliable measurements than did those with three measurements or less, but no intergroup difference was found in technical failure. The pooled ICCs for interobserver reliability (from 10 studies including 517 patients) and intraobserver reliability (from 7 studies including 679 patients) were 0.87 (95% CI, 0.82–0.90) and 0.93 (95% CI, 0.89–
0.95), respectively, suggesting good to excellent reliability.
Conclusion: 2D-SWE shows good technical performance for assessing liver stiffness, with high technical success and reliability.
Future studies should establish the quality criteria and optimal number of measurements.
Keywords: Elasticity imaging techniques; Liver; Meta-analysis; Ultrasonography
Received November 23, 2018; accepted after revision March 6, 2019.
This study was supported by a grant (No. 2016-719) from the Asan Medical Center, Seoul, Korea and a grant (No. 2017R1A2B3011475) from the National Research Foundation of Korea.
*These authors contributed equally to this work.
Corresponding author: Kyung Won Kim, MD, PhD, Department of Radiology and Research Institute of Radiology, University of Ulsan College of Medicine, Asan Medical Center, 88 Olympic-ro 43-gil, Songpa-gu, Seoul 05505, Korea.
• Tel: (822) 3010-4377 • Fax: (822) 476-4719 • E-mail: [email protected]
This is an Open Access article distributed under the terms of the Creative Commons Attribution Non-Commercial License (https://
creativecommons.org/licenses/by-nc/4.0) which permits unrestricted non-commercial use, distribution, and reproduction in any medium, provided the original work is properly cited.
portal hypertension. Among several US elastography techniques, two-dimensional shear wave elastography (2D-SWE) is the latest method using an acoustic radiation force impulse (ARFI) to cause liver-tissue deformation
Korean J Radiol 2019;20(6):880-893https://doi.org/10.3348/kjr.2018.0812
and eventually generate a shear wave. It provides a 2D quantitative map of liver stiffness values over a large region of interest (ROI) by placing the ARFI focus at multiple sequential locations and capturing the generated shear waves. Because 2D-SWE involves real-time imaging, both the depth and size of sampling areas can be chosen manually at desired locations with no mass, large vessels, or artifacts.
2D-SWE has been integrated into most clinical US systems with the same probes as that used in traditional US (1).
Owing to its advantages, 2D-SWE helps assess the stability of measuring and quantifying an average stiffness value in a large ROI for higher reliability (2). However, because of its relative novelty, 2D-SWE has not yet been validated and some aspects remain incompletely clarified (3). Validating a diagnostic device for clinical use involves two main processes: 1) diagnostic accuracy—the evidentiary process of linking a biomarker with clinical endpoints and biologic processes and 2) technical performance—assessment of technical success/failure and measurement variability (4).
Thus far, most clinical validation attempts have focused on the good diagnostic accuracy of 2D-SWE for the degree of liver fibrosis (1, 2, 5, 6). Nevertheless, its technical performance also needs assessment. Although 2D-SWE systems from different manufacturers have custom built-in indicators for better measurement quality and stability, the evidence supporting them are limited (7). Indeed, previous studies evaluating the technical performance of 2D-SWE were generally small-scale studies with low-level evidence (8-41). To increase the level of evidence and arrive at more evidence-based results, sufficient evidence should be accumulated and summarized.
Therefore, we conducted this systematic review and meta- analysis to evaluate the technical performance of 2D-SWE for measuring liver stiffness.
MATERIALS AND METHODS
Institutional Review Board approval was not required because of the nature of our study, which was a systemic review and meta-analysis. Our systematic review and meta-analysis followed the Preferred Reporting Items for Systematic Reviews and Meta-Analyses guidelines (42).
Literature Search Strategy
We conducted an electronic literature search to identify suitable studies from the Ovid-MEDLINE (U.S. National Library of Medicine) and EMBASE (Elsevier) databases until
June 30, 2018 (Supplementary Materials in the online-only Data Supplement).
Eligibility Criteria and Study Selection
We tried to evaluate the technical performance of 2D-SWE for measuring liver stiffness. Thus, we included studies and study subsets that evaluated any of the following outcomes by using 2D-SWE for measuring liver stiffness: 1) technical failure; 2) unreliable measurements; 3) interobserver reliability; and 4) intraobserver reliability.
Technical failure was the inability to obtain an adequate signal for all acquisitions, which was adopted in all studies consistently. As unreliable measurements were randomly defined across studies without consensus, we used the slightly different definitions of unreliable results employed in each of the included studies. Regarding measurement reliability, we included studies comparing the stiffness between different observers (interobserver reliability) and between different sessions by the same observer (intraobserver reliability).
The exclusion criteria were as follows: 1) studies
reporting insufficient data for outcomes (i.e., an ambiguous definition of technical failure); 2) studies including
pediatric populations; 3) studies using other elastography modalities (i.e., transient elastography [TE] or point shear-wave elastography); 4) partially overlapping patient cohorts; 5) case reports or series including less than 10 patients; and 6) reviews, guidelines, consensus statements, editorials, letters, comments, or conference abstracts.
Literature search and study selection were performed by one reviewer and double checked by other two reviewers.
Data Extraction
Data pertaining to the following parameters were extracted using a standardized form: 1) study characteristics: authors, institution, duration of patient recruitment, year of publication, and study design (prospective vs. retrospective); 2) patient characteristics:
number of patients, male-to-female ratio, mean age, age range, and etiology; 3) technical characteristics of 2D-SWE:
device, manufacturer, transducer, measurement number,
representative value (mean or median), and number of
observers; and 4) study outcomes: proportion of technical
failure, proportion of unreliable measurements, and
intraclass correlation coefficient (ICC) for interobserver and
intraobserver reliability, if any. Additionally, possible factors
influencing technical failure or unreliable measurements in
each eligible study were evaluated.
The data extraction was performed by two reviewers independently. Any disagreements were resolved with a 3rd reviewer. There was no major controversial issue.
Quality Assessment
The methodological quality of the selected studies was assessed by one reviewers using tailored questionnaires and criteria provided by the Quality Assessment of Diagnostic Accuracy Studies-2 (QUADAS-2) (43).
Data Synthesis and Analysis
This meta-analysis assessed four main indices: 1) pooled proportion of technical failure; 2) pooled proportion of unreliable measurements; 3) pooled ICC for interobserver reliability; and 4) pooled ICC for intraobserver reliability.
If the indices were obtained by two or more observers, especially for the evaluation of intraobserver reliability, representative data (i.e., mean values of all observers’
outcomes) were chosen for analysis. Otherwise, data from the observer with the highest value were used.
The pooled proportions of technical failure and unreliable measurements were calculated using meta-analytic
pooling via the inverse variance method for calculating weights (44-46). Random-effects meta-analysis of single proportions was used to obtain an overall proportion. Logit transformation of proportion was performed. The Clopper- Pearson interval for individual studies was used to obtain the confidence intervals (CIs), and a continuity correction of 0.5 was performed in studies with zero cell frequencies.
Heterogeneity among studies was determined using 1) Cochran’s Q-test for summary estimates with p < 0.05 indicating heterogeneity and 2) the Higgins inconsistency index (I
2), which indicates the percentage of variance in a meta-analysis (a rough guide to interpretation: 0–40%, heterogeneity might not be important; 30–60%, moderate heterogeneity may be present; 50–90% substantial heterogeneity may be present; and 75–100%, considerable heterogeneity may be present) (47, 48). Publication bias was assessed using funnel plots visually and Egger’s test with p < 0.10 indicating significant bias (49). Publication- bias-adjusted pooled estimate was also calculated using the trim-and-fill method (50). A sensitivity analysis was conducted using a leave-one-out analysis to identify outliers and evaluate the influence of a single study.
Moreover, subgroup analyses were performed on the following covariates: 1) measurement numbers (≤ 3 vs. > 3)
(7); 2) manufacturer; and 3) etiology (chronic liver disease vs. liver cirrhosis). Specifically, from some of the eligible studies that included both healthy and diseased cohorts (25, 29, 36, 38), we extracted more detailed outcomes of patients with chronic liver disease or liver cirrhosis. Thus, for subgroup analyses on different etiologies (chronic liver disease vs. liver cirrhosis), we also included these subgroup data.
To calculate the pooled ICC for interobserver and intraobserver reliability, we used the Hedges-Olkin method with Fisher’s Z transformation of the correlation coefficient (51). With this method, the ICC was converted to Z transforms; thereafter, a mean transformed correlation weighted by sample size was calculated. Once a 95% CI was obtained for the pooled Z score, it was transformed back to a 95% CI for the pooled ICC with both fixed- and random-effects models. The value of ICC can be interpreted as follows: < 0.50, poor; 0.50–0.74, moderate;
0.75–0.89, good; and 0.90–1.00, excellent reliability (52).
Heterogeneity and publication bias were also assessed in a similar manner to the pooled proportion of technical failure and unreliable measurement.
All statistical analyses were performed by two reviewers (with 2 and 6 years of experience, respectively, in
performing systematic reviews and meta-analyses) using the
“metafor” and “meta” packages in R software version 3.5.1 (R Foundation for Statistical Computing).
RESULTS
Literature Search and Quality Assessment
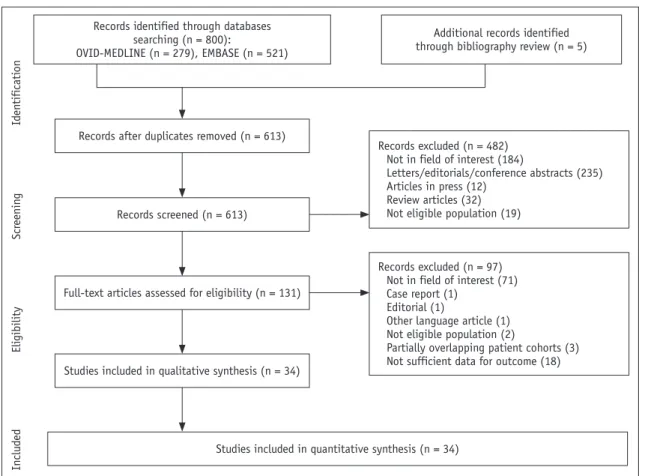
Figure 1 illustrates the flow of literature screening and selection. Finally, 34 articles were included in our systematic review and meta-analysis (8-41). All studies satisfied more than half the tailored questionnaires of QUADAS-2 tool (Supplementary Materials in the online-only Data Supplement).
Characteristics of the Included Studies
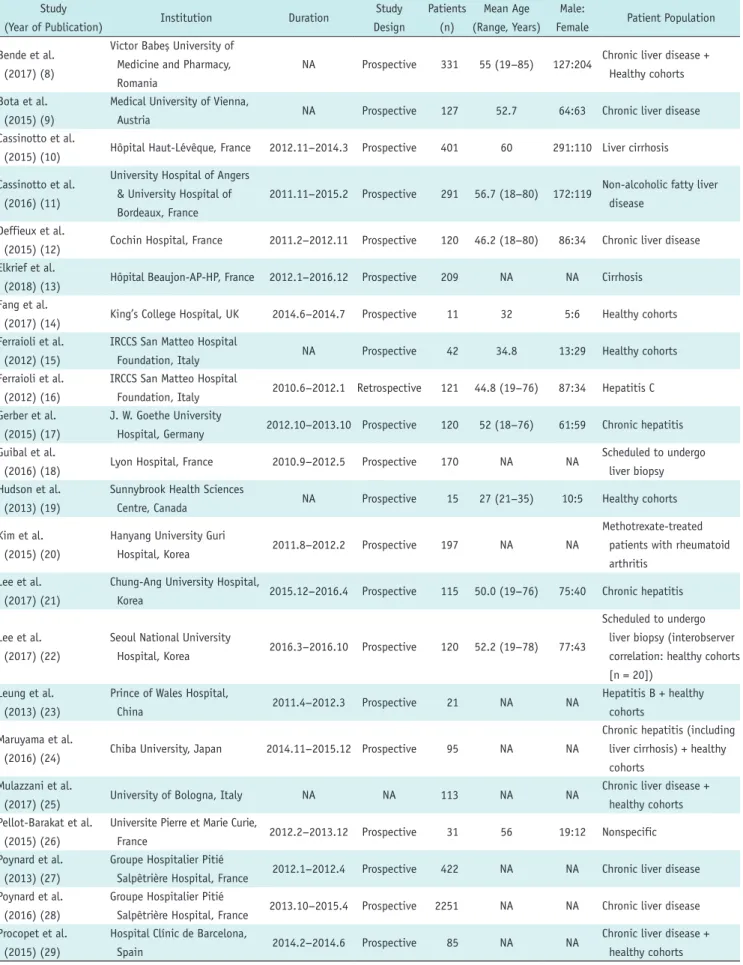
The detailed characteristics of the included studies are summarized in Tables 1 and 2. Twenty-eight of the 34 studies were prospective (8-15, 17-24, 26-29, 31, 33, 34, 36, 37, 39-41) and four were retrospective (16, 30, 32, 38).
The mean ages of subjects in the included studies ranged
from 27 to 60 years old. The study populations ranged from
healthy cohorts to patients with chronic liver disease/liver
cirrhosis from various causes.
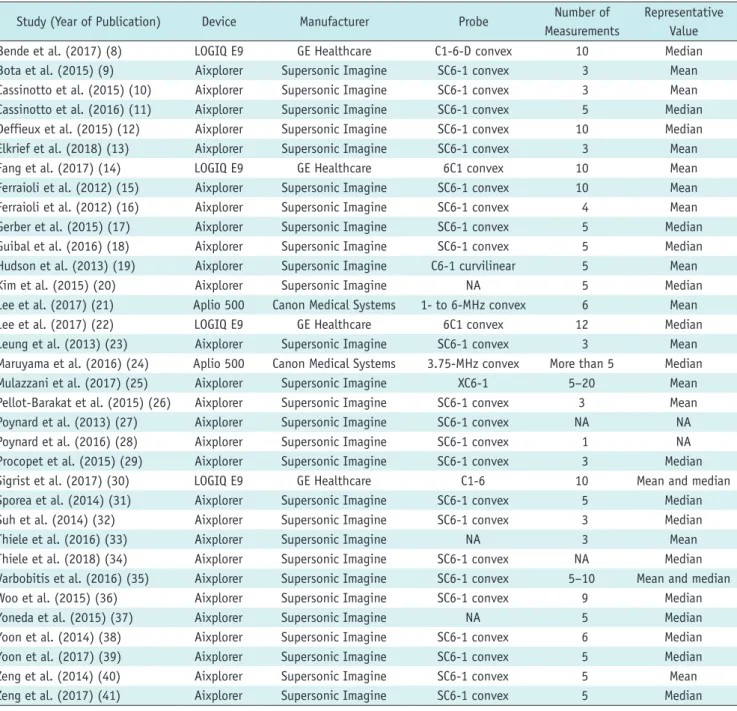
The US device used in 28 studies was Aixplorer (Supersonic Imagine, Strasbourg, France) (9-13, 15-20, 23, 25-29, 31- 41). Either LOGIQ E9 (GE Healthcare, Chicago, IL, USA) (8, 14, 22, 30) or Aplio 500 (Canon Medical Systems, Otawara, Japan) (21, 24) was used in the remaining 6 studies.
Regarding the methods of liver-stiffness measurements, 23 studies performed more than three measurements (8, 10, 12, 14-22, 24, 25, 30, 31, 35-41), whereas 9 studies performed three (9, 11, 13, 23, 26, 29, 32, 33) or less (28) measurements. Thirteen studies used “mean” as a representative value of liver stiffness (9, 10, 13-16, 19, 21, 23, 25, 26, 33, 40), 17 studies used “median” (8, 11, 12, 17, 18, 20, 22, 24, 29, 31, 32, 34, 36-39, 41), and 2 studies used both values (30, 35).
Technical Failure
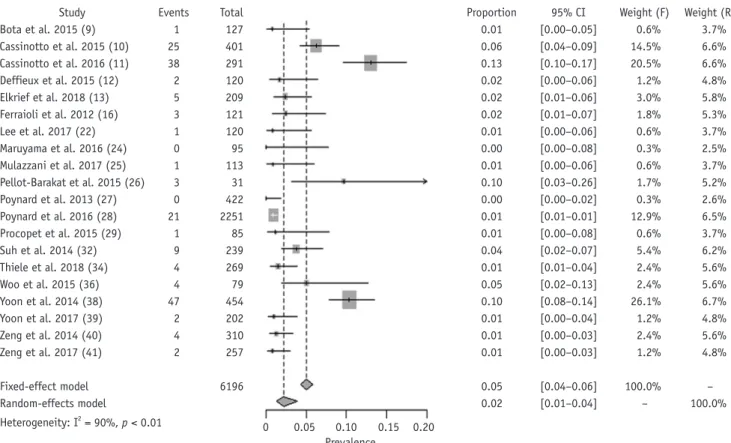
We obtained the proportion of technical failure of 2D-SWE in 20 studies including 6196 patients (9-13, 16, 22, 24- 29, 32, 34, 36, 38-41). Under the random-effects model, the pooled proportion of technical failure was 2.3% (95%
CI, 1.3–3.9%) (Fig. 2). Significant heterogeneity was noted in Cochran’s Q-test (p < 0.01) and Higgins I
2(90%). The
funnel plot (Supplementary Fig. 1A in the online-only Data Supplement) and Egger’s test (p < 0.01) revealed substantial publication bias. After using the trim-and-fill method (Supplementary Fig. 1B in the online-only Data Supplement), the publication-bias-adjusted pooled estimate was 2.8% (95% CI, 1.7–4.7%), suggesting the robustness of the result against any publication bias. No outlier was found in the sensitivity analysis.
The results of subgroup analyses for the proportion of technical failure are summarized in Table 3. No significant difference in technical failure proportion was observed between the studies with three or less measurements and those with more than three measurements. Ten studies originally targeted patients with chronic liver disease (9-13, 16, 27, 28, 40, 41). Additionally, we could extract separate data on patients with chronic liver disease from 4 studies (25, 29, 36, 38). Therefore, we could recalculate the pooled proportion of technical failure in patients with chronic liver disease from 14 studies (2.4%; 95% CI, 1.2–4.8%) (9-13, 16, 25, 27-29, 36, 38, 40, 41). Likewise, we recalculated the pooled proportion in patients with liver cirrhosis from 3 studies (6.8%; 95% CI, 2.5–17.0%) (10, 13, 38).
Records identified through databases searching (n = 800):
OVID-MEDLINE (n = 279), EMBASE (n = 521)
Records after duplicates removed (n = 613)
Records screened (n = 613)
Full-text articles assessed for eligibility (n = 131)
Studies included in qualitative synthesis (n = 34)
Studies included in quantitative synthesis (n = 34)
Additional records identified through bibliography review (n = 5)
Records excluded (n = 482) Not in field of interest (184)
Letters/editorials/conference abstracts (235) Articles in press (12)
Review articles (32) Not eligible population (19)
Records excluded (n = 97) Not in field of interest (71) Case report (1)
Editorial (1)
Other language article (1) Not eligible population (2)
Partially overlapping patient cohorts (3) Not sufficient data for outcome (18)
IdentificationScreeningEligibilityIncluded
Fig. 1. Flow diagram of study selection.
Table 1. Demographic Characteristics of Included Studies Study
(Year of Publication) Institution Duration Study
Design
Patients (n)
Mean Age (Range, Years)
Male:
Female Patient Population Bende et al.
(2017) (8)
Victor Babes¸ University of Medicine and Pharmacy, Romania
NA Prospective 331 55 (19–85) 127:204 Chronic liver disease + Healthy cohorts Bota et al.
(2015) (9)
Medical University of Vienna,
Austria NA Prospective 127 52.7 64:63 Chronic liver disease
Cassinotto et al.
(2015) (10) Hôpital Haut-Lévêque, France 2012.11–2014.3 Prospective 401 60 291:110 Liver cirrhosis Cassinotto et al.
(2016) (11)
University Hospital of Angers & University Hospital of Bordeaux, France
2011.11–2015.2 Prospective 291 56.7 (18–80) 172:119 Non-alcoholic fatty liver disease
Deffieux et al.
(2015) (12) Cochin Hospital, France 2011.2–2012.11 Prospective 120 46.2 (18–80) 86:34 Chronic liver disease Elkrief et al.
(2018) (13) Hôpital Beaujon-AP-HP, France 2012.1–2016.12 Prospective 209 NA NA Cirrhosis Fang et al.
(2017) (14) King’s College Hospital, UK 2014.6–2014.7 Prospective 11 32 5:6 Healthy cohorts Ferraioli et al.
(2012) (15)
IRCCS San Matteo Hospital
Foundation, Italy NA Prospective 42 34.8 13:29 Healthy cohorts
Ferraioli et al.
(2012) (16)
IRCCS San Matteo Hospital
Foundation, Italy 2010.6–2012.1 Retrospective 121 44.8 (19–76) 87:34 Hepatitis C Gerber et al.
(2015) (17)
J. W. Goethe University
Hospital, Germany 2012.10–2013.10 Prospective 120 52 (18–76) 61:59 Chronic hepatitis Guibal et al.
(2016) (18) Lyon Hospital, France 2010.9–2012.5 Prospective 170 NA NA Scheduled to undergo liver biopsy Hudson et al.
(2013) (19)
Sunnybrook Health Sciences
Centre, Canada NA Prospective 15 27 (21–35) 10:5 Healthy cohorts
Kim et al.
(2015) (20)
Hanyang University Guri
Hospital, Korea 2011.8–2012.2 Prospective 197 NA NA
Methotrexate-treated patients with rheumatoid arthritis
Lee et al.
(2017) (21)
Chung-Ang University Hospital,
Korea 2015.12–2016.4 Prospective 115 50.0 (19–76) 75:40 Chronic hepatitis
Lee et al.
(2017) (22)
Seoul National University
Hospital, Korea 2016.3–2016.10 Prospective 120 52.2 (19–78) 77:43
Scheduled to undergo liver biopsy (interobserver correlation: healthy cohorts [n = 20])
Leung et al.
(2013) (23)
Prince of Wales Hospital,
China 2011.4–2012.3 Prospective 21 NA NA Hepatitis B + healthy
cohorts Maruyama et al.
(2016) (24) Chiba University, Japan 2014.11–2015.12 Prospective 95 NA NA
Chronic hepatitis (including liver cirrhosis) + healthy cohorts
Mulazzani et al.
(2017) (25) University of Bologna, Italy NA NA 113 NA NA Chronic liver disease +
healthy cohorts Pellot-Barakat et al.
(2015) (26)
Universite Pierre et Marie Curie,
France 2012.2–2013.12 Prospective 31 56 19:12 Nonspecific
Poynard et al.
(2013) (27)
Groupe Hospitalier Pitié
Salpêtrière Hospital, France 2012.1–2012.4 Prospective 422 NA NA Chronic liver disease Poynard et al.
(2016) (28)
Groupe Hospitalier Pitié
Salpêtrière Hospital, France 2013.10–2015.4 Prospective 2251 NA NA Chronic liver disease Procopet et al.
(2015) (29)
Hospital Clínic de Barcelona,
Spain 2014.2–2014.6 Prospective 85 NA NA Chronic liver disease +
healthy cohorts
Unreliable Measurements
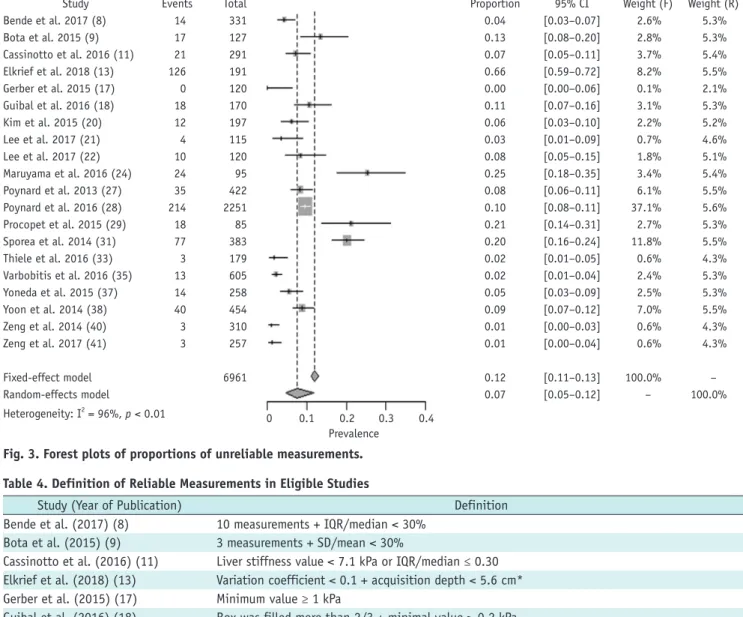
From 20 studies including 6961 patients (8, 9, 11, 13, 17, 18, 20-22, 24, 27-29, 31, 33, 35, 37, 38, 40, 41), the pooled proportion of unreliable measurement was 7.5% (95% CI, 4.7–11.7%) (Fig. 3). The definition of unreliable measurements varied across the studies (Table 4).
Significant heterogeneity was found in Cochran’s Q-test (p
< 0.01) and Higgins I
2(96%). The funnel plot and Egger’s test revealed no significant publication bias (p = 0.19) (Supplementary Fig. 2 in the online-only Data Supplement).
One study was an outlier in the sensitivity analysis (13), but the summary proportion was still robust (6.8%; 95% CI, 5.0–9.3%) after removing it.
The subgroup analyses for the proportion of unreliable measurements are summarized in Table 5. Notably, studies conducting more than three measurements had fewer unreliable measurements than did those conducting three or less measurements. From 12 studies (9, 11, 13, 17, 21, 27-29, 35, 38, 40, 41), including 2 (29, 38) enabling the
extraction of separate data on patients with chronic liver disease, the pooled proportion in patients with chronic liver disease was 6.3% (95% CI, 3.0–12.9%).
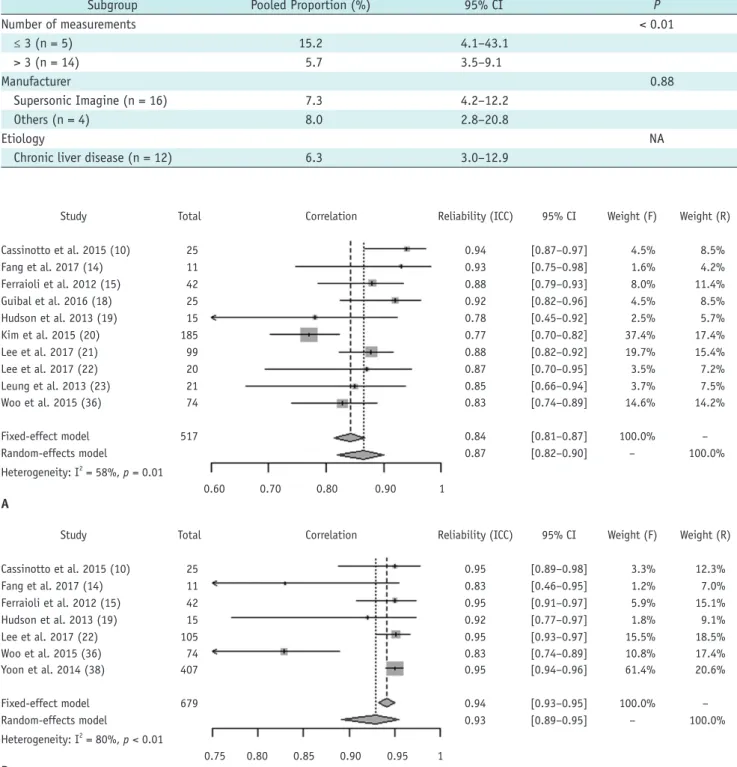
Interobserver and Intraobserver Reliability
The interobserver reliability of 2D-SWE was obtained from 12 studies (10, 12, 14, 15, 18-23, 36, 39). The study of Yoon et al. (39) was excluded because it potentially shared the population with another (20). Moreover, unlike other studies reporting the result using an ICC parameter, the study of Deffieux et al. (12) used Pearson’s correlation coefficient (r = 0.87). Finally, we conducted a meta-analysis of 10 studies including 517 patients (10, 14, 15, 18- 23, 36), and the pooled interobserver reliability was 0.87 (95% CI, 0.82–0.90), suggesting good reliability (Fig. 4A).
Significant heterogeneity was noted in Cochran’s Q-test (p = 0.01) and Higgins I
2(58%). The funnel plot (Supplementary Fig. 3A in the online-only Data Supplement) and Egger’s test (p = 0.08) revealed substantial publication bias, but
Table 1. Demographic Characteristics of Included Studies (Continued)Study
(Year of Publication) Institution Duration Study
Design
Patients (n)
Mean Age (Range, Years)
Male:
Female Patient Population Sigrist et al.
(2017) (30) Stanford University, USA 2015.11–2016.3 Retrospective 93 54 (22–86) 51:42 For liver fibrosis screening Sporea et al.
(2014) (31)
Victor Babes¸ University of Medicine and Pharmacy, Romania
NA Prospective 383 54 (18–82) 176:207
Chronic liver disease (including liver cirrhosis) + healthy volunteers Suh et al.
(2014) (32) Asan Medical Center, Korea 2011.9–2012.2 Retrospective 239 NA NA Nonspecific Thiele et al.
(2016) (33)
Odense University Hospital,
Denmark 2013.5–2015.4 Prospective 199 55 145:54 Heavy alcoholics
Thiele et al.
(2018) (34)
Odense University Hospital,
Denmark 2013.5–2016.8 Prospective 269 NA NA Heavy alcoholics
Varbobitis et al.
(2016) (35)
Laiko General Hospital of
Athens, Greece For 15 months NA 605 52 (20–88) 369:236 Chronic liver disease Woo et al.
(2015) (36)
SMG-SNU Boramae Medical
Center, Korea 2012.4–2013.4 Prospective 79 56.5 (28–82) 49:30 Chronic liver disease + healthy cohorts Yoneda et al.
(2015) (37) University of Miami, USA 2013.10–2014.12 Prospective 258 57 (56–59) 137:121 Obese patients (BMI > 25) with chronic liver disease Yoon et al.
(2014) (38)
Seoul National University
Hospital, Korea 2011.8–2013.1 Retrospective 454 54 (18–86) 229:225 Nonspecific Yoon et al.
(2017) (39)
Hanyang University Guri
Hospital, Korea 2011.8–2012.8 Prospective 176 54.6 (31–78) 40:136
Methotrexate-treated patients with rheumatoid arthritis
Zeng et al.
(2014) (40)
Third Affiliated Hospital of Sun
Yat-Sen University, China 2011.5–2012.11 Prospective 310 54.5 (18–66) 251:59 Hepatitis B Zeng et al.
(2017) (41)
Third Affiliated Hospital of Sun
Yat-Sen University, China 2013.8–2015.4 Prospective 257 36.7 (18–65) 199:58 Hepatitis B BMI = body mass index, NA = not available
a publication-bias-adjusted pooled estimate suggested good reliability (ICC = 0.77; 95% CI, 0.74–0.79) under the trim-and-fill method (Supplementary Fig. 3B in the online- only Data Supplement). One outlier was present in the sensitivity analysis (20), and the pooled ICC was 0.88 (95%
CI, 0.84–0.90) after removing it, thus suggesting the result was robustness.
We obtained the intraobserver reliability of 2D-SWE from 7 studies including 679 patients (10, 14, 15, 19, 22, 36, 38). The pooled intraobserver reliability was 0.93 (95%
CI, 0.89–0.95) using a random-effects model, suggesting
excellent reliability (Fig. 4B). Significant heterogeneity was noted (Cochran’s Q-test: p < 0.01; Higgins I
2= 80%). The pooled reliability was still robust (0.95; 95% CI, 0.94–0.96) after removing one outlier (36). We could not calculate the publication bias for intraobserver reliability because of the small sample size (< 10 studies).
Influential Factors
Factors influencing technical performance were reported in 16 studies (8, 10, 11, 16, 18, 20, 22, 24, 25, 27, 29, 33, 35, 37, 38, 40) (Table 6). Overall, technical failure and/
Table 2. Technical Characteristics of Included Studies
Study (Year of Publication) Device Manufacturer Probe Number of
Measurements
Representative Value
Bende et al. (2017) (8) LOGIQ E9 GE Healthcare C1-6-D convex 10 Median
Bota et al. (2015) (9) Aixplorer Supersonic Imagine SC6-1 convex 3 Mean
Cassinotto et al. (2015) (10) Aixplorer Supersonic Imagine SC6-1 convex 3 Mean
Cassinotto et al. (2016) (11) Aixplorer Supersonic Imagine SC6-1 convex 5 Median
Deffieux et al. (2015) (12) Aixplorer Supersonic Imagine SC6-1 convex 10 Median
Elkrief et al. (2018) (13) Aixplorer Supersonic Imagine SC6-1 convex 3 Mean
Fang et al. (2017) (14) LOGIQ E9 GE Healthcare 6C1 convex 10 Mean
Ferraioli et al. (2012) (15) Aixplorer Supersonic Imagine SC6-1 convex 10 Mean
Ferraioli et al. (2012) (16) Aixplorer Supersonic Imagine SC6-1 convex 4 Mean
Gerber et al. (2015) (17) Aixplorer Supersonic Imagine SC6-1 convex 5 Median
Guibal et al. (2016) (18) Aixplorer Supersonic Imagine SC6-1 convex 5 Median
Hudson et al. (2013) (19) Aixplorer Supersonic Imagine C6-1 curvilinear 5 Mean
Kim et al. (2015) (20) Aixplorer Supersonic Imagine NA 5 Median
Lee et al. (2017) (21) Aplio 500 Canon Medical Systems 1- to 6-MHz convex 6 Mean
Lee et al. (2017) (22) LOGIQ E9 GE Healthcare 6C1 convex 12 Median
Leung et al. (2013) (23) Aixplorer Supersonic Imagine SC6-1 convex 3 Mean
Maruyama et al. (2016) (24) Aplio 500 Canon Medical Systems 3.75-MHz convex More than 5 Median
Mulazzani et al. (2017) (25) Aixplorer Supersonic Imagine XC6-1 5–20 Mean
Pellot-Barakat et al. (2015) (26) Aixplorer Supersonic Imagine SC6-1 convex 3 Mean
Poynard et al. (2013) (27) Aixplorer Supersonic Imagine SC6-1 convex NA NA
Poynard et al. (2016) (28) Aixplorer Supersonic Imagine SC6-1 convex 1 NA
Procopet et al. (2015) (29) Aixplorer Supersonic Imagine SC6-1 convex 3 Median
Sigrist et al. (2017) (30) LOGIQ E9 GE Healthcare C1-6 10 Mean and median
Sporea et al. (2014) (31) Aixplorer Supersonic Imagine SC6-1 convex 5 Median
Suh et al. (2014) (32) Aixplorer Supersonic Imagine SC6-1 convex 3 Median
Thiele et al. (2016) (33) Aixplorer Supersonic Imagine NA 3 Mean
Thiele et al. (2018) (34) Aixplorer Supersonic Imagine SC6-1 convex NA Median
Varbobitis et al. (2016) (35) Aixplorer Supersonic Imagine SC6-1 convex 5–10 Mean and median
Woo et al. (2015) (36) Aixplorer Supersonic Imagine SC6-1 convex 9 Median
Yoneda et al. (2015) (37) Aixplorer Supersonic Imagine NA 5 Median
Yoon et al. (2014) (38) Aixplorer Supersonic Imagine SC6-1 convex 6 Median
Yoon et al. (2017) (39) Aixplorer Supersonic Imagine SC6-1 convex 5 Median
Zeng et al. (2014) (40) Aixplorer Supersonic Imagine SC6-1 convex 5 Mean
Zeng et al. (2017) (41) Aixplorer Supersonic Imagine SC6-1 convex 5 Median
or unreliable measurement was affected by patient factors, including high body mass index/wide waist circumference/
thick intercostal wall suggestive of overweight or obesity, old age, inability to optimally hold breath, severe liver disease and associated complications (e.g., ascites), narrow intercostal space, and long distance between the transducer and liver capsule. Additionally, one study reported that operator experience significantly influenced the measurement reliability of 2D-SWE (28).
DISCUSSION
Our meta-analysis revealed that the pooled proportions of technical failures and unreliable measurements of 2D-SWE were 2.3% and 7.5%, respectively. Moreover, the 2D-SWE measurements showed good to excellent interobserver (ICC
= 0.87) and intraobserver (ICC = 0.93) reliability, suggesting the applicability of 2D-SWE for evaluating liver stiffness.
Our result also revealed that the technical performance of 2D-SWE is comparable to TE, the most extensively used US elastography, reported to have failure rate of 3.1%
Study Events Total Proportion 95% CI Weight (F) Weight (R)
Bota et al. 2015 (9) 1 127 0.01 [0.00–0.05] 0.6% 3.7%
Cassinotto et al. 2015 (10) 25 401 0.06 [0.04–0.09] 14.5% 6.6%
Cassinotto et al. 2016 (11) 38 291 0.13 [0.10–0.17] 20.5% 6.6%
Deffieux et al. 2015 (12) 2 120 0.02 [0.00–0.06] 1.2% 4.8%
Elkrief et al. 2018 (13) 5 209 0.02 [0.01–0.06] 3.0% 5.8%
Ferraioli et al. 2012 (16) 3 121 0.02 [0.01–0.07] 1.8% 5.3%
Lee et al. 2017 (22) 1 120 0.01 [0.00–0.06] 0.6% 3.7%
Maruyama et al. 2016 (24) 0 95 0.00 [0.00–0.08] 0.3% 2.5%
Mulazzani et al. 2017 (25) 1 113 0.01 [0.00–0.06] 0.6% 3.7%
Pellot-Barakat et al. 2015 (26) 3 31 0.10 [0.03–0.26] 1.7% 5.2%
Poynard et al. 2013 (27) 0 422 0.00 [0.00–0.02] 0.3% 2.6%
Poynard et al. 2016 (28) 21 2251 0.01 [0.01–0.01] 12.9% 6.5%
Procopet et al. 2015 (29) 1 85 0.01 [0.00–0.08] 0.6% 3.7%
Suh et al. 2014 (32) 9 239 0.04 [0.02–0.07] 5.4% 6.2%
Thiele et al. 2018 (34) 4 269 0.01 [0.01–0.04] 2.4% 5.6%
Woo et al. 2015 (36) 4 79 0.05 [0.02–0.13] 2.4% 5.6%
Yoon et al. 2014 (38) 47 454 0.10 [0.08–0.14] 26.1% 6.7%
Yoon et al. 2017 (39) 2 202 0.01 [0.00–0.04] 1.2% 4.8%
Zeng et al. 2014 (40) 4 310 0.01 [0.00–0.03] 2.4% 5.6%
Zeng et al. 2017 (41) 2 257 0.01 [0.00–0.03] 1.2% 4.8%
Fixed-effect model 6196 0.05 [0.04–0.06] 100.0% –
Random-effects model 0.02 [0.01–0.04] – 100.0%
Heterogeneity: I2 = 90%, p < 0.01 0 0.05 0.10 0.15 0.20 Prevalence
Fig. 2. Forest plots of proportions of technical failure. CI = confidence interval, F = fixed, R = random.
Table 3. Subgroup Analyses for Technical Failure
Subgroup Pooled Proportion (%) 95% CI (%) P
Number of measurements 0.89
≤ 3 (n = 7) 2.7 1.2–6.0
> 3 (n = 11) 2.5 1.2–4.9
Manufacturer 0.15
Supersonic Imagine (n = 18) 2.4 1.4–4.3
Others (n = 2) 0.7 0.1–3.5
Etiology NA
Chronic liver disease (n = 14) 2.4 1.2–4.8
Liver cirrhosis (n = 3) 6.8 2.5–17.0
CI = confidence interval
and unreliable measurement rate of 15.8% from a study of 13379 examinations (53).
Currently, all 2D-SWE systems enable quality assessment
of shear-wave measurements and adjust the display when the quality decreases by dropping the offending pixels and excluding them when calculating Young’s modulus (54).
Study Events Total Proportion 95% CI Weight (F) Weight (R)
Bende et al. 2017 (8) 14 331 0.04 [0.03–0.07] 2.6% 5.3%
Bota et al. 2015 (9) 17 127 0.13 [0.08–0.20] 2.8% 5.3%
Cassinotto et al. 2016 (11) 21 291 0.07 [0.05–0.11] 3.7% 5.4%
Elkrief et al. 2018 (13) 126 191 0.66 [0.59–0.72] 8.2% 5.5%
Gerber et al. 2015 (17) 0 120 0.00 [0.00–0.06] 0.1% 2.1%
Guibal et al. 2016 (18) 18 170 0.11 [0.07–0.16] 3.1% 5.3%
Kim et al. 2015 (20) 12 197 0.06 [0.03–0.10] 2.2% 5.2%
Lee et al. 2017 (21) 4 115 0.03 [0.01–0.09] 0.7% 4.6%
Lee et al. 2017 (22) 10 120 0.08 [0.05–0.15] 1.8% 5.1%
Maruyama et al. 2016 (24) 24 95 0.25 [0.18–0.35] 3.4% 5.4%
Poynard et al. 2013 (27) 35 422 0.08 [0.06–0.11] 6.1% 5.5%
Poynard et al. 2016 (28) 214 2251 0.10 [0.08–0.11] 37.1% 5.6%
Procopet et al. 2015 (29) 18 85 0.21 [0.14–0.31] 2.7% 5.3%
Sporea et al. 2014 (31) 77 383 0.20 [0.16–0.24] 11.8% 5.5%
Thiele et al. 2016 (33) 3 179 0.02 [0.01–0.05] 0.6% 4.3%
Varbobitis et al. 2016 (35) 13 605 0.02 [0.01–0.04] 2.4% 5.3%
Yoneda et al. 2015 (37) 14 258 0.05 [0.03–0.09] 2.5% 5.3%
Yoon et al. 2014 (38) 40 454 0.09 [0.07–0.12] 7.0% 5.5%
Zeng et al. 2014 (40) 3 310 0.01 [0.00–0.03] 0.6% 4.3%
Zeng et al. 2017 (41) 3 257 0.01 [0.00–0.04] 0.6% 4.3%
Fixed-effect model 6961 0.12 [0.11–0.13] 100.0% –
Random-effects model 0.07 [0.05–0.12] – 100.0%
Heterogeneity: I2 = 96%, p < 0.01
Prevalence Fig. 3. Forest plots of proportions of unreliable measurements.
0 0.1 0.2 0.3 0.4
Table 4. Definition of Reliable Measurements in Eligible Studies
Study (Year of Publication) Definition
Bende et al. (2017) (8) 10 measurements + IQR/median < 30%
Bota et al. (2015) (9) 3 measurements + SD/mean < 30%
Cassinotto et al. (2016) (11) Liver stiffness value < 7.1 kPa or IQR/median ≤ 0.30 Elkrief et al. (2018) (13) Variation coefficient < 0.1 + acquisition depth < 5.6 cm*
Gerber et al. (2015) (17) Minimum value ≥ 1 kPa
Guibal et al. (2016) (18) Box was filled more than 2/3 + minimal value > 0.2 kPa Kim et al. (2015) (20) 5 valid measurements
Lee et al. (2017) (21) IQR/median ≤ 30%
Lee et al. (2017) (22) IQR/median ≤ 30%
Maruyama et al. (2016) (24) SD/median ≤ 49%
Poynard et al. (2013) (27) Minimum value ≥ 0.2 kPa Poynard et al. (2016) (28) Minimum value ≥ 0.2 kPa
Procopet et al. (2015) (29) SD/median ≤ 0.1 or depth of measurement < 5.6 cm Sporea et al. (2014) (31) 5 valid measurements
Thiele et al. (2016) (33) Stability of viscoelasticity map ≥ 3 s + a homogeneous color in ROI ≥ 15 mm + SD/mean ≤ 30%
Varbobitis et al. (2016) (35) 5 valid measurements + SD/mean < 25%
Yoneda et al. (2015) (37) 5 valid measurements + success rate ≥ 60% + IQR/median < 30%
Yoon et al. (2014) (38) IQR/median ≤ 30%
Zeng et al. (2014) (40) 5 valid measurements + IQR/median < 30% + success rate ≥ 60%
Zeng et al. (2017) (41) IQR/median < 30% + success rate ≥ 60%
*Represents definition of highly reliable measurement. IQR = interquartile range, ROI = region of interest, SD = standard deviation
Additionally, Aplio 500 shows a display of shear waves travelling, suggesting acceptable quality if consecutive lines are parallel. Other manufacturers also provide an additional vendor-specific approach to quality judgement, including confidence maps in Philips systems and the stability index in the new software version of Aixplorer (7).
However, according to the 2017 European Federation of Societies for Ultrasound in Medicine and Biology (EFSUMB) guidelines, no agreement exists on the quality criteria for 2D-SWE and unreliable measurements are randomly defined across studies (7). Naturally, the proportion of unreliable measurements were closely influenced by the
Table 5. Subgroup Analyses for Unreliable MeasurementsSubgroup Pooled Proportion (%) 95% CI P
Number of measurements < 0.01
≤ 3 (n = 5) 15.2 4.1–43.1
> 3 (n = 14) 5.7 3.5–9.1
Manufacturer 0.88
Supersonic Imagine (n = 16) 7.3 4.2–12.2
Others (n = 4) 8.0 2.8–20.8
Etiology NA
Chronic liver disease (n = 12) 6.3 3.0–12.9
Fig. 4. Forest plot of interobserver reliability (A) and intraobserver reliability (B). ICC = intraclass correlation coefficient
Study Total Correlation Reliability (ICC) 95% CI Weight (F) Weight (R)
Cassinotto et al. 2015 (10) 25 0.95 [0.89–0.98] 3.3% 12.3%
Fang et al. 2017 (14) 11 0.83 [0.46–0.95] 1.2% 7.0%
Ferraioli et al. 2012 (15) 42 0.95 [0.91–0.97] 5.9% 15.1%
Hudson et al. 2013 (19) 15 0.92 [0.77–0.97] 1.8% 9.1%
Lee et al. 2017 (22) 105 0.95 [0.93–0.97] 15.5% 18.5%
Woo et al. 2015 (36) 74 0.83 [0.74–0.89] 10.8% 17.4%
Yoon et al. 2014 (38) 407 0.95 [0.94–0.96] 61.4% 20.6%
Fixed-effect model 679 0.94 [0.93–0.95] 100.0% –
Random-effects model 0.93 [0.89–0.95] – 100.0%
Heterogeneity: I2 = 80%, p < 0.01
0.75 0.80 0.85 0.90 0.95 1 B
Study Total Correlation Reliability (ICC) 95% CI Weight (F) Weight (R)
Cassinotto et al. 2015 (10) 25 0.94 [0.87–0.97] 4.5% 8.5%
Fang et al. 2017 (14) 11 0.93 [0.75–0.98] 1.6% 4.2%
Ferraioli et al. 2012 (15) 42 0.88 [0.79–0.93] 8.0% 11.4%
Guibal et al. 2016 (18) 25 0.92 [0.82–0.96] 4.5% 8.5%
Hudson et al. 2013 (19) 15 0.78 [0.45–0.92] 2.5% 5.7%
Kim et al. 2015 (20) 185 0.77 [0.70–0.82] 37.4% 17.4%
Lee et al. 2017 (21) 99 0.88 [0.82–0.92] 19.7% 15.4%
Lee et al. 2017 (22) 20 0.87 [0.70–0.95] 3.5% 7.2%
Leung et al. 2013 (23) 21 0.85 [0.66–0.94] 3.7% 7.5%
Woo et al. 2015 (36) 74 0.83 [0.74–0.89] 14.6% 14.2%
Fixed-effect model 517 0.84 [0.81–0.87] 100.0% –
Random-effects model 0.87 [0.82–0.90] – 100.0%
Heterogeneity: I2 = 58%, p = 0.01
0.60 0.70 0.80 0.90 1 A
definition, as shown by Elkrief et al. (13) whose proportion was substantial under the strict definition. Some authors (17, 18, 27, 28) used minimal Young’s modulus to identify invalid measurements. The Society of Radiologists in Ultrasound consensus (55) and other studies (8, 11, 21, 22, 37, 38, 40, 41) recommend interquartile ranges/median values below 30% as valid measurements mimicking the TE reliability criteria. To reduce such variability and enable standardization, a collaborative effort by academia and manufacturers is required (56).
Given the significant heterogeneity in technical failure and unreliable measurements among the studies in this meta-analysis, subgroup analyses were conducted to explore potential factors influencing successful and qualified measurements. Notably, the number of measurements significantly affected the unreliable measurements;
thus, multiple measurements in the same location are recommended for obtaining reliable liver-stiffness measurements (55). Because no consensus exists on the optimal measurement numbers, the included studies performed various numbers of measurements ranging from 3 to 15 (29, 40, 57, 58). Recently, the 2017 EFSUMB guidelines recommended that three measurements suffice to obtain consistent results for assessing liver fibrosis and portal hypertension (7). However, our subgroup analyses revealed that studies conducting more than three measurements showed fewer unreliable measurements than did those conducting three measurements or less.
Nevertheless, no difference was found in technical failure between the two groups. Thus, we suggest that the optimal minimum number of 2D-SWE measurements should be further verified. We believe the composition of the population also affects technical success and reliable measurements as liver disease leads to improper procedures caused by changes in liver volumes, secondary interference by an interposed colon, or other complications (38). Three studies targeting patients with cirrhosis had a higher proportion of technical failure, even though studies and study subsets targeting patients with chronic liver disease showed no difference in technical failure and unreliable measurements with the overall population.
2D-SWE helps select a ROI in a representative area of the liver, and it could be saved and followed over time. This could reduce sampling variability in repeated measurements (59).
Indeed, good to excellent interobserver and intraobserver reliability in our meta-analysis supports this advantage of 2D-SWE. Conversely, 2D-SWE requires technical expertise because the operators need to consistently place the points of measurements in the liver. One study reported that intraobserver agreement between measurements on different days drops from 0.84 for experienced examiners to 0.65 for beginners (15). Therefore, measurements should be performed by experienced operators, and beginners are recommended at least 50 supervised measurements (7, 15, 60).
Our study has several limitations. Despite the significant heterogeneity in the meta-analysis, we could not conduct
Table 6. Factors Influencing Technical Failures and/or Unreliable MeasurementsStudy (Year of publication) Factors
Bende et al. (2017) (8) High BMI*
Cassinotto et al. (2015) (10) High BMI, thick intercostal wall, lower albumin, female*
Cassinotto et al. (2016) (11) Wide waist circumference, high BMI, thick intercostal wall, diabetes*
Ferraioli et al. (2012) (16) Narrow intercostal space (n = 2), obesity (n = 1)
Guibal et al. (2016) (18) Poor acoustic window (n = 14, including patients with BMI ≥ 30 kg/m2), inadequate breath holding (n = 4) Kim et al. (2015) (20) Obesity or severe fatty liver (n = 10), inadequate breath holding (n = 2)
Lee et al. (2017) (22) Old age, presence of ascites, distance between transducer and Glisson capsule*
Maruyama et al. (2016) (24) High BMI*, ascites (n = 1)
Mulazzani et al. (2017) (25) Liver cirrhosis with portal hypertension and high BMI (n = 1) Poynard et al. (2013) (27) Operator experience, severity of fibrosis estimated using Fibrotest*
Procopet et al. (2015) (29) Liver cirrhosis with high BMI and inadequate breath holding (n = 1) Thiele et al. (2016) (33) Overweight (n = 6), capsule distance > 3 cm (n = 1)
Varbobitis et al. (2016) (35) Old age, obesity or overweight, use of statins for hyperlipidemia*
Yoneda et al. (2015) (37) High BMI
Yoon et al. (2014) (38) High BMI, distance between transducer and liver*
Zeng et al. (2014) (40) Narrow intercostal space, thick thoracic wall (> 2 cm)
*Significantly different between patients with technical failure or unreliable measurements and those with successful measurements.
further subgroup analyses for potential factors influencing the results and heterogeneity, especially the impact of overweight or obesity on technical performance. Second, many of the included studies used the Aixplorer system because the other manufacturers only recently released their 2D-SWE devices. However, we included all available studies and our results may be generally applied to all 2D-SWE devices. Third, significant publication bias was observed in the meta-analysis for technical failure and interobserver reliability. After using the trim-and-fill method, however, the outcomes were still robust.
In conclusion, 2D-SWE has good technical performance for assessing liver stiffness, being characterized by high technical success and reliability. Nevertheless, future studies should establish the quality criteria and optimal number of measurements.
Supplementary Materials
The online-only Data Supplement is available with this article at https://doi.org/10.3348/kjr.2018.0812.
Conflicts of Interest
The authors have no potential conflicts of interest to disclose.
ORCID iDs Kyung Won Kim
https://orcid.org/0000-0002-1532-5970 Dong Wook Kim
https://orcid.org/0000-0001-7887-657X Chong Hyun Suh
https://orcid.org/0000-0002-4737-0530 Junhee Pyo
https://orcid.org/0000-0002-2807-1340 Chan Park
https://orcid.org/0000-0002-9838-8757 Seung Chai Jung
https://orcid.org/0000-0001-5559-7973
REFERENCES
1. Kennedy P, Wagner M, Castéra L, Hong CW, Johnson CL, Sirlin CB, et al. Quantitative elastography methods in liver disease: current evidence and future directions. Radiology 2018;286:738-763.
2. Herrmann E, de Lédinghen V, Cassinotto C, Chu WC, Leung VY,
Ferraioli G, et al. Assessment of biopsy-proven liver fibrosis by two-dimensional shear wave elastography: an individual patient data-based meta-analysis. Hepatology 2018;67:260-272 3. Lups¸or-Platon M, Badea R, Gersak M, Maniu A, Rusu I, Suciu A,
et al. Noninvasive assessment of liver diseases using 2D shear wave elastography. J Gastrointestin Liver Dis 2016;25:525-532 4. Amur S, LaVange L, Zineh I, Buckman-Garner S, Woodcock
J. Biomarker qualification: toward a multiple stakeholder framework for biomarker development, regulatory acceptance, and utilization. Clin Pharmacol Ther 2015;98:34-46
5. Li C, Zhang C, Li J, Huo H, Song D. Diagnostic accuracy of real-time shear wave elastography for staging of liver fibrosis:
a meta-analysis. Med Sci Monit 2016;22:1349-1359 6. Shan QY, Liu BX, Tian WS, Wang W, Zhou LY, Wang Y, et al.
Elastography of shear wave speed imaging for the evaluation of liver fibrosis: a meta-analysis. Hepatol Res 2016;46:1203- 1213
7. Dietrich CF, Bamber J, Berzigotti A, Bota S, Cantisani V, Castera L, et al. EFSUMB guidelines and recommendations on the clinical use of liver ultrasound elastography, update 2017 (long version). Ultraschall Med 2017;38:e16-e47
8. Bende F, Sporea I, Sirli R, Popescu A, Mare R, Miutescu B, et al. Performance of 2D-SWE.GE for predicting different stages of liver fibrosis, using transient elastography as the reference method. Med Ultrason 2017;19:143-149
9. Bota S, Paternostro R, Etschmaier A, Schwarzer R, Salzl P, Mandorfer M, et al. Performance of 2-D shear wave elastography in liver fibrosis assessment compared with serologic tests and transient elastography in clinical routine.
Ultrasound Med Biol 2015;41:2340-2349
10. Cassinotto C, Charrie A, Mouries A, Lapuyade B, Hiriart JB, Vergniol J, et al. Liver and spleen elastography using supersonic shear imaging for the non-invasive diagnosis of cirrhosis severity and oesophageal varices. Dig Liver Dis 2015;47:695-701
11. Cassinotto C, Boursier J, de Lédinghen V, Lebigot J, Lapuyade B, Cales P, et al. Liver stiffness in nonalcoholic fatty liver disease: a comparison of supersonic shear imaging, FibroScan, and ARFI with liver biopsy. Hepatology 2016;63:1817-1827 12. Deffieux T, Gennisson JL, Bousquet L, Corouge M, Cosconea
S, Amroun D, et al. Investigating liver stiffness and viscosity for fibrosis, steatosis and activity staging using shear wave elastography. J Hepatol 2015;62:317-324
13. Elkrief L, Ronot M, Andrade F, Dioguardi Burgio M, Issoufaly T, Zappa M, et al. Non-invasive evaluation of portal hypertension using shear-wave elastography: analysis of two algorithms combining liver and spleen stiffness in 191 patients with cirrhosis. Aliment Pharmacol Ther 2018;47:621-630 14. Fang C, Konstantatou E, Romanos O, Yusuf GT, Quinlan
DJ, Sidhu PS. Reproducibility of 2-dimensional shear wave elastography assessment of the liver: a direct comparison with point shear wave elastography in healthy volunteers. J Ultrasound Med 2017;36:1563-1569
15. Ferraioli G, Tinelli C, Zicchetti M, Above E, Poma G, Di
Gregorio M, et al. Reproducibility of real-time shear wave elastography in the evaluation of liver elasticity. Eur J Radiol 2012;81:3102-3106
16. Ferraioli G, Tinelli C, Dal Bello B, Zicchetti M, Filice G, Filice C.
Accuracy of real-time shear wave elastography for assessing liver fibrosis in chronic hepatitis C: a pilot study. Hepatology 2012;56:2125-2133
17. Gerber L, Kasper D, Fitting D, Knop V, Vermehren A, Sprinzl K, et al. Assessment of liver fibrosis with 2-D shear wave elastography in comparison to transient elastography and acoustic radiation force impulse imaging in patients with chronic liver disease. Ultrasound Med Biol 2015;41:2350-2359 18. Guibal A, Renosi G, Rode A, Scoazec JY, Guillaud O, Chardon
L, et al. Shear wave elastography: an accurate technique to stage liver fibrosis in chronic liver diseases. Diagn Interv Imaging 2016;97:91-99
19. Hudson JM, Milot L, Parry C, Williams R, Burns PN. Inter- and intra-operator reliability and repeatability of shear wave elastography in the liver: a study in healthy volunteers.
Ultrasound Med Biol 2013;39:950-955
20. Kim TY, Kim JY, Sohn JH, Lee HS, Bang SY, Kim Y, et al.
Assessment of substantial liver fibrosis by real-time shear wave elastography in methotrexate-treated patients with rheumatoid arthritis. J Ultrasound Med 2015;34:1621-1630 21. Lee ES, Lee JB, Park HR, Yoo J, Choi JI, Lee HW, et al. Shear
wave liver elastography with a propagation map: diagnostic performance and inter-observer correlation for hepatic fibrosis in chronic hepatitis. Ultrasound Med Biol 2017;43:1355-1363 22. Lee SM, Lee JM, Kang HJ, Yang HK, Yoon JH, Chang W, et al.
Liver fibrosis staging with a new 2D-shear wave elastography using comb-push technique: applicability, reproducibility, and diagnostic performance. PLoS ONE 2017;12:e0177264
23. Leung VY, Shen J, Wong VW, Abrigo J, Wong GL, Chim AM, et al. Quantitative elastography of liver fibrosis and spleen stiffness in chronic hepatitis B carriers: comparison of shear- wave elastography and transient elastography with liver biopsy correlation. Radiology 2013;269:910-918
24. Maruyama H, Kobayashi K, Kiyono S, Sekimoto T, Kanda T, Yokosuka O. Two-dimensional shear wave elastography with propagation-based reliability assessment for grading hepatic fibrosis and portal hypertension. J Hepatobiliary Pancreat Sci 2016;23:595-602
25. Mulazzani L, Salvatore V, Ravaioli F, Allegretti G, Matassoni F, Granata R, et al. Point shear wave ultrasound elastography with Esaote compared to real-time 2D shear wave
elastography with supersonic imagine for the quantification of liver stiffness. J Ultrasound 2017;20:213-225
26. Pellot-Barakat C, Lefort M, Chami L, Labit M, Frouin F, Lucidarme O. Automatic assessment of shear wave elastography quality and measurement reliability in the liver.
Ultrasound Med Biol 2015;41:936-943
27. Poynard T, Munteanu M, Luckina E, Perazzo H, Ngo Y, Royer L, et al. Liver fibrosis evaluation using real-time shear wave elastography: applicability and diagnostic performance using
methods without a gold standard. J Hepatol 2013;58:928-935 28. Poynard T, Pham T, Perazzo H, Munteanu M, Luckina E, Elaribi D, et al. Real-time shear wave versus transient elastography for predicting fibrosis: applicability, and impact of
inflammation and steatosis. A non-invasive comparison. PLoS ONE 2016;11:e0163276
29. Procopet B, Berzigotti A, Abraldes JG, Turon F, Hernandez-Gea V, García-Pagán JC, et al. Real-time shear-wave elastography:
applicability, reliability and accuracy for clinically significant portal hypertension. J Hepatol 2015;62:1068-1075
30. Sigrist RMS, El Kaffas A, Jeffrey RB, Rosenberg J, Willmann JK. Intra-individual comparison between 2-D shear wave elastography (GE system) and virtual touch tissue quantification (Siemens system) in grading liver fibrosis.
Ultrasound Med Biol 2017;43:2774-2782
31. Sporea I, Bota S, Gradinaru-Tas¸ca˘u O, Sirli R, Popescu A, Jurchis¸ A. Which are the cut-off values of 2D-shear wave elastography (2D-SWE) liver stiffness measurements predicting different stages of liver fibrosis, considering transient elastography (TE) as the reference method? Eur J Radiol 2014;83:e118-e122
32. Suh CH, Kim SY, Kim KW, Lim YS, Lee SJ, Lee MG, et al.
Determination of normal hepatic elasticity by using real-time shear-wave elastography. Radiology 2014;271:895-900 33. Thiele M, Detlefsen S, Sevelsted Møller L, Madsen BS, Fuglsang
Hansen J, Fialla AD, et al. Transient and 2-dimensional shear- wave elastography provide comparable assessment of alcoholic liver fibrosis and cirrhosis. Gastroenterology 2016;150:123- 133
34. Thiele M, Madsen BS, Hansen JF, Detlefsen S, Antonsen S, Krag A. Accuracy of the enhanced liver fibrosis test vs fibroTest, elastography, and indirect markers in detection of advanced fibrosis in patients with alcoholic liver disease.
Gastroenterology 2018;154:1369-1379
35. Varbobitis IC, Siakavellas SI, Koutsounas IS, Karagiannakis DS, Ioannidou P, Papageorgiou MV, et al. Reliability and applicability of two-dimensional shear-wave elastography for the evaluation of liver stiffness. Eur J Gastroenterol Hepatol 2016;28:1204-1209
36. Woo H, Lee JY, Yoon JH, Kim W, Cho B, Choi BI. Comparison of the reliability of acoustic radiation force impulse imaging and supersonic shear imaging in measurement of liver stiffness. Radiology 2015;277:881-886
37. Yoneda M, Thomas E, Sclair SN, Grant TT, Schiff ER.
Supersonic shear imaging and transient elastography with the XL probe accurately detect fibrosis in overweight or obese patients with chronic liver disease. Clin Gastroenterol Hepatol 2015;13:1502-1509.e5
38. Yoon JH, Lee JM, Han JK, Choi BI. Shear wave elastography for liver stiffness measurement in clinical sonographic examinations: evaluation of intraobserver reproducibility, technical failure, and unreliable stiffness measurements. J Ultrasound Med 2014;33:437-447
39. Yoon K, Jeong WK, Kim Y, Kim MY, Kim TY, Sohn JH.
2-dimensional shear wave elastography: interobserver agreement and factors related to interobserver discrepancy.
PLoS ONE 2017;12:e0175747
40. Zeng J, Liu GJ, Huang ZP, Zheng J, Wu T, Zheng RQ, et al. Diagnostic accuracy of two-dimensional shear wave elastography for the non-invasive staging of hepatic fibrosis in chronic hepatitis B: a cohort study with internal validation.
Eur Radiol 2014;24:2572-2581
41. Zeng J, Zheng J, Huang Z, Chen S, Liu J, Wu T, et al.
Comparison of 2-D shear wave elastography and transient elastography for assessing liver fibrosis in chronic hepatitis B.
Ultrasound Med Biol 2017;43:1563-1570
42. Liberati A, Altman DG, Tetzlaff J, Mulrow C, Gotzsche PC, Ioannidis JP, et al. The PRISMA statement for reporting systematic reviews and meta-analyses of studies that evaluate health care interventions: explanation and elaboration. Ann Intern Med 2009;151:W65-W94
43. Whiting PF, Rutjes AW, Westwood ME, Mallett S, Deeks JJ, Reitsma JB, et al. QUADAS-2: a revised tool for the quality assessment of diagnostic accuracy studies. Ann Intern Med 2011;155:529-536
44. Suh CH, Park SH. Successful publication of systematic review and meta-analysis of studies evaluating diagnostic test accuracy. Korean J Radiol 2016;17:5-6
45. Kim KW, Lee J, Choi SH, Huh J, Park SH. Systematic review and meta-analysis of studies evaluating diagnostic test accuracy: a practical review for clinical researchers-part I.
General guidance and tips. Korean J Radiol 2015;16:1175- 1187
46. Lee J, Kim KW, Choi SH, Huh J, Park SH. Systematic review and meta-analysis of studies evaluating diagnostic test accuracy: a practical review for clinical researchers-part II. Statistical methods of meta-analysis. Korean J Radiol 2015;16:1188-1196
47. Higgins JP, Thompson SG, Deeks JJ, Altman DG. Measuring inconsistency in meta-analyses. Bmj 2003;327:557-560 48. Higgins J, Green S. Cochrane handbook for systematic reviews
of interventions. Version 5.1.0. The Cochrane Collaboration Web site. https://handbook-5-1.cochrane.org/. Updated March 2011. Accessed January 8, 2017
49. Egger M, Davey Smith G, Schneider M, Minder C. Bias in meta-analysis detected by a simple, graphical test. BMJ
1997;315:629-634
50. Duval S, Tweedie R. Trim and fill: a simple funnel-plot-based method of testing and adjusting for publication bias in meta- analysis. Biometrics 2000;56:455-463
51. Viechtbauer W. Conducting meta-analyses in R with the metafor package. J Stat Softw 2010;36:1-48
52. Koo TK, Li MY. A guideline of selecting and reporting intraclass correlation coefficients for reliability research. J Chiropr Med 2016;15:155-163
53. Castéra L, Foucher J, Bernard PH, Carvalho F, Allaix D, Merrouche W, et al. Pitfalls of liver stiffness measurement: a 5-year prospective study of 13,369 examinations. Hepatology 2010;51:828-835
54. Wang CZ, Zheng J, Huang ZP, Xiao Y, Song D, Zeng J, et al.
Influence of measurement depth on the stiffness assessment of healthy liver with real-time shear wave elastography.
Ultrasound Med Biol 2014;40:461-469
55. Barr RG, Ferraioli G, Palmeri ML, Goodman ZD, Garcia-Tsao G, Rubin J, et al. Elastography assessment of liver fibrosis:
Society of Radiologists in Ultrasound consensus conference statement. Radiology 2015;276:845-861
56. Buckler AJ, Bresolin L, Dunnick NR, Sullivan DC, Aerts HJ, Bendriem B, et al. Quantitative imaging test approval and biomarker qualification: interrelated but distinct activities.
Radiology 2011;259:875-884
57. Sporea I, Bota S, Jurchis A, Sirli R, Graˇdinaru-Tascaˇu O, Popescu A, et al. Acoustic radiation force impulse and supersonic shear imaging versus transient elastography for liver fibrosis assessment. Ultrasound Med Biol 2013;39:1933- 1941
58. Sporea I, Gra˘dinaru-Tas¸ca˘u O, Bota S, Popescu A, S¸irli R, Jurchis¸ A, et al. How many measurements are needed for liver stiffness assessment by 2D-shear wave elastography (2D-SWE) and which value should be used: the mean or median? Med Ultrason 2013;15:268-272
59. Singh S, Loomba R. Role of two-dimensional shear wave elastography in the assessment of chronic liver diseases.
Hepatology 2018;67:13-15
60. Ferraioli G, Filice C, Castera L, Choi BI, Sporea I, Wilson SR, et al. WFUMB guidelines and recommendations for clinical use of ultrasound elastography: part 3: liver. Ultrasound Med Biol 2015;41:1161-1179