Effects of Concentration of ZnO Nanoparticles on Mechanical, Optical, Thermal, and Antimicrobial Properties of Gelatin/ZnO Nanocomposite Films
9
0
0
전체 글
(2) 42. Shiv Shankar et al.. Korea). Sodium carboxymethyl cellulose (CMC) and zinc acetate dehydrate were procured from Junsei Chemical Co., Ltd (Tokyo, Japan). Sodium hydroxide and glycerol were obtained from Samchun Pure Chemical Co., Ltd. (Pyeongtaek, Yeonggi-do, Korea) and Daejung Chemicals & Metals Co., Ltd. (Siheung, Gyonggido, Korea), respectively. Tryptic soy broth (TSB), brain heart infusion broth (BHI) and agar powder were bought from Duksan Pure Chemicals Co., Ltd (Ansan, Gyeonggi-do, Korea). All the reagents were of analytical grade and used without further purification.. Preparation of ZnO nanoparticle Zinc oxide nanoparticles (ZnONPs) were prepared using zinc acetate as a source of zinc and sodium hydroxide as a reducing agent in the presence of capping agent (CMC)8). For the preparation of ZnONPs, 0.15 g CMC was dissolved in 150 mL distilled water by heating the solution at 90oC for about 10 min with constant stirring. The mixture was cooled to 80oC. Each zinc acetate of 0.5. 1.0, 1.5, and 2.5 mM was then added and stirred continuously until they dissolved completely. Thereafter, 1, 2, 3 and 5 mL of 1 M sodium hydroxide solution was added drop-wise in 0.5, 1.0, 1.5, and 2.5 mM zinc acetate solution, respectively and continued stirring at 80oC for 20 min. The formation of milky white solution indicated the formation of ZnONPs. The ZnONPs formed with different concentrations of zinc acetate were designated as ZnONP0.5, ZnONP1.0, ZnONP1.5, and ZnONP2.5, respectively. Preparation of gelatin/ZnO nanoparticle nanocomposite film Gelatin and gelatin/ZnO nanoparticle nanocomposite films were prepared by the solution casting method as described by Rhim et al.9). 4 g of gelatin was added slowly in 150 mL of the above prepared ZnONPs solutions with stirring until they dissolved completely, followed by the addition of 1.2 g glycerol as a plasticizer and continued stirring at 80oC for 20 min using a magnetic stirrer with thermostat (with controlled temperature). The film forming solution was casted evenly on a leveled Teflon film (Cole-Parmer Instrument Co., Chicago, IL, USA) coated glass plate (24×30 cm) and dried at room temperature for about 48 h. The completely dried films were peeled off from glass plates and preconditioned at 25oC and 50% RH for 48 h before further characterizations. The control gelatin and gelatin/CMC films were prepared by the same method without addition of ZnONPs. The gelatin/ZnONPs nanocomposite films were named as gelatin/ZnOACMC0.5, gelatin/ZnOACMC1.0, gelatin/ZnOACMC1.5, and gelatin/ZnOACMC2.5. Characterization of gelatin/ZnONPs nanocomposite films Morphological observation, FT-IR and XRD analysis. For the field emission scanning electron microscopic (FE-. Korea Journal of Packaging Science & Technology. SEM) analysis, the small piece of film was mounted on SEM specimen holder and analyzed using a FE-SEM (S-4800, Hitachi Co., Ltd., Matsuda, Japan) with an accelerating voltage of 5.0 kV. Fourier transform infrared (FT-IR) spectra of the films were obtained using an attenuated total reflectance-Fourier transform infrared (AT-FTIR) spectrophotometer (TENSOR 37 spectrophotometer with OPUS 6.0 software, Billerica, MA, USA) at a resolution of 4 cm-1. For X-ray diffraction (XRD) pattern of the films was analyzed by X-ray diffractometer (PANalytical Xpert pro MRD diffractometer, Amsterdam, Netherlands). The spectra were recorded using Cu Ká radiation (wavelength of 0.1546 nm) and a nickel monochromator filtering wave at 40 kV and 30 mA. Surface color and optical properties. The surface color of the films was measured by Chroma meter (Konica Minolta, CR-400, Tokyo, Japan) with a white color plate (L=97.75, a=-0.49, and b=1.96) as a standard background. Hunter color values (L, a, and b) were determined by taking an average of five readings from each film sample. Total color difference (E) was calculated as follows: ∆E = [(∆L)2 + (∆a)2 + (∆b)2]0.5 where ∆L, ∆a, and ∆b are the difference between each color value of standard color plate and film samples, respectively. For optical properties of the films, each film sample was directly mounted between two spectrophotometer magnetic cells. The absorbance and percent transmittance spectra were measured using a UV-vis spectrophotometer (Mecasys Optizen POP Series UV/Vis, Seoul, Korea). Absorbance was taken in the wavelength of 200~700 nm at 1 nm interval. Transparency of the films was tested by measuring percent transmittance at 280 nm (T280 nm) and 660 nm (T660 nm). Water vapor permeability, water contact angle and moisture content. The water vapor permeability (WVP) of the films was determined gravimetrically according to the standard method of ASTM E96-95 with slight modification10). The films were cut into square pieces (7.5 cm × 7.5 cm) and directly mounted horizontally on the top of WVP measuring cups containing 18 mL of water. The cups were weighted and subsequently placed in an environmental chamber controlled at 25oC and 50% RH with air movement at 198 m/min. The weight of the cups was taken each 60 min period during 8 h. Water vapor transmission rate (WVTR) was calculated from the slopes (linear) of the steady state portion of weight loss of the cup versus time curve. Then, the WVP of the films was calculated in g.m/m2.s. Pa as follows:.
(3) Vol. 20, No. 2 (2014). Gelatin/ZnO Nanocomposite films. WVP = (WVTR × L) / ∆p where WVTR was the measured water vapor transmission rate (g/m2.s) through a film, L was the mean thickness of the film (m), and ∆p was partial water vapor pressure difference (Pa) across the film. The water contact angle (WCA) of the film was mneasured by WCA analyzer (model Phoenix 150, Surface Electro Optics Co., Ltd., Kunpo, Korea). Each film was cut into rectangular pieces (3 cm × 10 cm) and placed on the horizontal stage (Black Teflon coated steel, 7 cm × 11 cm). The drop of water (~10 µL) was placed on the surface of the film. The contact angle was measured on both sides of the water drop to assume symmetry and horizontal level11). The average values of three measurements of each sample were presented as the degree of WCA. For moisture content (MC) analysis, each film was cut into 3 cm × 3 cm and dried at 100oC for 24 h using a hot air oven12). The weight loss of each film was measured as MC and expressed as percent MC based on the initial weight of the film. Thickness and tensile properties of the films. Thickness of the film samples was measured by handheld micrometer (Dial Thickness Gauge 7301, Mitutoyo Corporation, Kanagawa, Japan). The average values of five random measurements were taken for each film thickness. The tensile strength (TS), elongation at break (E), and elastic modulus (EM) of each film were measured according to the standard test method of ASTM D 882-88 using Instron Universal Testing Machine (Model 5565, Instron Engineering Corporation, Canton, MA, USA). Each film was cut into rectangular strips (2.54 cm × 15 cm) and tensile properties were measured with an initial grip separation of 50 mm and crosshead speed of 50 mm/min. The TS was expressed as MPa, and determined by dividing the maximum load (N) by the initial cross-sectional area (m2) of the films. The E was expressed as %. It was determined by dividing the extension at the rupture of the film by the initial length of the film (50 mm) multiplied by 100. The modulus (MPa) was determined from the slope of the linear portion of the stress–strain curve, which corresponds to the stress divided by the strain of the film sample. Ten measurements were carried out for each film and the average values were presented. Thermal stability. Thermal stability of the films was determined using a thermogravimetric analyzer (TGA, Hi-Res TGA 2950, TA Instrument, New Castle, DE, USA). About 5 mg of each film sample was taken in a standard aluminum cup and heated in the temperature ranged from 30~600oC with heating rate of 10oC/ min under a nitrogen flow of 50 cm3/min. Empty cup was. 43. taken as a reference. The derivative of TGA (DTG) was obtained by calculating differentials of TGA values using a central finite difference method as follows [9]: DTG = (Wt+∆t − Wt-∆t) / 2∆t where, Wt+∆t − Wt -∆t are the residual weight of sample at time t+∆t and t−∆t, respectively, and ∆t is the time interval for reading residual sample weight13). Antimicrobial activity. The antibacterial activities of neat agar and agar/CuNPs BNC films were examined as their inhibitory effects against the growth of Gram-positive bacteria, L. monocytogenes and Gram-negative bacteria, Escherichia coli. Both bacteria were supplied by the Korean culture collection center (Seoul, Korea). L. monocytogenes and E. coli were aseptically inoculated in 20 mL TSB and BHI broth, respectively and subsequently incubated at 37oC for 16 h. Each cultured broth was centrifuged at 5000 rpm for 10 min. The cell pellets were suspended in 100 mL of sterile TSB and BHI broth respectively, and diluted 10 times with sterile distilled water. 50 mL of diluted broth (~106 CFU mL-1) was taken into 100 mL of the conical flask containing film sample (5 cm × 5 cm) and subsequently incubated at 37oC for 12 h under mild shaking. The same diluted broth without film sample was used as the control. At every three hour interval, the cell viability of each pathogen was calculated by counting bacterial colonies on the plates. Antimicrobial tests were performed in triplicate with individually prepared films.. Statistical analysis Statistical analysis was done by one way analysis of variance (ANOVA). The significance of each mean value was determined (p<0.05) with the Duncan’s multiple range tests using the SPSS software (SPSS Inc., Chicago, IL, USA).. Results and Discussion Morphology and EDS analysis The changed appearance of solution from transparent to milky white with time indicated the formation of ZnO nanoparticles. The morphology of ZnONPs, neat gelatin film, and gelatin/ZnONPs nanocomposite films is presented in Fig. 1. The nanoparticles were in the form of colloidal solution and 100-200 nm in size. The neat gelatin film had smooth and compact surface, while gelatin/ZnONPs nanocomposite films showed rough surfaces. The zinc nanoparticles were uniformly distributed throughout the films without any aggregation of particles. Similar surface morphology of nanocomposite films was observed by Kanmani and Rhim, who prepared nanocomposite films by blending ZnO nanoparticles.
(4) 44. Shiv Shankar et al.. Korea Journal of Packaging Science & Technology. Fig. 1. FE-SEM images of (a) ZnONPs (b) neat gelatin and (c) gelatin/ZnONPCMC2.5 nanocomposite films.. Fig. 2. EDS analysis of (a) neat gelatin, (b) gelatin/ZnONPCMC0.5, (c) gelatin/ZnONPCMC1.0, gelatin/ZnONPCMC1.5, and gelatin/ZnONPCMC2.5 nanocomposite films.. with different polymer matrices8). Fig. 2 shows the electron dispersive spectroscopy (EDS) analysis of nanocomposite films. The percentage of Zn increased with the increasing concentrations of ZnONPs in the nanocomposite films.. Optical and color properties The optical properties of gelatin and gelatin/ZnONPs nanocomposite films are shown in Fig. 3. The neat gelatin film showed two peaks around 220-230 nm and 270-280 nm for characteristic peaks of gelatin. However, the nanocomposite films blended with ZnONPs showed an additional peak near 360 nm for a characteristic peak of ZnONPs. The peak intensity was increased when the concentration of ZnONPs increased from 0.5 to 2.5 M. Kim et al.14) also reported the similar results for absorption peak of ZnONPs at around 360-380 nm and the peak intensity increased with the increase in concentration of ZnONPs from 1% to 10%. The light transmittance at 660 nm and 280 nm of nanocomposite films was measured and presented in Table 1. Trans-. Fig. 3. UV-visible spectra of gelatin/ZnONPs nanocomposite films.. mittance values of the neat gelatin film at 660 nm and 280 nm.
(5) Vol. 20, No. 2 (2014). Gelatin/ZnO Nanocomposite films. 45. Table 1. Optical properties of gelatin/ZnONPs nanocomposite films Film. L. a c. T280nm (%). ∆E. b d. a. a. T660nm (%). 1.82±0.09. e. 28.9±0.9. 89.5±0.7c. Gelatin. 93.30±0.09. Gelatin/CMC. 93.24±0.15c. -0.54±0.03d. 4.40±0.04a. 2.01±0.08a. 27.5±1.0d. 90.0±0.6c. Gelatin/ZnONP0.5. 93.00±0.06b. -0.91 ±0.03c. 5.52±0.10b. 3.10±0.11b. 13.0±1.8c. 90.1±0.5c. Gelatin/ZnONP1.0. 92.62±0.07a. -1.31±0.05b. 6.72±0.14c. 4.38±0.14c. 1.9±0.1b. 88.9±1.2c. 1.5. a. a. d. d. a. 77.1±5.6b. Gelatin/ZnONP. 92.73±0.11. -0.49±0.02. -1.90±0.21. 4.20±0.09. 8.14±0.73. 5.76±0.69. 0.6±0.1. Gelatin/ZnONP2.5 92.90±0.12b -1.98±0.11a 8.01±0.32d 5.61±0.29d 0.3±0.0a 72.2±1.1a 1 Each value is the mean of three replicates with the standard deviation. Any two means in the same column followed by the same letter are not significantly (p>0.05) different by Duncan's multiple range tests.. Fig. 4. FT-IR spectra of gelatin/ZnONPs nanoconposite films.. Fig. 5. XRD patterns of gelatin/ZnONPs nanocomposite films.. were 89.5±0.7 % and 28.9±0.9 %, respectively. When ZnONPs were incorporated into gelatin, the % transmittance values of films at 280 nm decreased drastically down to 0.3%, but the % transmittance values at 660 nm decreased marginally with the an increase of ZnONPs concentrations. The concentration of ZnONPs greatly influenced the transmittance value of the nanocomposite films.. X-ray diffraction (XRD) patterns of the neat gelatin and gelatin/ZnONPs nanocomposite films are shown in Fig. 5. The diffraction peaks were not observed in case of neat gelatin film and gelatin/ZnNONPs nanocomposite films with lower concentrations of ZnONPs. However, nanocomposite films with high concentrations of ZnONPs exhibited characteristic diffraction peaks at 2θ of 31.8, 34.4, 36.2, 47.5, 56.5, 62.8, 67.9, and 69.1, which correspond to (100), (002), (101), (102), (110), (103), (112), and (201) planes of zinc oxide nanoparticles, respectively19). These diffraction peaks confirmed the presence of crystalline ZnONPs in nanocomposite films8). Similar results of diffraction peaks were observed with ZnO incorporated nanocomposites with other polymer matrix8,18). The intensity of peaks was increased with an increase in the concentration of ZnONPs.. FTIR and XRD analysis FT-IR analysis was carried out to study the interactions between ZnONPs and gelatin matrix (Fig. 4). The spectra of all nanocomposite film displayed characteristic peaks in the range of 3500 to 650 cm-1. All films exhibited the bands of amide I, amide-II, and amide-III at 1631, 1550, and 1240 cm-1, respectively15). The band around 1041 cm-1 was due to the interaction between OH group of glycerol and gelatin16). The broad peak near 3300 cm-1 was due to hydrogen bonding17). An increase in intensity of peaks was observed when the concentration of ZnONPs increased. It indicated a certain interactions between ZnONPs and biopolymer matrix18).. Thermal stability The thermal stability of the gelatin and gelatin/ZnONPs nanocomposite films was measured using thermogravimetric analysis. The results of TGA and DTG curves are shown in.
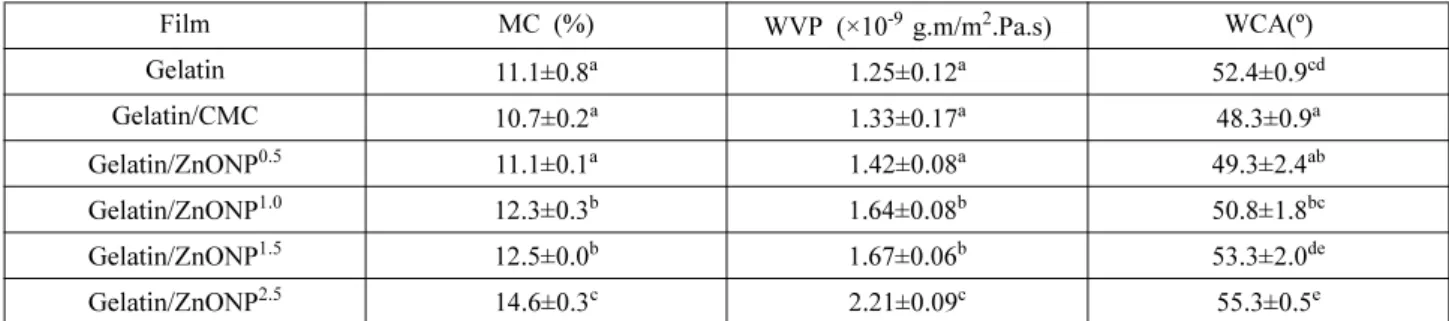
(6) 46. Shiv Shankar et al.. Korea Journal of Packaging Science & Technology. Fig. 6. (a) TGA and (b) DTG thermograms of gelatin/ZnONPs nanocomposite films.. Fig. 6. All films showed multi steps of thermal decomposition in TGA curves. The initial weight loss was observed around 90oC due to the removal of moisture from the films. The small shoulders around 240-260oC was ascribed to the thermal decomposition of glycerol20). The third steps of major thermal decomposition were observed around 320oC, which can be attributed to the thermal decomposition of gelatin21). The thermal stability of gelatin/ZnONPs nanocomposite films was increased with an increase in the concentration of ZnONPs. There were no much difference in TGA and DTG curves of gelatin and gelatin/CMC nanocomposite films. The differences in the curve of gelatin/ZnONPs nanocomnposite films were due to the presence of ZnONPs. After the final thermal decomposition, the residual percentages at around 600oC of the neat gelatin, gelatin/CMC, gelatin/ZnONP0.5, gelatin/ZnONP1.0, gelatin/ZnONP1.5, gelatin/ZnONP2.5 were 23.63, 21.97, 23.76, 28.98, 33.12, and 36.01%, respectively.. Moisture content, water contact angle and water vapor permeability Table 2 shows the MC, WCA, and WVP of the neat gelatin. and gelatin/ZnONPs nanocomposite films. Compared with the neat gelatin film, gelatin/CMC film exhibited slightly lower MC, whereas, MC of gelatin/ZnONPs nanocomposite films increased with an increase in the concentration of ZnONPs. The incorporation of ZnONPs into the gelatin slightly increased the WVP of the films. The nanoparticles in the film matrix exist as discontinuous particles, which make the BNC film more porous and thus increasing the WVP of the polymeric films. In contrast, Kanmani and Rhim8) obtained the decrease in WVP, when ZnONPs were incorporated in various nanocomposite films. Moreover, gelatin/CMC film showed higher WVP as compared to neat gelatin film because of the hydrophilic nature of CMC. The WCA (degree) of the neat gelatin film was 52.4±0.9 and decreased significantly compared to 48.3±0.9 for gelatin/ CMC film (p>0.05). This decrease in WCA was attributed to the hydrophilic behavior of CMC. The WCA values nanocomposite films increased linearly after blending ZnONPs in gelatin matrix. The WCA of films was increased with an increase in the concentration of ZnONPs used for incorporation in BNC films. This increase in the values of WCA was due to. Table 2. Misture content, water vapor permeability, and water contact angle of gelatin/ZnONPs nanocomposite films Film. MC (%). WVP (×10-9 g.m/m2.Pa.s). WCA(º). Gelatin. 11.1±0.8a. 1.25±0.12a. 52.4±0.9cd. a. a. 1.33±0.17. 48.3±0.9a. Gelatin/CMC. 10.7±0.2. Gelatin/ZnONP0.5. 11.1±0.1a. 1.42±0.08a. 49.3±2.4ab. Gelatin/ZnONP1.0. 12.3±0.3b. 1.64±0.08b. 50.8±1.8bc. Gelatin/ZnONP1.5. 12.5±0.0b. 1.67±0.06b. 53.3±2.0de. Gelatin/ZnONP2.5 14.6±0.3c 2.21±0.09c 55.3±0.5e Each value is the mean of three replicates with the standard deviation. Any two means in the same column followed by the same letter are not significantly (p>0.05) different by Duncan's multiple range tests.. 1.
(7) Vol. 20, No. 2 (2014). Gelatin/ZnO Nanocomposite films. 47. Table 3. Tensile properties of gel/ZnONPs BNC films using different concentrations of ZnONPs Film. Thickness (ìm). Gelatin. 58.2±1.6. Gelatin/CMC Gelatin/ZnONP. 0.5. a. TS (MPa) 50.1±2.1. d. E (%) 7.3±0.2. EM (MPa) a. 1451.2±66.8d 1782.2±90.6e. 59.0±1.9a. 59.0±3.0e. 7.0±0.2a. a. c. a. 59.1±2.0. 44.3±4.6. 7.3±0.3. 1282.2±158.2c. Gelatin/ZnONP1.0. 62.1±1.2b. 40.8±6.4b. 15.4±7.8b. 1120.1±212.8b. Gelatin/ZnONP1.5. 62.1±2.7b. 39.9±4.8b. 22.6±5.6c. 1028.8±186.4b. Gelatin/ZnONP2.5 69.5±3.0c 20.6±3.3a 36.0±3.2d 385.2±77.1a Each value is the mean of three replicates with the standard deviation. Any two means in the same column followed by the same letter are not significantly (p>0.05) different by Duncan's multiple range tests.. 1. the incorporation of hydrophobic ZnONPs, which made the BNC film surface more hydrophobic8). Similarly, Nafchi et al.22) reported that the ZnO nanorod incorporated sago starch films had a higher water contact angle than the neat starch film. They also found that the hydrophobicity of the film increased when high concentrations of ZnO was added into the film.. Thickness and mechanical properties The thickness of the neat gelatin film was 58.2±1.6 µm, which was increased to 59.0±1.9, 59.1±2.0, 62.1±1.2, 62.1± 2.7, and 69.5±3.0 µm for gelatin/CMC, gelatin/ZnONP0.5, gelatin/ZnONP1.0, gelatin/ZnONP1.5, and gelatin/ZnONP2.5 nanocomposite films, respectively (Table 3). Similar results of increased thickness was observed when ZnONPs was added in PVC films23). The mechanical properties of the gelatin films were also greatly influenced by the addition of ZnONPs (Table 3). The tensile strength and elastic modulus of the gelatin films were increased when CMC was added in gelatin. Meanwhile, their linear reduction with incorporation of ZnONPs upto con-. centration of 1.5 mM decreased drastically with 2.5 mM of Zn ONPs. On the contrary, the elongation at break (E) of gelatin films increased significantly with the addition of ZnONPs. These changes in TS and E suggests that incorporation of ZnONPs in gelatin films has made some changes in the structure of gelatin matrix.. Antimicrobial activity The antibacterial activity of the neat gelatin film and gelatin/ZnONPs nanocomposite against Gram-positive (L. monocytogenes) and Gram-negative (E. coli) food pathogenic bacteria is shown in Fig. 7. All ZnONPs incorporated films showed strong antibacterial activity against L. monocytogenes than E. coli. Similar results has been observed by Kanmani and Rhim8) with ZnONPs incorporated various polymer films. The antimicrobial activity of ZnONPs was increased with increase in the concentration of ZnONPs. However, gelatin/ZnONP1.5 and gelatin/ZnONP2.5 showed almost similar antibacterial activities. The results indicated that the gelatin/ZnONP1.5 nanocomposite film showed the best antimicrobial activity among the films tested. Though the mechanism of the antimicrobial ac-. Fig. 7. Antimicrobial activities of gelatin/ZnONPs nanocomposite films against (a) L. monocytogenes and (b) E. coli..
(8) 48. Shiv Shankar et al.. tion of the nanocomposite films including ZnONPs has not been known clearly, it is probable that the films release ZnO NPs and Zn2+ into the medium which bind with outer cell wall of bacteria and penetrate through the cell wall of bacteria. The Zn2+ react with interior components of cells and affects the viability of the cells8,22).. Conclusion The bio-nanocomposite films of gelatin and ZnONPs were synthesized using solvent casting methods. The effects of various concentrations of ZnONPs on the physical, mechanical, and antimicrobial properties of nanocomposite films were studied. UV barrier property of gelatin film was enhanced significantly, whereas mechanical and water vapor properties were decreased after incorporating ZnONPs in the gelatin matrix. The ZnONPs incorporated gelatin films showed profound antibacterial activity against both Gram-positive and Gram-negative food-borne pathogens. The antibacterial and UV barrier properties increased with the increase in the concentrations of ZnONPs. The gelatin/ZnONPs nanocomposite films with strong antimicrobial activity and UV-screening property have high potential to be used as an active food packaging materials to maintain the food quality and to extend the shelf-life of packaged foods.. 7.. 8.. 9.. 10.. 11.. 12.. 13.. Acknowledgements. 14.. This research was supported by the Agriculture Research Center (ARC 710003) program of the Ministry for Agriculture, Food and Rural Affairs, Korea.. 15.. References 1. Shankar, S., Teng, X. and Rhim, J.W. 2014. Properties and characterization of agar/CuNPs bionanocomposite films prepared with different copper salts and reducing agents. Carbohyd. Polym. 114: 484-492. 2. Khallofufi, S., Giasson, J. and Ratti C. 2000. Can. Agric. Eng. 42: 7-11. 3. Llorens, A., Lloret, E., Picouet, P.A., Trbojevich, R. and Fernandez, A. 2012. Metallic based micro and nanocomposites in food contact materials and active food packaging. Trends Food Sci. Technol. 24: 19-29. 4. Kanmani, P. and Rhim, J.W. 2014. Physical, mechanical and antimicrobial properties of gelatin based active nanocomposite films containing AgNPs and nanoclay. Food Hydrocoll. 35: 652-664. 5. Shankar S. and Rhim J.W. 2014. Effect of copper salts and reducing agents on characteristics and antimicrobial activity of copper nanoparticles. Mat. Lett. 132: 307-311. 6. Shankar S., Jaiswal L., Aparna R.S.L. and Prasad R.G.S.V. 2014. Synthesis, characterization, in vitro biocompatibility,. 16.. 17.. 18.. 19.. 20.. Korea Journal of Packaging Science & Technology. and antimicrobial activity of gold, silver and gold silver alloy nanoparticles prepared from Lansium domesticum fruit peel extract. Mat. Lett. In press Espitia, P.J.P., Soares, N.F.F., Coimbra, J.S.R., de Andrade, N.J., Cruz, R.S. and Medeiros, E.A.A. 2012. Zinc oxide nanoparticles: Synthesis, antimicrobial activity and food packaging applications. Food Bioprocess Tech. 5: 1447-1464. Kanmani, P. and Rhim, J.W. 2014. Properties and characterization of bionanocomposite films prepared with various biopolymers and ZnO nanoparticles. Carbohyd. Polym. 106: 190199. Rhim, J.W., Wang, L.F. and Hong, S.I. 2013. Preparation and characterization of agar/silver nanoparticles composite films with antimicrobial activity. Food Hydrocoll. 33: 327-335. Gennadios, A., Weller, C.L. and Gooding, C.H. 1994. Measurement errors in water vapor permeability of high permeable, hydrophilic edible films. J. Food Eng. 21: 395-409. Rhim, J.W., Hong, S.I., Park, H.M. and Ng, P.K.W. 2006. Preparation and characterization of chitosan-based nanocomposite films with antimicrobial activity. J. Agricul. Food Chem. 54: 5814-5822. Rhim, J.W. and Wang, L.F. 2013. Mechanical and water barrier properties of agar/κ-carrageenan/konjac glucomannan ternary blend biohydrogel films. Carbohyd. Polym. 96: 71–81. Rhim, J.W. 2013. Effect of PLA lamination on performance characteristics of agar/-carrageenan/clay bio-nanocomposite film. Food Res. Int. 51: 714-722. Kim, D., Jeon, K., Lee, Y., Seo, J., Seo, K., Han, H. and Khan, S.B. 2012. Preparation and characterization of UVcured polyurethane acrylate/ZnO nanocomposite films based on surface modified ZnO. Prog. Org. Coat. 74: 435-442. Arfat, Y.A., Benjakul, S., Prodpran, T., Sumpavapol, P. and Songtipya, P. 2014. Properties and antimicrobial activity of fish protein isolate/fish skin gelatin film containing basil leaf essential oil and zinc oxide nanoparticles. Food Hydrocoll. 41: 265-273. Hoque, M.S., Benjakul, S., Prodpran, T. and Songtipya, P. 2011. Properties of blend film based on cuttlefish (Sepia pharaonis) skin gelatin and mungbean protein isolate. Int. J. Biol. Macromol. 49: 663-673. Muyonga, J.H., Cole, C.G.B. and Duodu, K.G. 2004. Characterisation of acid soluble collagen from skins of young and adult Nile perch (Lates niloticus). Food Chem. 85: 81-89. Anitha, S., Brabu, B., John Thiruvadigal, D., Gopalakrishnan, C. and Natarajan, T.S. 2012. Optical, bactericidal and water repellent properties of electrospun nanocomposite membranes of cellulose acetate and ZnO. Carbohyd. Polym. 87: 10651072. Sangeetha, G., Rajeshwari, S. and Venckatesh, R. 2011. Green synthesis of zinc oxide nanoparticles by aloe barbadensis miller leaf extract: Structure and optical properties. Mater. Res. Bull.. 46: 2560-2566. Rhim, J.W., Wang, L.F., Lee, Y. and Hong, S.I. 2014. Preparation and characterization of bio-nanocomposite films of.
(9) Vol. 20, No. 2 (2014). Gelatin/ZnO Nanocomposite films. agar and silver nanoparticles: Laser ablation method. Carbohyd. Polym. 103: 456-465. 21. El-Hefian, E.A., Nasef, M.M. and Yahaya, A.H. 2012. Preparation and characterization of chitosan/agar blended films: part 2. Thermal, mechanical, and surface properties. E-Journal of Chemistry. 9: 510-516. 22. Nafchi, A.M., Alias, A.K., Mahmud, S. and Robal, M. 2012.. 49. Antimicrobial, rheological, and physicochemical properties of sago starch films filled with nanorod-rich zinc oxide. J. Food Eng. 113: 511–519. 23. Li, X., Xing, Y., Li, W., Jiang, Y. and Ding, Y. 2010. Antibacterial and physical properties of poly(vinyl chloride)based film coated with ZnO nanoparticles. Food Sci. Technol. Int. 16: 225-232..
(10)
수치


관련 문서
1 John Owen, Justification by Faith Alone, in The Works of John Owen, ed. John Bolt, trans. Scott Clark, "Do This and Live: Christ's Active Obedience as the
Noorul Haq : Effect of friction welding parameters on mechanical and metallurgical properties of ferritic stainless steel, The international journal of
Fabrication and Optical Properties of Polysiloxane Hybrimer Resin Using Oligohydrosiloxane 1 (OPH 1).. Fabrication and Optical Properties of Polysiloxane Hybrimer
Metalloids(준금속) : the elements that are difficult to classify exclusively as metals or nonmetals and have properties between those of elements in the two
Lee, “Effective Ag Doping by He-Ne Laser Exposure to Improve the Electrical and the Optical Properties of CdTe Thin Films for Heterostructured Thin Film
The mechanical properties of the Ir-based films by the change of the alloy element content show that the hardness value is decreased with Re contents
Effects of vacuum, mold temperature and cooling rate on mechanical properties of press consolidated glass fiber/PET composite , Composites Part A: Applied Science
We report the fabrication of nano-porous ZnO nanowires (NWs) using a process combining laser-induced hydrothermal growth followed by a post annealing process.. Initially,
