https://doi.org/10.20307/nps.2017.23.1.61
61
Anti-obesity Effect of Steamed Soybean and Fermented Steamed Soybean in High-fat Diet-induced Obese ICR Mice
Hye Rin Seo
1, Ah Young Lee
1, Kye Man Cho
2, Eun Ju Cho
1,*, and Hyun Young Kim
2,*
1Department of Food Science and Nutrition, Pusan National University, Busan 46241, Korea
2Department of Food Science, Gyeongnam National University of Science and Technology, Jinju 52725, Korea
Abstract − This study was performed to investigate the ameliorating effects of steamed soybeans (SS) and fermented SS (FSS) on lipid metabolism in high-fat diet-induced obese mice. ICR mice were divided into four groups and given the following different diets: normal diet (ND), high-fat diet (HFD), HFD with 1% SS (HFD + SS), and HFD with 1% FSS (HFD + FSS). After 14 weeks, the body weight gain was higher in the HFD group compared with the ND group but lower in the HFD + FSS group compared with the HFD group. Plasma levels of triglyceride (TG), total cholesterol (TC), low density lipoprotein-cholesterol, aspartate aminotransferase (AST), and alanine aminotransferase (ALT) were significantly higher in the HFD group compared to the ND group, but lower in the HFD + SS and HFD + FSS groups compared with the HFD group. In addition, leptin concentration in plasma was lower in the groups fed HFD + SS and HFD + FSS compared with the HFD group.
The accumulation of hepatic TG and TC was significantly inhibited in the HFD + SS and HFD + FSS groups.
Furthermore, SS and FSS attenuated lipid peroxidation and nitric oxide formation in the liver induced by the high- fat diet. These results suggest that soybeans, especially FSS, may be useful in preventing obesity-induced abnormalities in lipid metabolism.
Keywords − Obesity, Soybean, High-fat diet, Lipid metabolism, Oxidative stress
Introduction
Predominance of obesity is one of the biggest global health issues and represents a crucial problem to modern people.
1-2Obesity is considered a major risk factor for various chronic diseases, including hyperlipidemia, hyper- tension, type 2 diabetes, and coronary heart disease.
3-4Many studies demonstrated that total energy intake and diet composition are important factors for regulating metabolic processes.
5Dietary fat is more effective in storing body fat than other energy sources. Therefore, a high-fat diet can lead to obesity and metabolic abnor- malities, including hyperglycemia, hyperlipidemia, and insulin resistance in humans and animals.
6-7Due to recent prevalence of overweight and obesity, medicines and foods that can control body weight are attracting more attention. Although many types of drugs and treatments,
including reduction of nutrient absorption and regulation of lipid metabolism, have been used for obesity,
8their various side effects have become an issue. Therefore, the use of natural products, such as fermented foods and probiotics, are considered safer for the management of obesity. Since food plays a key role in our life and has a higher influence on health than any other factor, it is taking the limelight as a therapeutic agent for obesity.
Soybean is a good source of vegetable protein and dietary fiber. It also contains a noticeably high content of polyunsaturated fatty acids,
9especially linoleic acid (LA), which makes up for 50% or more of its fatty acid content.
10Furthermore, it contains isoflavones that are related to the prevention and treatment of chronic diseases, including diabetes, hypertension, heart disease, and some types of cancer.
11Fermentation is a widely used method of food processing. There are many types of fermented soybean products especially in Asian countries, including Korea, China, Japan, and Indonesia. Doenjang, kochujang, and soy sauce are common fermented soybean products in Korea and are fermented with diverse microorganisms available in the different regions. Fermentation leads to changes in the nutritional and functional compounds in
*Author for correspondence
Hyun Young Kim, Department of Food Science, Gyeongnam National University of Science and Technology, Jinju 52725, Korea.
Tel: +82-55-751-3277; E-mail: [email protected]
Eun Ju Cho, Department of Food Science and Nutrition, Pusan National University, Busan 46241, Korea.
Tel: +82-51-510-2837; E-mail: [email protected]
soybean, such as lipids, isoflavonoids, and peptides.
12Several studies reported that soybean fermented products are effective against chronic diseases, such as type 2 diabetes and obesity.
13Daewon soybean is a variety that has been produced by artificial breeding between the Suwon No. 133 and Miryang No. 13 strains. A recent study reported that the Daewon soybean is the longest and widest among five soybean varieties that are grown for making tofu and has highest crude protein content.
14In addition, studies have shown that the total phenolic content and antioxidant activity of cheongguk jang, which is made from Daewon soybeans, increased during the fermentation process.
15However, studies on the anti-obesity effect of fermented Daewon soybeans have not been carried out. Therefore, this study was conducted to deter- mine the anti-obesity effect of Daewon soybean and its fermented form in high-fat diet-induced obese ICR mice.
Experimental
Preparation of soybean extracts − The samples used in this study were obtained from the Department of Food Science, Gyeongnam National University of Science and Technology, Jinju, Korea. Daewon soy powder was mixed with 2.5 g of sugar and 500 ml distilled water. After sterilizing, the steamed soy powder mixture was left to stand for 1 h at 38 ± 1
oC to cool down. The mixture was then inoculated with 5% (w/w) Lactobacillus plantarum P1201 and fermented for 60 h at 37 ± 2
oC in an incubator.
Samples were taken before fermentation (steamed soybean or SS) and 60 h after starting fermentation (fermented SS or FSS). The SS and FSS powders were extracted three times in ethanol at room temperature for 24 h each. The extract was concentrated using a rotary evaporator and freeze-dried. The resulting samples were dissolved in dimethyl sulfoxide and used for the in vitro assays.
Animals and diets − Five-week-old male ICR mice weighing 23 - 29 g were purchased from Orient Inc.
(Seongnam, Korea) and housed in plastic cages. They allowed to access food and water freely and were maintained in a controlled environment (20 ± 2
oC tem- perature, 50 ± 10% humidity, 12 h/12 h light/dark cycle).
The animal protocol used in this study was reviewed and approved by the Pusan National University-Institutional Animal Care and Use Committee (PNU-IACUC, Approval number: PNU-2014-0540) regarding the care of the laboratory animals and ethical procedures. After 2 weeks of acclimation, the mice were divided into four groups as follows: normal diet-fed (ND), high-fat diet-fed (HFD), HFD with 1% SS-fed (HFD + SS), and HFD with 1%
FSS-fed (HFD + FSS) groups. There were no significant differences in the initial body weight among the groups, and each diet was given for 14 weeks. The compositions of diets are shown in Table 1. At the end of the testing period, all mice were fasted for 12 h and sacrificed using ethyl ether. Blood samples were collected from the inferior vena cava in tubes containing sodium citrate as an anticoagulant. Plasma was obtained by centrifugation at 3,000 rpm for 20 min at 4
oC and frozen at −80
oC until analysis. The liver, kidney, and brain were removed, rinsed with 0.9% sodium chloride, and weighed. The liver was divided into five parts, and all organs were immediately stored at −80
oC until analysis.
Plasma and hepatic biochemical assays − Blood glucose level was determined using a chemistry analyzer (Hitachi 7600, Hitachi Co., Tokyo, Japan). Aspartate aminotransferase (AST) and alanine aminotransferase (ALT) levels in plasma were determined using a com- mercially available kit (AM101-K; Asan Pharmaceutical, Seoul, Korea). The plasma leptin levels were evaluated using an ELISA kit for mice (EZML-82K, Linco Research, St. Charles, MO, USA). The plasma triglyceride (TG), plasma total cholesterol (TC), and high-density lipoprotein cholesterol (HDL-C) levels were measured using commercially available kits (AM157S-K, AM 202- K, and AM 203-K; Asan Pharmaceutical Co., Seoul,
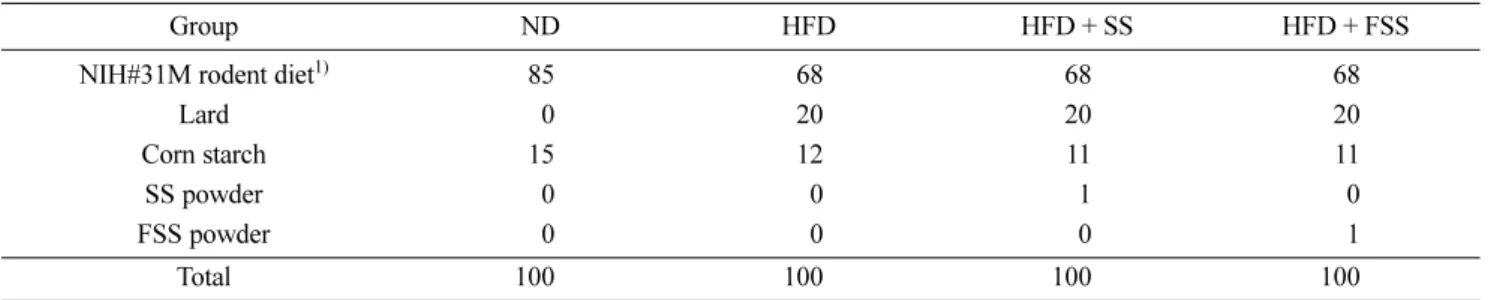
Table 1. Diet composition (g/100 g)
Group ND HFD HFD + SS HFD + FSS
NIH#31M rodent diet1) 85 68 68 68
Lard 0 20 20 20
Corn starch 15 12 11 11
SS powder 0 0 1 0
FSS powder 0 0 0 1
Total 100 100 100 100
1)NIH#31M rodent diet: 5% fat, 4.02 kcal/g, Taconic Farms. ND: normal diet, HFD: high-fat diet, SS: 1% steamed soybean, FSS: 1%
steamed soybean fermented for 60 h.
Korea). The low-density lipoprotein cholesterol (LDL-C) levels, atherogenic index (AI), and cardiac risk factor (CRF) were calculated as follows:
LDL-C = TC − HDL-C AI = (TC − HDL-C) / HDL-C CRF = TC / HDL-C
To determine the hepatic TG and TC concentrations, a modified Folch method was used.
16Frozen liver tissues were mixed with a volume of Folch solution six times the weight of the tissue and homogenized. The liver homogenate was centrifuged at 1900 × g for 20 min at 4
oC, and the supernatant was stored on ice until analysis.
The concentrations of TG and TC in liver were measured using the same kits (AM157S-K and AM 202-K; Asan Pharmaceutical).
Lipid peroxidation measurements in organs − Malondialdehyde (MDA) levels were determined using the thiobarbituric acid-reactive substances (TBARS) method previously described by Uchiyama and Mihara.
17Tissue lysates were treated with 0.67% TBA and 20%
trichloroacetic acid. After boiling at 100
oC for 45 min, the mixtures were cooled on ice and extracted with n- butanol. After centrifugation at 4000 × g for 10 min, the fluorescence of the n-butanol layer was measured at wavelength of 540 nm using a fluorescence spectrophoto- meter (model RF-5300PC, Shimadzu, Kyoto, Japan).
TBARS levels were determined from a MDA equivalence standard.
Assay of nitric oxide (NO) levels in organs − The amount of NO production was assayed by measuring the accumulation of nitrite using a microplate assay method based on the Griess reaction.
18Briefly, the supernatant was allowed to react with an equal volume of Griess reagent, and this mixture was then incubated at room temperature for 30 min. The optical density of the samples was measured at 540 nm using a microplate reader.
Statistical Analysis − Significance was verified by performing Duncan’s multiple range tests using the SAS software (version 6.0, SAS Institute, Cary, NC, USA).
Results
Body weight gain and food efficiency ratio (FER) − The changes in body weight and food intake of ICR mice during the experimental period are shown in Table 2. There was no significant difference in initial body weight and food intake during the experimental period.
However, the gained body weight and FER of the HFD and HFD + SS groups were significantly higher compared with those of the ND group, while the gained body weight and FER of the HFD + FSS group were similar to those of the ND group.
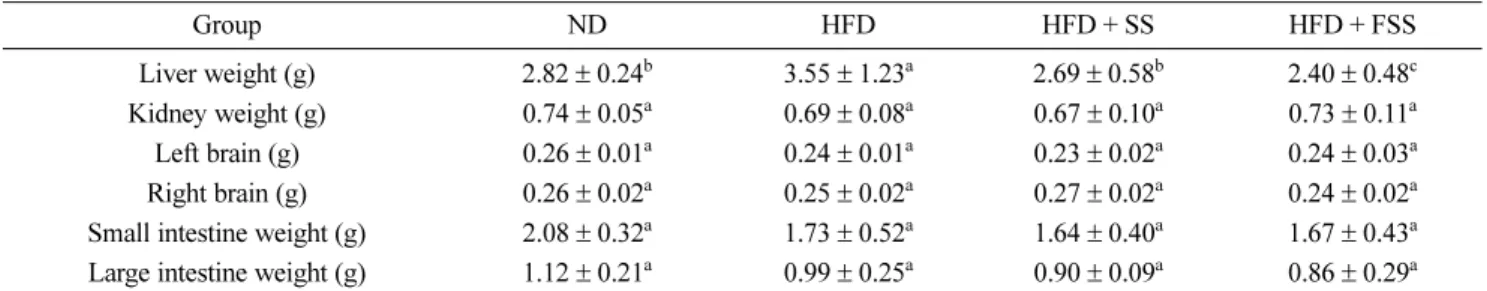
Weight of the organs − As shown in Table 3, the liver
Table 2. Changes in body weight gain and food intake for 14 weeks
Group ND HFD HFD + SS HFD + FSS
Initial body weight (g) 33.19± 1.71a 34.40± 1.55a 33.70± 1.54a 33.50± 2.25a Final body weight (g) 41.20± 2.22b 54.12± 8.09a 44.27± 5.86a 43.48± 2.80b Gained body weight (g) 556.6± 1.3b 518.8± 8.2a 518.6± 6.2a 510.2± 3.2b
Food intake (g/day) 55.05± 1.51a 54.76± 1.20a 54.64± 1.65a 55.08± 1.21a FER1) 51.57± 0.30b 54.76± 2.07a 54.83± 1.61a 52.42± 0.76b Values are mean± SD (n = 6). a~bMeans indicated with different letters are significantly different (P < 0.05) by Duncan's multiple range test. 1)FER: The Food Efficiency Ratio (body weight gain per g consumed food). ND: normal diet, HFD: high-fat diet, SS: 1% steamed soybean, FSS: 1% steamed soybean fermented for 60 h.
Table 3. Changes in organ weight of mice fed a high-fat diet for 14 weeks
Group ND HFD HFD + SS HFD + FSS
Liver weight (g) 2.82± 0.24b 3.55± 1.23a 2.69± 0.58b 2.40± 0.48c Kidney weight (g) 0.74± 0.05a 0.69± 0.08a 0.67± 0.10a 0.73± 0.11a Left brain (g) 0.26± 0.01a 0.24± 0.01a 0.23± 0.02a 0.24± 0.03a Right brain (g) 0.26± 0.02a 0.25± 0.02a 0.27± 0.02a 0.24± 0.02a Small intestine weight (g) 2.08± 0.32a 1.73± 0.52a 1.64± 0.40a 1.67± 0.43a Large intestine weight (g) 1.12± 0.21a 0.99± 0.25a 0.90± 0.09a 0.86± 0.29a Values are mean± SD (n = 6). a~cMeans indicated with different letters are significantly different (P < 0.05) by Duncan's multiple range test. ND: normal diet, HFD: high-fat diet, SS: 1% steamed soybean, FSS: 1% steamed soybean fermented for 60 h.
weight of the HFD group (3.55 g) is significantly higher compared with that of the ND group (2.82 g). However, the liver weight of the HFD + SS and HFD + FSS groups were 2.69 g and 2.40 g, respectively. There was no significant difference in the weights of the other organs, including the kidney, left brain, right brain, small intestine, and large intestine, among those groups.
Plasma AST and ALT levels − Fig. 1 shows the plasma AST and ALT levels. The HFD group showed higher AST and ALT levels compared with the ND group. However, the AST and ALT levels of the HFD + SS and HFD + FSS groups were significantly lower compared with HFD group, and the AST and ALT levels of the HFD + FSS group were significantly lower than those of the HFD + SS group.
Plasma lipid profiles − As shown in Table 4, the plasma TG and TC levels were higher in the HFD group.
The HFD + SS and HFD + FSS groups had significantly lower plasma TG levels compared with the HFD group.
In particular, FSS was more effective in reducing the plasma TG level compared with SS. There was no significant difference in the plasma TC levels of the HFD and HFD + SS groups, while HFD + FSS group showed significantly lower plasma TC level compared with the HFD group. HDL-C was lower in the HFD- and soybean- fed groups compared with the ND group, but the HDL-C level in HFD + FSS was significantly higher compared with the HFD and HFD + SS groups. Plasma LDL-C was significantly higher in the HFD group. Meanwhile, FSS diet significantly decreased the LDL-C level compared with the HFD. The HTR (high density lipoprotein cholesterol and total cholesterol ratio) was lower in the HFD group compared with the ND group. However, the HTR of the HFD + SS and HFD + FSS groups were higher than that of the HFD group, and FSS was more effective in increasing HTR compared with SS. The AI and CRF values were also higher in the HFD group compared with the ND group. However, both soybean-fed
Table 4. Effect of SS and FSS on the plasma lipid profiles and plasma glucose levelsGroup ND HFD HFD + SS HFD + FSS
Plasma TG (mg/dl) 128.43± 1.77c 169.79± 0.79a 138.50± 1.32b 128.21± 1.74c Plasma TC (mg/dl) 117.08± 1.73c 156.10± 1.33a 155.11± 1.71a 138.05± 2.41b HDL-C (mg/dl) 574.65± 1.59a 551.26± 0.81d 554.72± 0.48c 557.34± 0.35b LDL-C (mg/dl) 516.74± 0.87d 570.89± 1.03b 572.68± 1.32a 555.06± 2.29c HTR1) 550.64± 0.01a 550.33± 0.00d 550.35± 0.00c 550.42± 0.01b AI2) 550.57± 0.02d 552.05± 0.04a 551.83± 0.02b 551.41± 0.04c CRF3) 551.57± 0.02d 553.05± 0.04a 552.83± 0.0.2b 552.41± 0.04c Plasma glucose (mg/dl) 233.00± 18.75a 285.00± 45.41a 252.75± 47.97a 172.00± 27.82b Values are mean± SD (n = 6). a~dMeans indicated with different letters are significantly different (P < 0.05) by Duncan’s multiple range test. 1)HTR = High density lipoprotein cholesterol and total cholesterol ratio, 2)AI = Atherogenic index, 3)CRF = Cardiac risk factor.
Fig. 1. Effects of SS and FSS on AST (A) and ALT (B) levels. Values are mean ± SD (n = 6). a~dMeans indicated with different letters are significantly different (P < 0.05) by Duncan's multiple range test. ND: normal diet, HFD: high-fat diet, SS: 1% steamed soybean, FSS:
1% steamed soybean fermented for 60 h.
groups, especially HFD + FSS, had lower AI and CRF values compared with the HFD group. The plasma glucose level of the HFD + FSS group was lower than those of other groups.
Plasma leptin levels − Changes in plasma leptin levels are shown in Fig. 2. The leptin level of the HFD group was significantly higher compared with the ND group.
However, the leptin levels in the soybean-fed groups, especially the HFD + FSS group, were significantly lower compared with the HFD group.
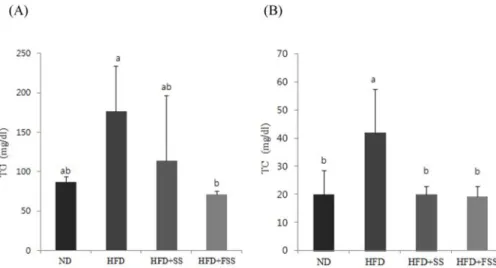
Hepatic lipid profiles − As shown in Fig. 3, the hepatic levels of TG and TC were significantly higher in the HFD group compared with the ND group. However, compared with the HFD group, the HFD + SS and HFD + FSS groups had lower hepatic TG and TC values, which were similar to those of the ND group.
Inhibition of lipid peroxidation − The MDA level in the liver of the ND group was 37.68 nmol/mg protein, but that of the HFD group was 163.71 nmol/mg protein (Table 5). However, the MDA levels in the liver of the HFD + SS (142.34 nmol/mg protein) and HFD + FSS (49.07 nmol/mg protein) were significantly lower compared with that of the HFD group. MDA in the brain was also significantly higher in the HFD group (28.75 nmol/mg protein) compared with the ND group (21.71 nmol/mg
Table 5. Effect of SS and FSS on lipid peroxidation in the liver, brain, and kidney
Group MDA (nmole/mg protein)
Liver Brain Kidney
ND 537.68± 22.97b 21.71± 3.83b 47.06± 16.93a
HFD 163.71± 35.28a 28.75± 5.87a 50.84± 9.47a
HFD + SS 142.34± 73.05a 26.80± 2.77ab 53.75± 24.96a
HFD + FSS 549.07± 16.17b 28.13± 3.05ab 45.97± 9.47a
Values are mean± SD (n = 6). a~bMeans indicated with different letters are significantly different (P < 0.05) by Duncan's multiple range test. ND: normal diet, HFD: high-fat diet, SS: 1% steamed soybean, FSS: 1% steamed soybean fermented for 60 h.
Fig. 2. Effects of SS and FSS on plasma leptin. Values are mean
± SD (n = 6). a~cMeans indicated with different letters are significantly different (P < 0.05) by Duncan's multiple range test.
ND: normal diet, HFD: high-fat diet, SS: 1% steamed soybean, FSS: 1% steamed soybean fermented for 60 h.
Fig. 3. Effects of SS and FSS on hepatic TG (A) and TC (B). Values are mean ± SD (n = 6). a~bMeans indicated with different letters are significantly different (P < 0.05) by Duncan's multiple range test. ND: normal diet, HFD: high-fat diet, SS: 1% steamed soybean, FSS:
1% steamed soybean fermented for 60 h.
protein). However, SS and FSS led to reduced MDA levels in the brain, which were 26.80 and 28.13 nmol/mg protein respectively. No significant difference was observed in the MDA levels in the kidney among the groups.
Inhibition of NO formation − Table 6 shows the protective activity of SS and FSS against NO in mice fed with high-fat diet. The NO level in the liver was higher in the HFD group (34.00 μmol/mg protein) compared with the ND group (16.90 μmol/mg protein). However, the NO levels in the liver of the HFD + SS and HFD + FSS groups were lower compared with that of the HFD group.
In particular, the HFD + FSS group had a MDA level in liver of 17.80 μmol/mg protein, which is similar to that of the ND group. There were no significant differences in the MDA levels in the brain and kidney among the groups.
Discussion
The high prevalence of obesity is caused by several factors, including fat-enriched diet, sedentary lifestyles, and an increase in systemic oxidative stress and inflam- mation.
19-20Obesity is correlated with degenerative diseases, such as type 2 diabetes, cardiovascular diseases, and even cancer,
21and has been categorized as a disease by the American Medical Association in 2013.
22Although many studies have been shown the health benefit of soybean, which is good for preventing diabetes, heart disease and cancer, the anti-obesity effect of Daewon soybean fermented by L. plantarum P1201 is not studied yet. According to Yoo
14and Choi et al.,
15Daewon soybean increased the levels of phenolic compounds, which possess anti-oxidant properties during fermentation.
In addition, L. plantarum P1201 produces higher CLA contents.
23Since FSS contains high levels of phenolic compounds and CLA, we hypothesized that FSS combines probiotics may have synergistic effect against obesity.
Thus, in this study, we carried out the comparative studies on anti-obesity effect of fermented and unfermented Daewon steamed soybean on body fat and lipid para-
meters in animal model.
To investigate the anti-obesity effect of SS and FSS, we used high-fat diet-induced mice. Our data showed higher body weight and FER in the HFD group compared with the ND group and lower body weight and FER in the HFD + FSS group compared with the HFD group (Table 2). It can be deduced that FSS is protective against HFD- induced obesity.
In normal states, dietary TG and cholesterol are kept in balance by composed lipids from organ cells, and blood lipoprotein level is appropriately regulated by homeostasis.
However, genetic and environmental factors may affect the body lipid balance, thereby causing increased LDL-C, reduced HDL-C, arteriosclerosis, hypertension, and car- diovascular diseases.
24In the present study, the HFD group had elevated TG, TC, LDL-C, AI, and CRF levels and reduced HDL-C level (Table 4). However, the intake of SS and FSS improved the lipid status, suggesting the protective effect of SS and FSS against obesity in mice fed with high-fat diet. Increased HDL-C could be regarded as beneficial for two reasons. It can control the outbreak of atherosclerosis and suppress the risk of cardiovascular events.
25Therefore it can be considered that the decreased AI and CRF in the SS- and FSS-fed groups resulted from elevated HDL-C in those groups. The other advantage of HDL-C is the promotion of glucose uptake by skeletal muscles and regulation of insulin synthesis and secretion from pancreatic β-cells, thereby affecting glycemic control.
26A recent study proposed that hyperglycemic condition induced by high caloric intake due to a high-fat diet can affect the secretion of pancreatic β-cells, resulting in the development of insulin resistance.
27Our study showed that the intake of FSS significantly lowered glucose levels compared with the other groups. This data suggests the effectiveness of FSS in decreasing glucose levels in obese mice fed with high-fat diet.
Leptin is a type of adipokine, which is associated with insulin sensitivity and metabolism of glucose, and earlier studies suggested that excessive intake of high-fat diet can
Table 6. Effects of SS and FSS on NO formation in the liver, brain, and kidneyGroup NaNO2 (µmole/mg protein)
Liver Brain Kidney
ND 16.90± 9.44b 50.59± 21.68a 52.24± 19.34a
HFD 34.00± 19.66a 62.53± 6.80a 69.94± 9.10a
HFD + SS 21.46± 9.14ab 67.07± 8.13a 72.22± 9.07a
HFD + FSS 17.80± 8.15b 61.37± 9.92a 72.58± 6.77a
Values are mean± SD (n = 6). a~bMeans indicated with different letters are significantly different (P < 0.05) by Duncan’s multiple range test. ND: normal diet, HFD: high-fat diet, SS: 1% steamed soybean, FSS: 1% steamed soybean fermented for 60 h.
lead to increased serum leptin levels that result in leptin resistance.
28-30It is known that adipocytes TG levels are positively correlated with leptin levels.
31Leptin also activates the axis of transforming growth factor- β and stellate cells, which leads to increased insulin resistance and hepatic disease in in vitro and in vivo models.
32-33Furthermore, recent reports demonstrated that blood leptin correlates with hepatic steatosis.
34In the present study, plasma leptin was significantly higher in the HFD group compared with the ND group (Fig. 2). However, SS and FSS decreased leptin levels, suggesting the protective effect of SS and FSS against obesity-induced excessive plasma leptin levels.
The hepatic enzymes, AST and ALT, are distributed in some organs, such as the liver, heart, and skeletal muscle.
Damaged liver releases AST and ALT into the extracellular space, and the blood levels of AST and ALT are increased by circulation and used as indicators of hepatic injury.
35The SS- and FSS-fed groups had lower plasma AST and ALT levels compared with HFD groups, with the FSS-fed group having the lowest levels among the groups (Fig. 1). Therefore, it can be concluded that soybeans, especially FSSs, have a protective effect against hepatic injury.
Obesity can trigger excessive ectopic lipid deposition, which leads to disrupted cellular physiological function and pathological progression of internal organs. Liver is necessary for survival because of its crucial roles, such as detoxification, protein synthesis, regulation of digestion, metabolism of nutrients and drugs, and blood homeostasis.
The study of Yu et al.
36demonstrated that lipids accu- mulated within liver cells and formed fat vacuoles with increased obesity and hyperlipidemia in high-fat diet-fed mice. In this study, hepatic TC, TG, and liver weight were elevated in the HFD group (Fig. 3, Table 3). However, SS and FSS decreased those values, suggesting the protective effect of soybeans against obesity-induced fat accumula- tion in liver.
Oxidative stress can be generated by various factors, including hypoxia in adipocytes, excessive nutrient oxidation, hyperleptinemia, hyperlipidemia, endothelial dysfunction, and hyperglycemia induced by obesity.
37Furthermore, obesity per se is regarded as an inducer of systemic oxidative stress.
38The study of Milagro et al.
39demonstrated that high-fat diet-induced obesity is highly associated with the elevation of oxidative stress not only in white adipose tissues or in plasma but also in liver, which possibly contributes to hepatic steatosis and other disorders. In the liver, reactive oxygen species (ROS) and lipid peroxidation products attack the mitochondrial
respiratory chain through oxidative damage. This state leads to further ROS production, and a vicious cycle ensues.
40HFDs cause oxidative stress, which promotes the accumulation of peroxidized lipids.
41Earlier studies showed elevated levels of TBARS, an indicator of oxidative stress, in the liver of high-fat diet-induced obese mice.
42-43Our study also showed an elevated hepatic MDA level in the HFD-fed group (Table 5). However, FSS reduced hepatic MDA, suggesting the protective effect of FSS against oxidation-induced lipid peroxidation in the liver.
Rege et al.
44demonstrated that MDA was also elevated in the brain of high-fat diet-induced obese mice. This is consistent with our present study where increased MDA was observed in the brain of HFD-fed mice. The MDA levels in the brain of the SS- and FSS-fed groups were lower compared with that in the HFD-fed group.
Therefore, it can be deduced that SS and FSS have mild protective effects on the liver as well as the brain against oxidative stress. In addition, a recent study showed increased NO production in the liver of high-fat diet- induced obese mice.
45In the present study, soybeans, especially FSS, were effective in reducing NO production in the liver (Table 6), suggesting the protective effects of SS and FSS against hepatic NO production.
Fermentation improves nutritional and functional pro- perties by physical and enzymatic processing. Firstly, fermentation of Deawon steamed soybean increases bioactive compounds, such as phenolic compounds which contribute to more beneficial effect on human body and prevent chronic diseases mediated by oxidative stress.
46Recent study showed that fermented steamed Deawon soybean with L. plantarum P1201, which is a normal inhabitant of the human colon, enhanced bioconversion of isoflavone glycosides into aglycones content during fer- mentation.
47Isoflavone aglycones not only are absorbed faster and greater amounts in human body, but it also suppressed absorption of lipid into a body effectively than their glycoside form.
48-49Secondly, Kim et al.
23demon- strated that L. plantarum P1201 produced higher CLA contents after fermentation of Daewon steamed soybean.
Supplementation of CLA has been reported to decrease in body fat via reduction of energy intake, which may reduce body weight gain and prevent obesity.
50Considering these aspects, compared with SS, FSS may be useful as a functional food with anti-obesity effect.
In conclusion, we found an anti-obesity effect of
Daewon soybean and its fermented form in high-fat diet-
fed ICR mice. SS and FSS containing diet led to lower
whole body and liver weights, and levels of AST, ALT,
and plasma lipids, including TG, TC, LDL-C. Furthermore,
SS and FSS exhibited strong activity in reducing plasma leptin levels. Hepatic TG and TC were also lower in mice fed SS and FSS, and lipid peroxidation in the liver and brain induced by a high-fat diet was reduced by the intake of SS and FSS. Finally, SS and FSS were effective in reducing hepatic NO. Altogether, these results suggest that soybeans, especially FSS, could inhibit obesity-induced abnormal lipid states and oxidative stress.
References
(1) Bae, C. R.; Kwon, D. Y.; Cha, Y. S. J. Clin. Biochem. Nutr. 2014, 54, 45-50.
(2) de Almeida, M. M.; de Souza, Y. O.; Dutra Luquetti, S. C.;
Sabarense, C. M.; do Amaral Corrêa, J. O.; da Conceição, E. P.; Lisboa, P.
C.; de Moura, E. G., Andrade Soares, S. M.; Moura Gualberto, A. C.;
Gameiro, J.; da Gama, M. A.; Ferraz Lopes, F. C.; González Garcia, R.
M. J. Oleo. Sci. 2015, 64, 539-551.
(3) Larsson, B.; Björntorp, P.; Tibblin, G. Int. J. Obes. 1981, 5, 97-116.
(4) Amo, K.; Arai, H.; Uebanso, T.; Fukaya, M.; Koganei, M.; Sasaki, H.; Yamamoto, H.; Taketani, Y.; Takeda, E. J. Clin. Biochem. Nutr. 2011, 49, 1-7.
(5) Reaven, G. M. Curr. Atheroscler. Rep. 2000, 2, 503-507.
(6) Lei, F.; Zhang, X. N.; Wang, W.; Xing, D. M.; Xie, W. D.; Su, H.;
Du, L. J. Int. J. Obes. 2007, 31, 1023-1029.
(7) Ikeuchi, M.; Koyama, T.; Takahashi, J.; Yazawa, K. Biosci.
Biotechnol. Biochem. 2007, 71, 893-899.
(8) Lee, Y. S.; Choi, B. K.; Lee, H. J.; Lee, D. R.; Cheng, J.; Lee, W. K.;
Yang, S. H.; Suh, J. W. Asian Pac. J. Trop. Med. 2015, 8, 276-282.
(9) Mateos-Aparicio, I.; Redondo-Cuenca, A.; Villanueva-Suárez, M. J.;
Zapata-Revilla, M. A. 2008, Nutr. Hosp. 23, 305-312.
(10) Liu, K. S. In Soybeans: Chemistry, Technology and Utilization;
Chapman and Hall, New York, 1997, pp 442-447.
(11) Craig, W. J. J. Am. Diet. Assoc. 1997, 97, S199-S204.
(12) Kwon, D. Y.; Daily, J. W. 3rd.; Kim, H. J.; Park, S. Nutr. Res. 2010, 30, 1-13.
(13) Cha, Y. S.; Kim, S. R.; Yang, J. A.; Back, H. I.; Kim, M. G.; Jung, S. J.; Song, W. O.; Chae, S. W. Nutr. Metab. 2013, 10, 24.
(14) Yoo, K. M. Korean J. Food Nutr. 2011, 24, 451-457.
(15) Choi, M.; Cho, K.; Nam, S. J. Korean Soc. Food Sci. Nutr. 2014, 43, 243-249.
(16) Folch, J.; Lees, M.; Stanley Stanley, G. H. J. Biol. Chem. 1957, 226, 497-509.
(17) Uchiyama, M.; Mihara, M. Anal. Biochem. 1978, 86, 271-278.
(18) Sun, J.; Zhang, X.; Broderick, M.; Fein, H. Sensors 2003, 3, 276- 284.
(19) Elmarakby, A. A.; Sullivan, J. C. Cardiovasc. Ther. 2012, 30, 49- 59.
(20) Bondia-Pons, I.; Ryan, L.; Martinez, J. A. J. Physiol. Biochem.
2012, 4, 701-711.
(21) Hill, J. O.; Catenacci, V.; Wyatt, H. R. Psychiatr. Clin. North Am.
2005, 28, 1-23.
(22) American Medical Association 2013. American Medical Association: AMA adopt new policies on second day of voting at Annual Meeting (obesity as a disease); Marketwired: 2013.
(23) Kim, B.; Lee, B. W.; Hwang, C. E.; Lee, Y. Y.; Lee, C.; Kim, B. J.;
Park, J. Y.; Sim, E. Y.; Haque, M. A.; Lee, D. H.; Lee, J. H.; Ahn, M, J.;
Lee, H. Y.; Ko, J. M.; Kim, H. T.; Cho, K. M. Kor. J. Microbiol. 2015, 51, 231-240.
(24) Abete, N. American Journal of Medicine 1999, 107, 125-135.
(25) Rader, D. J.; Hovingh, G. K. Lancet 2014, 384, 618-625.
(26) Siebel, A. L.; Heywood, S. E.; Kingwell, B. A. Front. Pharmacol.
2015, 6, 258.
(27) Kahn, B. B.; Flier, J. S. J. Clin. Invest. 2000, 106, 473-481.
(28) Lin, S.; Thomas, T. C.; Storlien, L. H.; Huang, X. F. Int. J. Obes.
Relat. Metab. Disord. 2000, 24, 639-646.
(29) Cano, P. G.; Santacruz, A.; Trejo, F. M.; Sanz, Y. Obesity 2013, 21, 2310-2321.
(30) Xu, Y.; Zhang, M.; Wu, T.; Dai, S.; Xu, J.; Zhou, Z. Food Funct.
2015, 6, 297-304.
(31) Unger, R. H.; Zhou, Y. T.; Orci, L. Proc. Natl. Acad. Sci. U. S. A.
1999, 96, 2327-2332.
(32) Van Steenbergen, W.; Lanckmans, S. Int. J. Obes. Relat. Metab.
Disord. 1995, 19, S27-S36.
(33) Cohen, B.; Novick, D.; Rubinstein, M. Science 1996, 274, 1185- 1188.
(34) Chitturi, S.; Farrell, G.; Frost, L.; Kriketos, A.; Lin, R.; Fung, C.;
Liddle, C.; Samarasinghe, D.; George, J. Hepatology 2002, 36, 403-409.
(35) Sallie, R.; Tredger, J. M.; William, R. Biopharm. Drug Dispos.
1991, 12, 251-259.
(36) Yu, X. X.; Murray, S. F.; Pandey, S. K.; Booten, S. L.; Bao, D.;
Song, X. Z.; Kelly, S.; Chen, S.; McKay, R.; Monia, B. P.; Bhanot, S.
Hepatology 2005, 42,362-371.
(37) Fernández-Sánchez, A.; Madrigal-Santillán, E.; Bautista, M.;
Esquivel-Soto, J.; Morales-González, Á.; Esquivel-Chirino, C.; Durante- Montiel, I.; Sánchez-Rivera, G.; Valadez-Vega, C.; Morales-González, J.
A. Int. J. Mol. Sci. 2011, 12, 3117-3132.
(38) Furukawa, S.; Fujita, T.; Shimabukuro, M.; Iwaki, M.; Yamada, Y.;
Nakajima, Y.; Makishima, M.; Matsuda, M.; Shimomura, I. J. Clin.
Invest. 2004, 114, 1752-1761.
(39) Milagro, F. I.; Campión, J.; Martínez, J. A. Obesity 2006, 14, 1118- 1123.
(40) Oliveira. C. P.; Coelho, A. M.; Barbeiro, H. V.; Lima, V. M.;
Soriano, F.; Ribeiro, C.; Molan, N. A.; Alves, V. A.; Souza, H. P.;
Machado, M. C.; Carrilho, F. J. Braz. J. Med. Biol. Res. 2006, 39, 189- 194.
(41) Vincent, H. K.; Taylor, A. G. Int. J. Obes. 2006, 30, 400-418.
(42) Katsube, T.; Tamasaki, M.; Shiwaku, K.; Ishijima, T.; Matsumoto, I.; Abe, K.; Yamasaki, Y. J. Sci. Food Agric. 2010, 90, 2386-2392.
(43) Jung, C. H.; Cho, I.; Ahn, J.; Jeon, T. I.; Ha, T. Y. Phytother. Res.
2013, 27, 139-143.
(44) Rege, S. D.; Kumar, S.; Wilson, D. N.; Tamura, L.; Geetha, T.;
Mathews, S. T.; Huggins, K. W.; Broderick, T. L.; Babu, J. R. Oxid. Med.
Cell. Longev. 2013, 2013, 1-7.
(45) Ha, S. K.; Chae, C. Exp. Anim. 2010, 59, 595-604.
(46) Suzuki, Y.; Kosaka, M.; Shindo, K.; Kawasumi, T.; Kimoto-Nira, H.; Suzuki, C. Biosci. Biotechnol. Biochem. 2013, 77, 1299-1302.
(47) Hwang, C. E.; An, M. J.; Lee, H. Y.; Lee, B. W.; Kim, H. Y.; Ko, J.
M.; Baek, I. Y.; Seo, W. T.; Cho, K. M. Korean J. Food Sci. Technol.
2014, 46, 556-565.
(48) Izumi, T.; Piskula, M. K.; Osawa, S.; Obata, A.; Tobe, K.; Saito, M.; Kataoka, S.; Kikuchi, M. J. Nutr. 2000, 130, 1695-1699.
(49) Choi, I.; Kim, Y.; Park, Y.; Seog, H.; Choi, H. Bio Factors 2007, 29, 105-112.
(50) Terpstra, A. H.; Javadi, M.; Beynen, A. C.; Kocsis, S.; Lankhorst, A. E.; Lemmens, A. G.; Mohede, I. C. J. Nutr. 2003, 133, 3181-3186.
Received October 26, 2016 Revised January 21, 2017 Accepted January 23, 2017