Imaging Findings of Common Benign Renal Tumors in the Era of Small Renal Masses: Differential Diagnosis from Small Renal Cell Carcinoma – Current Status and Future Perspectives
15
0
0
전체 글
(2) Woo et al.. they are the most commonly encountered SRMs that could be mistaken as RCC. Detailed description of the imaging findings of less common types of benign SRMs and the radiologic differentiation between subtypes of RCC are beyond the scope of this review. Finally, we introduce the role that percutaneous biopsy may play in the era of SRMs.. Imaging Findings of Common Benign Small Renal Masses Angiomyolipoma Angiomyolipoma is one of the most common benign solid renal neoplasms (1). AML is composed of blood vessels, smooth muscle, and adipose tissue (9). It occurs most often in the 4–6th decades, with preponderance in women (10). Radiologically, AML can be categorized into the more classic AML and AML with minimal fat (11). Diagnosing the more classic AML is not difficult, as it presents with gross fat, which is the pathologic hallmark of AML. Owing to this abundant fat component, AMLs show marked hyperechogenicity (usually as echogenic as the renal sinus fat) on ultrasound (US) with reference to the renal parenchyma (12, 13), and demonstrate areas of unenhanced attenuation measuring < -10 Hounsfield units (HU) on computed tomography (CT) (14). In addition, this fat content can be detected by using frequency selective fat suppression and chemical shift fat suppression (15, 16) on magnetic resonance imaging (MRI). In cases of small classic AML, the typical radiologic findings of US, CT, and MRI are all applicable. Yet, as the AML itself and the fat content is small, acquisition of thin sections (i.e., 1.5–3 mm) and measuring the attenuation with small regions of interest or even pixel values might be necessary to identify the fat content while avoiding partial volume averaging artifacts (14, 17, 18). However, it may be difficult to differentiate AML with minimal fat from RCC (19) as they both contain too little fat to be directly detected on an unenhanced CT. This type of AML is typically reported to be small with an average diameter of 3 cm (19-21). As a result, these AMLs are quite often misdiagnosed as RCC and are inadvertently removed surgically (1). Generally, AML with minimal fat is pathologically diagnosed as an AML that contains no more than 25% fat cells as visualized using high power field microscopy (12). Yet, despite the poor lipid content, many investigators have tried to find methods to identify AML with minimal fat as well as radiologically distinguish it from 100. RCC and have reported promising results (Table 1). US Findings of AML with Minimal Fat Traditionally, a hyperechoic renal mass on US without features of a hypoechoic rim or intratumoral cysts is considered typical for AML when compared with RCC (12). However, when it comes to small AML with minimal fat, there has been some controversy over the echogenicity of AMLs. Some have reported that they are homogeneously isoechoic (20, 21), whereas others found that they are hyperechoic (19) or only slightly hyperechoic (22). Most of these studies comparing the echogenicity of RCC and AML with minimal fat have been done on a subjective basis and are not dedicated studies of SRMs. On the other hand, Lee et al. (23) reported that measuring the relative echogenicity of the lesion at a picture archiving and communication system monitor with the renal cortex and sinus fat referenced as 0 and 100%, respectively, was useful in differentiating small AMLs from RCCs. While small AML with minimal fat (88%) demonstrated lesser relative echogenicity than classic AML (106.3%), it showed greater relative echogenicity compared with all subtypes (44.1%) of RCC (Fig. 1). Although, further validation may be needed, in our experience, we believe that comparing the relative echogenicity with that of sinus fat can be helpful in clinical practice. CT Findings of AML with Minimal Fat CT has been more meticulously studied with regard to small AML with minimal fat. One of the most representative findings of AML with minimal fat on CT is the extent of hyperattenuation compared with the renal parenchyma. It was found to be significantly more common in these AMLs (53%) than in RCCs (13%) (24). This finding has also been confirmed upon quantitative analysis with thresholds of > 38.5 HU and > 37 HU to differentiate small AML with minimal fat from RCC and non-clear cell type RCC, respectively, resulting insensitivities and specificities up to 91.7% and 76.4%, respectively (Fig. 2) (25-27). A different approach that has been thoroughly examined is attenuation measurement using histogram analysis on unenhanced CT. Although earlier studies reported promising results with a high specificity (100%) and positive predictive value (100%) (28), further research by different investigators led to the realization that pixel histogram analysis cannot reliably differentiate between AML with minimal fat and RCC, or at least between AML with minimal fat and clear cell RCC (29, 30). Korean J Radiol 16(1), Jan/Feb 2015. kjronline.org.
(3) Imaging Findings of Benign Small Renal Masses. Table 1. Imaging Findings of Small Angiomyolipoma with Minimal Fat Author (Reference). Imaging Finding. Modality. Comparison Sensitivity Specificity (Number/Mean Size [cm]) (%) (%). Hyperechogenicity on US Relative echogenicity > 56.8%. US. AMLmf (15/2.7) RCC (36/2.2). 80. 64. Kim et al. (24). High attenuation relative to adjacent renal parenchyma on unenhanced scan. CT. AMLmf (19/2.8) RCC (62/3.1). 53. 87. Woo et al. (25). Precontrast attenuation > 37 HU. CT. AMLmf (24/2.0) NCCRCC (55/2.2). 92. 76. Yang et al. (26). Precontrast attenuation > 38.5 HU. CT. AMLmf (33/2.8) RCC (102/3.7). 84. 82. Kim et al. (27). High attenuation on unenhanced scan. CT. AMLmf (48/NA) RCC (359/NA). 60. 88. Choi et al. (31). T2 SI ratio (tumor/spleen) < 92.5%. MRI. AMLmf (10/NA) RCC (57/NA). 90. 90. Sasiwimonphan et al. (32). T2 SI ratio (tumor/cortex) < 90%. MRI. AMLmf (10/2.1) RCC (71/2.4). 100. 58. Sasiwimonphan et al. (32). SI index > 20%. MRI. AMLmf (10/2.1) RCC (71/2.4). 33. 89. Kim et al. (35). SI index > 25% Tumor-to-spleen ratio < -32%. MRI. AMLmf (26/2.1) Non-AMLmf (29/2.2). 96 88. 93 97. Woo et al. (25). LSR > 1.29. CT. AMLmf (24/2.0) NCCRCC (55/2.2). 79. 84. Kim et al. (27). LSR > 1.13. CT. AMLmf (48/NA*) RCC (359/NA*). 94. 64. Verma et al. (38). Angular interface. MRI. AML[mf] (17[3]/NA) RCC (97/3.3). 76 [100]. 100. Kim et al. (39). Ice-cream cone sign. CT. AMLmf (18/1.6) RCC (135/2.0). 78. 84. Lee et al. (23) Hyperattenuation on precontrast CT. Low T2-weighted SI on MRI. Chemical shift MRI. Shape of renal mass on cross-sectional imaging. Note.— *Mean size of all renal masses (48 angiomyolipomas with minimal fat and 359 RCCs) = 2.4 cm. AML = angiomyolipoma, AMLmf = angiomyolipoma with minimal fat, CT = computed tomography, HU = Hounsfield unit, LSR = long-to-short axis ratio, MRI = magnetic resonance imaging, NA = none available, NCCRCC = non-clear cell renal cell carcinoma, RCC = renal cell carcinoma, SI = signal intensity, US = ultrasonography. MRI Findings of AML with Minimal Fat MRI is often a problem solving modality in equivocal cases. The most basic MRI finding of small AML with minimal fat with regard to differentiation from RCC is low T2-weighted imaging (T2WI) signal intensity (SI). The characteristic low T2WI SI is not only well appreciated on a qualitative basis but has also been quantitatively assessed in terms of the SI ratio of the renal mass to that of the background kidney (31, 32). Choi et al. (31) have used a criteria of T2WI SI ratio < 92.5% for predicting kjronline.org. Korean J Radiol 16(1), Jan/Feb 2015. small AML with minimal fat and reported a high sensitivity and specificity of 90% and 90.2%, respectively. More recently, it has been suggested that fat-suppressed T2WI may be more useful than T2WI without fat saturation when differentiating AML with minimal fat from other entities (33). Chemical shift MRI, or in other words, inand opposed-phased MRI, is also recognized as effective in differentiation of SRMs, especially in diagnosing AML with minimal fat. In general, the presence of the Indian ink artifact at the interval between the renal mass and kidney 101.
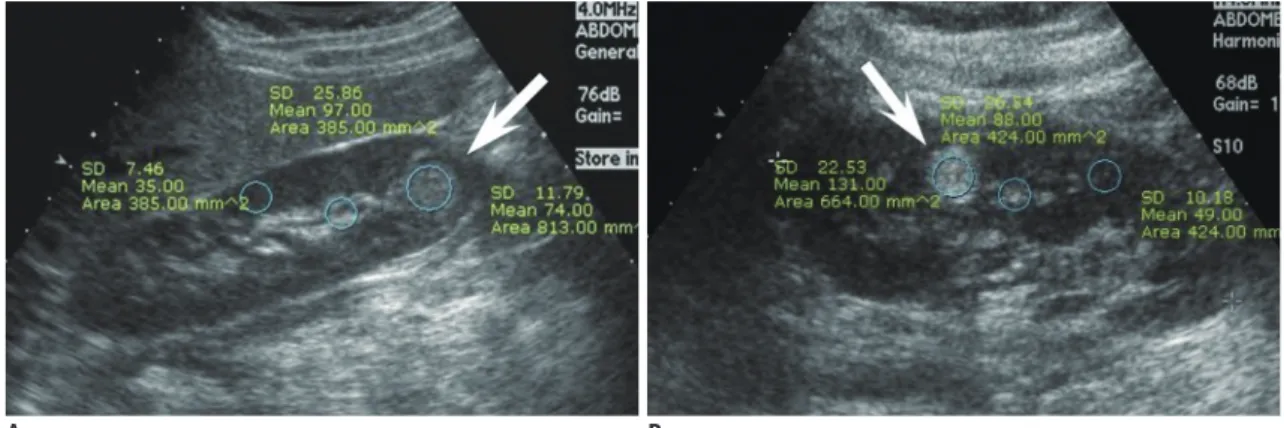
(4) Woo et al.. A B Fig. 1. Comparison of relative echogenicity between small renal cell carcinoma (RCC) and angiomyolipoma (AML) with minimal fat.. A. Mass (arrow) in right kidney lower pole in 43-year-old woman shows high echogenicity but less than that of sinus fat. Relative echogenicity ([echogenicity of mass - echogenicity of renal cortex] / [echogenicity of sinus fat - echogenicity of renal cortex]) was calculated as 0.63. Upon surgery, mass was confirmed as clear cell RCC. B. Mass (arrow) in left kidney interpolar in 38-year-old woman shows high echogenicity, even higher than that of sinus fat. Relative echogenicity was measured as 2.10. Mass was confirmed as AML with minimal fat at surgery.. or SI loss at opposed phase images within a renal mass can suggest the diagnosis of AML (16). Furthermore, chemical shift MRI has been reported to be able to detect fat even in cases of AML (with minimal fat) where CT failed to detect fatty tissue (34). Upon quantitative analysis, SI indices (the relative drop of SI from in- to opposed-phase) of 20–25% resulted in specificities of 90–93% in diagnosing small AML with minimal fat from non-AMLs (32, 35). Although MRI is often helpful in indeterminate cases on CT, some pitfalls should be noted when using certain methods such as the two above. In general (not limited to the SRMs), papillary RCCs also appear as T2WI low SI renal masses, and clear cell RCCs sometimes demonstrate loss of SI in the opposed phase due to intracytoplasmic fat, hindering diagnostic accuracy in determining AML with minimal fat (36, 37). Therefore, when interpreting MR examinations for characterization of SRMs, one should not rely on a single criterion, but rather comprehensively incorporate all given features, such as low T2WI SI, loss of SI at opposed phase images, and enhancement pattern. Apart from the abundant literature using CT and MRI in diagnosing small AML with minimal fat, a common crosssectional imaging feature may also aid in diagnostic confidence. Small AMLs with minimal fat are usually less rounded in shape compared with small RCC (Fig. 3). This is substantiated by several reports in the literature, which described small AML with minimal fat as having an angular interface with the renal parenchyma, demonstrating greater long-to-short axis ratio compared with RCC (> 1.13) or non-clear cell RCC (> 1.29). They were even characterized to resemble the morphology of an ice-cream cone (25, 27, 102. 38, 39). All these descriptions fundamentally imply that small AML with minimal fat are softer than RCC due to their composition of adipose tissue (minimal in the case of AML with minimal fat), smooth muscle, and blood vessels in AML unlike the compact cellular growth pattern in RCC (9, 40, 41). Several emerging technologies have been explored recently. Tan et al. (42) found that sonoelastography was able to differentiate small AML with minimal fat from RCC, with high interobserver concordance and accuracy. There also have been recent efforts using diffusion-weighted MR imaging (DWI) to diagnose AML with minimal fat (4345). Yet, the literature is still scarce, controversial, and do not specifically handle SRMs, warranting validation before clinical utilization. Oncocytoma Oncocytoma is the second most common benign renal cell neoplasm constituting approximately 5% of renal epithelial neoplasms based on surgical series (9). Oncocytoma is thought to originate from or to histologically differentiate towards the type A intercalated cells of the cortical collecting duct (46, 47). The incidence of oncocytoma peaks in the seventh decade, with a higher prevalence in men. Histopathologically, oncocytoma is organized with acini and nests of large polygonal cells and contains eosinophilic cytoplasm rich in mitochondria (9). A recent study of pathologically proven oncocytomas demonstrated that the mean growth rate of oncocytomas was 2.9 mm/year over 36 months, which is equivalent to the rate previously reported for RCCs and other small renal masses (48). Therefore, Korean J Radiol 16(1), Jan/Feb 2015. kjronline.org.
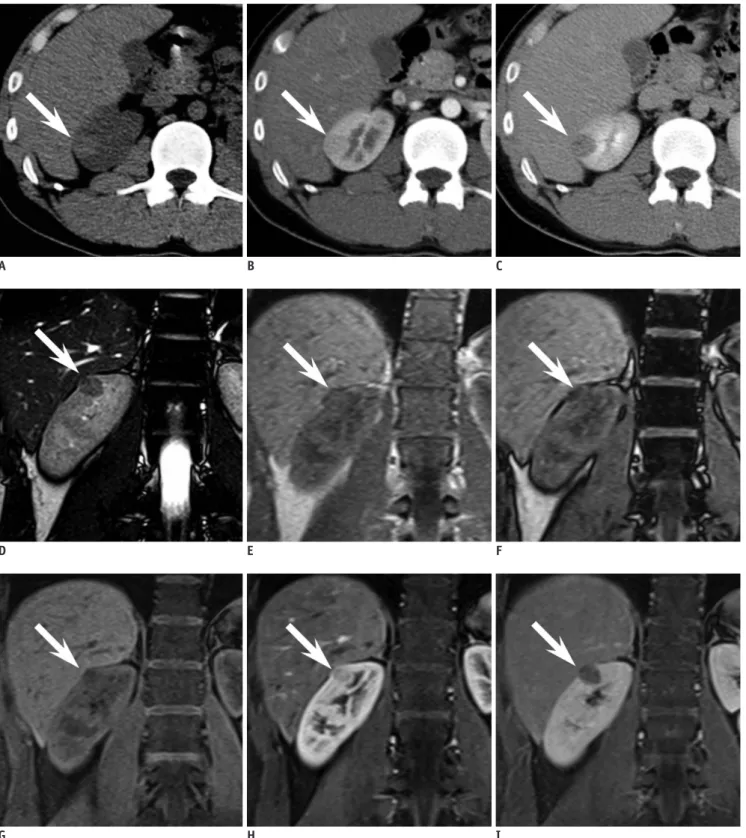
(5) Imaging Findings of Benign Small Renal Masses. A. B. C. D. E. F. G H I Fig. 2. 24-year-old man with small angiomyolipoma with minimal fat in right kidney demonstrating typical CT and MR findings.. A. Axial precontrast CT scan reveals oval shaped 1.8-cm sized hyperdense mass (arrow) in right kidney upper pole. At region of interest measurement, attenuation of mass was 51 Hounsfield units (HU) while renal parenchyma was measured as 39 HU. B, C. Axial corticomedullary phase (B) and early excretory phase (C) CT scan shows that mass (arrow) is less enhanced compared with renal parenchyma. D. Renal mass (arrow) demonstrates low signal intensity (SI) compared with renal parenchyma on coronal T2-weighted image. E, F. On coronal chemical shift MR imaging, suspicious focus (arrow) of SI drop from in phase (E) to opposed phase (F) is noted. G-I. Coronal contrast-enhanced MRI shows that mass (arrow) is less enhanced than background renal parenchyma.. kjronline.org. Korean J Radiol 16(1), Jan/Feb 2015. 103.
(6) Woo et al.. A B Fig. 3. 53-year-old man with small angiomyolipoma with minimal fat showing ice-cream cone appearance.. A. Small enhancing renal mass in left kidney anterior aspect is depicted on axial corticomedullary phase CT. Mass is composed of two portions, exophytic portion (arrow) with rounded appearance and intraparenchymal component (arrowhead) with wedge or triangular shape, resembling ice-cream cone. B. At sagittal early excretory phase CT, ice-cream cone appearance constituted with exophytic (arrow) and endophytic portions (arrowhead) of renal mass is again well demonstrated. Mass was diagnosed as angiomyolipoma with minimal fat at surgery.. surveillance may not be able to discriminate a small oncocytoma from a small RCC, and rather the radiologist, if possible, should suggest the possibility of oncocytoma when suspected on imaging. Imaging findings reported for small renal oncocytoma are summarized in Table 2. US Findings of Oncocytoma On US, small sized oncocytomas usually appear as homogeneous renal masses that are isoechoic with the echogenicity of the renal parenchyma with well-demarcated margins (49). Yet, small RCCs may also show similar characteristics in about 5–6% of cases (50). The spoke wheel or stellate scar appearance on US, which is a wellknown characteristic finding, is usually difficult to see in small oncocytomas. For instance, Goiney et al. (49) only found the central scar present in an oncocytoma sized 12 cm. This can be explained by the fact that the oncocytoma needs to enlarge and outstrip its blood supply leading to infarction hemorrhage and necrosis before organizing and healing to render the central scar. A spoke-wheel pattern of feeding arteries on angiography, though characteristic of oncocytoma, is again mostly seen in oncocytomas of larger sizes, and cannot be accurately used to diagnosis oncocytomas in the setting of SRMs (51). CT Findings of Oncocytoma On CT, small oncocytomas typically appear as solitary, 104. well-demarcated, homogeneously enhancing renal cortical tumors. Hemorrhage, calcification, necrosis, and central stellate scars are uncommon in oncocytomas in the setting of SRMs (51-54). Although these imaging findings of small oncocytomas overlap with RCC and may discourage efforts to differentiate between the two, fortunately, we have recognized that a phenomenon called “segmental enhancement inversion” could be helpful in such a situation. Segmental enhancement inversion (SEI) was defined as the following by Kim et al. (55): on contrastenhanced CT, renal mass demonstrates two distinct areas of differing degrees of enhancement in the corticomedullary phase, in which the degree of enhancement is inversed in the nephrographic phase (Fig. 4). In the first study introducing this finding of SEI, it was found to be a characteristic finding of small oncocytoma with 8 of 10 (80%) oncocytomas smaller than or equal to 4 cm showing SEI. In a subsequent study that analyzed the prevalence of SEI according to the size of oncocytomas, it was found that oncocytomas in the size range of 1.5–2.9 cm most commonly showed SEI (56). A possible explanation is that an extremely small size (< 1.5 cm) makes it difficult to segment the oncocytoma into more and less enhancing components, and that the increasing proportion of tumors with pathological features such as the stellate scar coincide with the decreased prevalence of SEI in oncocytomas with larger size (> 2.5 cm). Furthermore, SEI was found to be Korean J Radiol 16(1), Jan/Feb 2015. kjronline.org.
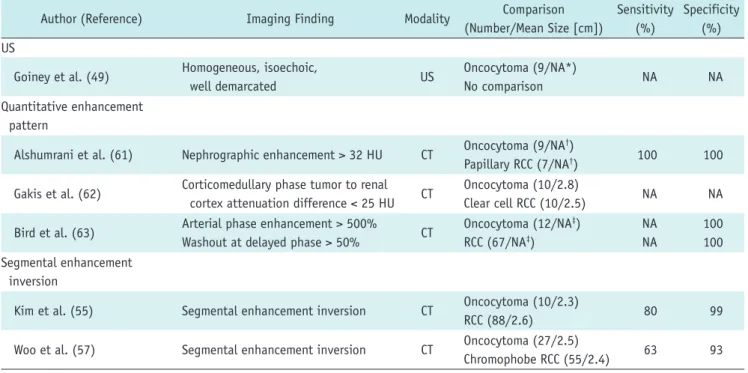
(7) Imaging Findings of Benign Small Renal Masses. significantly more common in small oncocytoma (63%) than in small chromphobe RCC (7.3%), which may be expected to manifest with similar imaging findings given their common histopathological backgrounds (57). Ever. since these preliminary results were reported, there has been some debate over the utility of this imaging finding (58, 59). For instance, McGahan et al. (58) found that only 1 out of 16 (6.3%) renal oncocytomas showed SEI. Possible. Table 2. Imaging Findings of Small Oncocytoma Author (Reference). Imaging Finding. Modality. Comparison (Number/Mean Size [cm]). Sensitivity Specificity (%) (%). US Homogeneous, isoechoic, well demarcated. US. Oncocytoma (9/NA*) No comparison. NA. NA. Alshumrani et al. (61). Nephrographic enhancement > 32 HU. CT. Oncocytoma (9/NA†) Papillary RCC (7/NA†). 100. 100. Gakis et al. (62). Corticomedullary phase tumor to renal cortex attenuation difference < 25 HU. CT. Oncocytoma (10/2.8) Clear cell RCC (10/2.5). NA. NA. Bird et al. (63). Arterial phase enhancement > 500% Washout at delayed phase > 50%. CT. Oncocytoma (12/NA‡) RCC (67/NA‡). NA NA. 100 100. Kim et al. (55). Segmental enhancement inversion. CT. Oncocytoma (10/2.3) RCC (88/2.6). 80. 99. Woo et al. (57). Segmental enhancement inversion. CT. Oncocytoma (27/2.5) Chromophobe RCC (55/2.4). 63. 93. Goiney et al. (49) Quantitative enhancement pattern. Segmental enhancement inversion. Note.— *All 9 oncocytomas sized < 5.5 cm, †Mean size of all renal masses (9 oncocytomas and 7 papillary RCCs) = 2.5 cm, ‡Mean size of all renal masses (12 oncocytomas and 67 RCCs) = 2.6 cm. CT = computed tomography, HU = Hounsfield unit, NA = none available, RCC = renal cell carcinoma, US = ultrasonography. A B Fig. 4. 44-year-old woman with small oncocytoma demonstrating segmental enhancement inversion.. A. On coronal corticomedullary phase CT, renal mass at right kidney upper pole can be segmented into two areas. Crescent-shaped area at right aspect (white arrow) is more enhanced compared with relatively round shaped portion (black arrow) with heterogeneous enhancement at left aspect. Note adjacent medulla (arrowhead) at lateral aspect of renal mass which is less enhanced compared with well enhancing portion of renal mass. B. On coronal early excretory phase CT, enhancement degree of aforementioned two segments of renal mass is reversed. While previously more enhanced right crescent-shaped area (white arrow) is now less enhanced, round portion at left aspect (black arrow) shows marked enhancement, consistent with segmental enhancement inversion. Note that corticomedullary phase hypodense area and early excretory phase hyperattenuating area (arrowhead) are not part of mass but adjacent medullary tissue.. kjronline.org. Korean J Radiol 16(1), Jan/Feb 2015. 105.
(8) Woo et al.. explanations for this discrepancy may be differences in the study population (i.e., tumor size), methods and the level of experience in recognizing SEI, as well as differences in the CT protocols (i.e., time delay after contrast injection for the corticomedullary and early excretory phases). Although the clinical usefulness of SEI may need further verification, it is indeed promising that specificity remains high throughout various reports (87–100%) according to a recent meta-analysis of SEI in diagnosing oncocytoma which has summarized the debate (60). Recent reports suggest that quantitative analysis of the enhancement pattern of SRMs may assist in identifying oncocytomas. Alshumrani et al. (61) reported that by using triphasic multidetector CT in a cohort of 47 small renal masses, they were able to distinguish oncocytomas from papillary RCCs using a threshold of 32 HU for absolute nephrographic enhancement. Furthermore, Gakis et al. (62) found that the corticomedullary phase was the best phase to differentiate between small oncocytoma and clear cell RCC. In their study, small oncocytomas were more isoattenuating to the normal renal cortex, whereas clear cell RCCs were more hyperenhancing. However, Bird et al. (63) demonstrated that on 4-phase contrast-enhanced CT, oncocytomas showed higher enhancement than clear cell RCCs with arterial phase enhancement greater than 500% and washout values greater than 50%, in which the latter was exclusively seen in oncocytomas. Such discrepancy in quantitative measurements of enhancement degrees are speculated to arise from different CT protocols, and however promising they seem to be, more standardized protocols are needed for direct comparison between studies, and to establish the role of quantitative analysis of the enhancement pattern for diagnosing small renal oncocytoma. MRI Findings of Oncocytoma MRI has also been evaluated for its value in diagnosing oncocytoma; however, the literature is sparse with respect to small renal oncocytoma. Rosenkrantz et al. (64) compared an array of MR imaging features between oncocytoma and chromophobe RCC and none of the evaluated features of microscopic fat, hemorrhage, cysts, infiltrative margins, perinephric fat invasion, renal vein invasion, enhancement homogeneity, hypervascularity, central scar, and SEI were significantly different. Rather, both entities appeared as localized well-circumscribed masses, more hypovascular than the renal cortex, with low prevalence of features of 106. cysts, microscopic lipid, hemorrhage, and hemosiderin. However, other studies suggested that oncocytomas can be identified with high specificity (65, 66). Cornelis et al. (65) reported that SEI of the central area was observed in 74% of oncocytomas and in 12% of RCCs. And when they used a combination of SEI and SI index < 2% or tumor-to-spleen ratio > -6%, they were able to diagnose oncocytoma with a sensitivity of 36–55% and specificity of 95–97%. This group took their investigations further and investigated whether the use of multiparameteric MR, including doubleecho chemical shift, dynamic contrast-enhanced T1weighted and T2-weighted images and apparent diffusion coefficient (ADC) maps with the corresponding SI index, tumor-to-spleen SI ratio, ADC ratio, wash-in and washout indices between different phases could be of further value (66). Using these parameters, oncocytomas were distinguished from chromophobe and clear cell RCCs with a specificity of 100% and 94.2%, respectively. More recently, advanced MR techniques such as arterial spin labeling (ASL) and DWI have emerged. Lanzman et al. (67) demonstrated that oncocytomas showed higher levels of mean perfusion on ASL MR imaging when compared with all subtypes of RCC, including the clear cell, papillary, chromophobe, and unclassified types. This is similar to the finding of Bird et al. (63) indicating that the degree of arterial enhancement was greater in oncocytomas compared with clear cell RCC using 4-phase contrast enhanced CT. Regarding DWI, a recent meta-analysis which reviewed the ADC values for different renal lesions, identified that not only could ADC values (x 10-3 mm2/s) help generally discriminate between benign and malignant lesions, but they were also able to help differentiate oncocytomas (2.00 ± 0.08) from RCCs (1.61 ± 0.08) (68). Despite these promising results using MRI, the majority of the investigators did not limit their study population to small renal masses, and one should take caution in applying these results, especially when dealing with small renal oncocytomas (64-68). Although most oncocytomas are solitary, patients may present with bilateral, multicentric oncocytomas in hereditary syndromes such as renal oncocytosis and BirtHogg-Dubé syndrome. Oncocytomas can also manifest as hybrid or collision tumors with chromophobes or even other types of RCC (69, 70). In these cases, differentiation between small oncocytomas and RCCs may become more problematic.. Korean J Radiol 16(1), Jan/Feb 2015. kjronline.org.
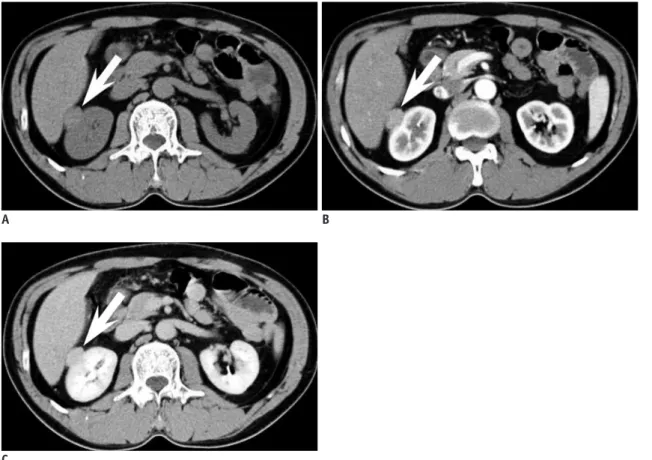
(9) Imaging Findings of Benign Small Renal Masses. Imaging Findings of Other Benign Renal Tumors. adenoma presents as a well-demarcated, round, solid mass on imaging studies (71). On US, it appears as an expansile mass with either hypo- or hyperechogenicity (72). On CT, it appears as a hyperdense mass in relation to adjacent renal parenchyma on precontrast images with weak enhancement (73). These imaging findings overlap with malignant renal tumors such as Wilms tumor and hypovascular renal cell carcinoma (Fig. 5). Calcification is found in 20% of cases. On MR, it shows as hypointense SI on T1-weighted images and slightly hyperintense SI on T2-weighted images (74).. Benign renal tumors other than the common AML and oncocytoma include metanephric adenoma, leiomyoma, reninoma, solitary fibrous tumor, schwannoma, and inflammatory pseudotumors which may mimic RCC, usually the non-clear cell type. In the setting of SRMs, discriminating these tumors from small RCC based on imaging is usually impossible, due to the overlap of radiological findings and the rare incidence, and also because the imaging findings of these rare benign renal tumors have not been well established. The following is a brief orientation of the findings of a few representative benign renal tumors.. Leiomyoma Renal leiomyoma is a rare benign tumor arising from the smooth muscle (9). It is usually detected in adults as an incidental finding. Renal capsule is the most common site of leiomyoma, but it can also develop from the renal pelvis or cortex, albeit very rarely (75). Renal leiomyoma commonly appears as a well-circumscribed, homogeneous, exophytic hyperattenuating solid mass showing. Metanephric Adenoma Metanephric adenoma is a rare benign renal tumor which usually occurs in the fifth to sixth decade and is two times more common in females than in males (9). Metanephric. A. B. C Fig. 5. 33-year-old woman with small metanephric adenoma.. A. Mass at right kidney upper pole is slightly more hyperdense (arrow) than renal parenchyma at axial precontrast CT. B, C. Mass (arrow) is poorly enhancing compared with renal parenchyma at axial corticomedullary phase (B) and early excretory phase (C). Mass was confirmed as metanephric adenoma upon surgical resection.. kjronline.org. Korean J Radiol 16(1), Jan/Feb 2015. 107.
(10) Woo et al.. Role of Percutaneous Biopsy in the Era of Small Renal Masses. homogeneous enhancement on contrast-enhanced CT (76). Heterogeneous features due to hemorrhage and cystic or myxoid degeneration are rare when leiomyomas are small (77). At MRI, leiomyoma typically has homogeneously low SI on T1- and T2-weighted images (Fig. 6) (78).. It is ironic that while there are so many reports demonstrating the high accuracy and efficacy of imaging studies, especially cross-sectional studies such as CT and MRI, the majority of these studies are based on surgical specimens of benign and malignant SRMs. Remzi et al. (83) reported that only 17% of all benign renal masses were correctly diagnosed at preoperative CT, yet 43% of these patients underwent overtreatment, such as radical nephrectomy. In another study, Frank et al. (6) found that this was the case in 65% of 376 benign renal masses. Surgical data have been especially consistent in demonstrating that the smaller the size of a solid renal mass, the higher the probability of it being a benign lesion (6, 84, 85). Among these unnecessarily resected benign renal masses, the most common include AML with minimal fat and oncocytoma, while the more rare entities would be metanephric adenoma, papillary adenoma, and leiomyoma. As these SRMs have historically undergone unnecessary. Juxtaglomerular Cell Tumor Juxtaglomerular cell (JGC) tumor, also known as reninoma, is an extremely rare, benign renal tumor of myoendocrine cell origin (79). Almost all cases occur in the second and third decades with 2:1 female preponderance. With regard to diagnosing JGC tumor, the clinically setting is of utmost importance. A patient with JGC tumor typically manifests with a triad of poorly controlled hypertension, hypokalemia, and high plasma renin activity (80). At imaging, JGC tumors classically appear as a unilateral, well-marginated, cortical tumor smaller than 3 cm (81). JGC tumors usually appear hypovascular with delayed enhancement on contrast-enhanced CT and MRI despite its profuse vascularity (Fig. 7). This is speculated to be due to renin-induced vasoconstriction (82).. A. B. C Fig. 6. 43-year-old woman with small renal leiomyoma.. A. Renal mass (arrow) is located at right kidney capsular area abutting right hemiliver. On axial precontrast CT scan, mass is hyperdense in comparison with renal parenchyma. B, C. Axial corticomedullary (B) and early excretory phase (C) CT reveals that renal mass (arrow) is homogeneously enhanced. Renal mass was diagnosed as leiomyoma after surgery.. 108. Korean J Radiol 16(1), Jan/Feb 2015. kjronline.org.
(11) Imaging Findings of Benign Small Renal Masses. A. B. C Fig. 7. 23-year-old woman with small juxtaglomerular cell tumor and underlying hypertension.. A. Power Doppler ultrasound demonstrates renal mass (arrow) with poor vascularity. B, C. Axial corticomedullary (B) and nephrographic (C) CT shows same mass (arrow) without prominent enhancement in right kidney. At surgery, mass was confirmed as juxtaglomerular cell tumor.. surgery, it could be suggested that biopsy should be done before deciding whether the patient should undergo invasive management (operation) or not in certain circumstances. We do not believe that there is a clear cut indication for performing a biopsy on all small renal masses, nor do we have a set of criteria to choose whom and what tumor will require biopsy. This remains an important clinical question to be solved. Yet it is undisputed that recent advances in the acquisition and interpretation of biopsy specimens from SRMs have had a crucial impact. In general, the kjronline.org. Korean J Radiol 16(1), Jan/Feb 2015. sensitivity and specificity of biopsy (regardless of needle size or whether cytological, histological analysis or both were performed) in renal masses is reported to be 80–92% and 83–100%, respectively (86). When stratified to tumor size, the literature indicates that SRMs, in comparison to larger tumors, may be more difficult to diagnose based on percutaneous biopsy. Rybicki et al. (87) reported a sensitivity and negative predictive value of 84% and 60%, respectively, for renal masses smaller than 4 cm, while these values were 97% and 89%, respectively, for those between 109.
(12) Woo et al.. 4 and 6 cm in size. This is generally thought to be due to difficulty targeting the mass, especially in renal masses smaller than 1 cm in diameter (88). Although we routinely use an 18-gauge biopsy needle at our institution, recent studies suggest that fine (20-gauge or thinner) needles are sufficient to obtain specimens to make an accurate diagnosis (89, 90). Especially, there has been improvement in cytological techniques, including immunocytochemical staining and cytogenetic studies that have led to more accurate diagnoses. The advanced techniques have improved not only differentiation of benign and malignant renal tumors, but can also be helpful in determination of renal cell carcinoma subtypes and Fuhrman nuclear grades (91-95). One important concern regarding percutaneous biopsy of SRMs is needle track seeding in case the SRM is malignant. However, the paucity of such events in the literature suggests that it is a truly rare phenomenon with an estimated incidence of less than 0.01% of cases (96). In addition, there is no evidence to suggest any relationship between needle size and the risk of track seeding (97). The only deterrent to biopsy would be when the SRM is suspected to be transitional cell carcinoma, as some consider these tumors to have a greater risk of seeding than RCCs (98, 99). Although radiological imaging has been the primary tool to evaluate SRMs, imaging alone may not be able to obviate surgery for all benign SRMs. We believe that percutaneous biopsy will play a crucial role in determining the optimal management of patients with SRM. Still, consensus on when and how percutaneous biopsy should be performed for SRMs will need to be validated in the future.. CONCLUSION Small renal masses are being detected more frequently due to the increased use of cross-sectional imaging studies. As a significant portion of these SRMs are benign, it is crucial that the radiologist recognize the imaging features of SRMs so that the patient may undergo appropriate management. Several characteristic imaging features of common benign SRMs, such as AML with minimal fat and oncocytoma, are currently well established in the literature, with many more promising results using conventional or advanced imaging techniques on the way. Small-sized rare benign renal tumors, including metanephric adenoma, leiomyoma, and JGC tumor, cannot be accurately diagnosed or differentiated from small RCC, especially non-clear cell 110. type RCCs based on radiologic studies alone. However, clues should be obtained from the clinical setting, such as the age, sex, symptom, and location of the tumor, and in certain circumstances, percutaneous biopsy will be required to confirm the benignity of the SRM to obviate unnecessary surgery.. REFERENCES 1. Silverman SG, Israel GM, Herts BR, Richie JP. Management of the incidental renal mass. Radiology 2008;249:16-31 2. Gill IS, Aron M, Gervais DA, Jewett MA. Clinical practice. Small renal mass. N Engl J Med 2010;362:624-634 3. Chow WH, Dong LM, Devesa SS. Epidemiology and risk factors for kidney cancer. Nat Rev Urol 2010;7:245-257 4. Reis LAG, Melbert D, Krapcho M, Stinchcomb DG, Howlader N, Horner MJ, et al. SEER Cancer Statistics Review, 1975-2007. Bethesda, MD: National Cancer Institute, 2008 5. Rioux-Leclercq N, Karakiewicz PI, Trinh QD, Ficarra V, Cindolo L, de la Taille A, et al. Prognostic ability of simplified nuclear grading of renal cell carcinoma. Cancer 2007;109:868-874 6. Frank I, Blute ML, Cheville JC, Lohse CM, Weaver AL, Zincke H. Solid renal tumors: an analysis of pathological features related to tumor size. J Urol 2003;170(6 Pt 1):2217-2220 7. Thompson RH, Kurta JM, Kaag M, Tickoo SK, Kundu S, Katz D, et al. Tumor size is associated with malignant potential in renal cell carcinoma cases. J Urol 2009;181:2033-2036 8. Sivalingam S, Nakada SY. Contemporary minimally invasive treatment options for renal angiomyolipomas. Curr Urol Rep 2013;14:147-153 9. Eble JN, Sauter G, Epstein JI, Sesterhenn IA. World Health Organization Classification of Tumors. Pathology and genetics of tumors of the Urinary System and Male Genital Organs. Lyon: IARC Press, 2004:65-66 10. Tamboli P, Ro JY, Amin MB, Ligato S, Ayala AG. Benign tumors and tumor-like lesions of the adult kidney. Part II: benign mesenchymal and mixed neoplasms, and tumor-like lesions. Adv Anat Pathol 2000;7:47-66 11. Lane BR, Aydin H, Danforth TL, Zhou M, Remer EM, Novick AC, et al. Clinical correlates of renal angiomyolipoma subtypes in 209 patients: classic, fat poor, tuberous sclerosis associated and epithelioid. J Urol 2008;180:836-843 12. Siegel CL, Middleton WD, Teefey SA, McClennan BL. Angiomyolipoma and renal cell carcinoma: US differentiation. Radiology 1996;198:789-793 13. Jinzaki M, Ohkuma K, Tanimoto A, Mukai M, Hiramatsu K, Murai M, et al. Small solid renal lesions: usefulness of power Doppler US. Radiology 1998;209:543-550 14. Bosniak MA, Megibow AJ, Hulnick DH, Horii S, Raghavendra BN. CT diagnosis of renal angiomyolipoma: the importance of detecting small amounts of fat. AJR Am J Roentgenol 1988;151:497-501 15. Lemaitre L, Claudon M, Dubrulle F, Mazeman E. Imaging of. Korean J Radiol 16(1), Jan/Feb 2015. kjronline.org.
(13) Imaging Findings of Benign Small Renal Masses. angiomyolipomas. Semin Ultrasound CT MR 1997;18:100-114 16. Israel GM, Hindman N, Hecht E, Krinsky G. The use of opposed-phase chemical shift MRI in the diagnosis of renal angiomyolipomas. AJR Am J Roentgenol 2005;184:1868-1872 17. Takahashi K, Honda M, Okubo RS, Hyodo H, Takakusaki H, Yokoyama H, et al. CT pixel mapping in the diagnosis of small angiomyolipomas of the kidneys. J Comput Assist Tomogr 1993;17:98-101 18. Kurosaki Y, Tanaka Y, Kuramoto K, Itai Y. Improved CT fat detection in small kidney angiomyolipomas using thin sections and single voxel measurements. J Comput Assist Tomogr 1993;17:745-748 19. Hafron J, Fogarty JD, Hoenig DM, Li M, Berkenblit R, Ghavamian R. Imaging characteristics of minimal fat renal angiomyolipoma with histologic correlations. Urology 2005;66:1155-1159 20. Jinzaki M, Tanimoto A, Narimatsu Y, Ohkuma K, Kurata T, Shinmoto H, et al. Angiomyolipoma: imaging findings in lesions with minimal fat. Radiology 1997;205:497-502 21. Trigaux JP, Pauls C, Van Beers B. Atypical renal hamartomas: ultrasonography, computed tomography, and angiographic findings. J Clin Ultrasound 1993;21:41-44 22. Jinzaki M, Silverman SG, Akita H, Nagashima Y, Mikami S, Oya M. Renal angiomyolipoma: a radiological classification and update on recent developments in diagnosis and management. Abdom Imaging 2014;39:588-604 23. Lee MS, Cho JY, Kim SH. Ultrasonographic differentiation of small angiomyolipoma from renal cell carcinoma by measuring relative echogenicity on PACS. J Korean Soc Ultrasound Med 2010;29:105-113 24. Kim JK, Park SY, Shon JH, Cho KS. Angiomyolipoma with minimal fat: differentiation from renal cell carcinoma at biphasic helical CT. Radiology 2004;230:677-684 25. Woo S, Cho JY, Kim SH, Kim SY. Angiomyolipoma with minimal fat and non-clear cell renal cell carcinoma: differentiation on MDCT using classification and regression tree analysis-based algorithm. Acta Radiol 2014;55:1258-1269 26. Yang CW, Shen SH, Chang YH, Chung HJ, Wang JH, Lin AT, et al. Are there useful CT features to differentiate renal cell carcinoma from lipid-poor renal angiomyolipoma? AJR Am J Roentgenol 2013;201:1017-1028 27. Kim MH, Lee J, Cho G, Cho KS, Kim J, Kim JK. MDCTbased scoring system for differentiating angiomyolipoma with minimal fat from renal cell carcinoma. Acta Radiol 2013;54:1201-1209 28. Simpfendorfer C, Herts BR, Motta-Ramirez GA, Lockwood DS, Zhou M, Leiber M, et al. Angiomyolipoma with minimal fat on MDCT: can counts of negative-attenuation pixels aid diagnosis? AJR Am J Roentgenol 2009;192:438-443 29. Chaudhry HS, Davenport MS, Nieman CM, Ho LM, Neville AM. Histogram analysis of small solid renal masses: differentiating minimal fat angiomyolipoma from renal cell carcinoma. AJR Am J Roentgenol 2012;198:377-383 30. Catalano OA, Samir AE, Sahani DV, Hahn PF. Pixel distribution analysis: can it be used to distinguish clear cell carcinomas. kjronline.org. Korean J Radiol 16(1), Jan/Feb 2015. from angiomyolipomas with minimal fat? Radiology 2008;247:738-746 31. Choi HJ, Kim JK, Ahn H, Kim CS, Kim MH, Cho KS. Value of T2-weighted MR imaging in differentiating low-fat renal angiomyolipomas from other renal tumors. Acta Radiol 2011;52:349-353 32. Sasiwimonphan K, Takahashi N, Leibovich BC, Carter RE, Atwell TD, Kawashima A. Small (<4 cm) renal mass: differentiation of angiomyolipoma without visible fat from renal cell carcinoma utilizing MR imaging. Radiology 2012;263:160-168 33. Chung MS, Choi HJ, Kim MH, Cho KS. Comparison of T2weighted MRI with and without fat suppression for differentiating renal angiomyolipomas without visible fat from other renal tumors. AJR Am J Roentgenol 2014;202:765-771 34. Kido T, Yamashita Y, Sumi S, Baba Y, Takahashi M, Ootsuka Y, et al. Chemical shift GRE MRI of renal angiomyolipoma. J Comput Assist Tomogr 1997;21:268-270 35. Kim JK, Kim SH, Jang YJ, Ahn H, Kim CS, Park H, et al. Renal angiomyolipoma with minimal fat: differentiation from other neoplasms at double-echo chemical shift FLASH MR imaging. Radiology 2006;239:174-180 36. Hindman N, Ngo L, Genega EM, Melamed J, Wei J, Braza JM, et al. Angiomyolipoma with minimal fat: can it be differentiated from clear cell renal cell carcinoma by using standard MR techniques? Radiology 2012;265:468-477 37. Oliva MR, Glickman JN, Zou KH, Teo SY, Mortelé KJ, Rocha MS, et al. Renal cell carcinoma: t1 and t2 signal intensity characteristics of papillary and clear cell types correlated with pathology. AJR Am J Roentgenol 2009;192:1524-1530 38. Verma SK, Mitchell DG, Yang R, Roth CG, O’Kane P, Verma M, et al. Exophytic renal masses: angular interface with renal parenchyma for distinguishing benign from malignant lesions at MR imaging. Radiology 2010;255:501-507 39. Kim KH, Yun BH, Jung SI, Hwang IS, Hwang EC, Kang TW, et al. Usefulness of the ice-cream cone pattern in computed tomography for prediction of angiomyolipoma in patients with a small renal mass. Korean J Urol 2013;54:504-509 40. van den Berg E, Dijkhuizen T, Oosterhuis JW, Geurts van Kessel A, de Jong B, Störkel S. Cytogenetic classification of renal cell cancer. Cancer Genet Cytogenet 1997;95:103-107 41. Amin MB, Corless CL, Renshaw AA, Tickoo SK, Kubus J, Schultz DS. Papillary (chromophil) renal cell carcinoma: histomorphologic characteristics and evaluation of conventional pathologic prognostic parameters in 62 cases. Am J Surg Pathol 1997;21:621-635 42. Tan S, Özcan MF, Tezcan F, Balci S, Karaog˘lanog˘lu M, Huddam B, et al. Real-time elastography for distinguishing angiomyolipoma from renal cell carcinoma: preliminary observations. AJR Am J Roentgenol 2013;200:W369-W375 43. Tanaka H, Yoshida S, Fujii Y, Ishii C, Tanaka H, Koga F, et al. Diffusion-weighted magnetic resonance imaging in the differentiation of angiomyolipoma with minimal fat from clear cell renal cell carcinoma. Int J Urol 2011;18:727-730 44. Sasamori H, Saiki M, Suyama J, Ohgiya Y, Hirose M, Gokan T.. 111.
(14) Woo et al.. Utility of apparent diffusion coefficients in the evaluation of solid renal tumors at 3T. Magn Reson Med Sci 2014;13:89-95 45. Agnello F, Roy C, Bazille G, Galia M, Midiri M, Charles T, et al. Small solid renal masses: characterization by diffusionweighted MRI at 3 T. Clin Radiol 2013;68:e301-e308 46. Störkel S, Pannen B, Thoenes W, Steart PV, Wagner S, Drenckhahn D. Intercalated cells as a probable source for the development of renal oncocytoma. Virchows Arch B Cell Pathol Incl Mol Pathol 1988;56:185-189 47. Geramizadeh B, Ravanshad M, Rahsaz M. Useful markers for differential diagnosis of oncocytoma, chromophobe renal cell carcinoma and conventional renal cell carcinoma. Indian J Pathol Microbiol 2008;51:167-171 48. Kurup AN, Thompson RH, Leibovich BC, Harmsen WS, Sebo TJ, Callstrom MR, et al. Renal oncocytoma growth rates before intervention. BJU Int 2012;110:1444-1448 49. Goiney RC, Goldenberg L, Cooperberg PL, Charboneau JW, Rosenfield AT, Russin LD, et al. Renal oncocytoma: sonographic analysis of 14 cases. AJR Am J Roentgenol 1984;143:1001-1004 50. Charboneau JW, Hattery RR, Ernst EC 3rd, James EM, Williamson B Jr, Hartman GW. Spectrum of sonographic findings in 125 renal masses other than benign simple cyst. AJR Am J Roentgenol 1983;140:87-94 51. Quinn MJ, Hartman DS, Friedman AC, Sherman JL, Lautin EM, Pyatt RS, et al. Renal oncocytoma: new observations. Radiology 1984;153:49-53 52. Jasinski RW, Amendola MA, Glazer GM, Bree RL, Gikas PW. Computed tomography of renal oncocytomas. Comput Radiol 1985;9:307-314 53. Ambos MA, Bosniak MA, Valensi QJ, Madayag MA, Lefleur RS. Angiographic patterns in renal oncocytomas. Radiology 1978;129:615-622 54. Davidson AJ, Hayes WS, Hartman DS, McCarthy WF, Davis CJ Jr. Renal oncocytoma and carcinoma: failure of differentiation with CT. Radiology 1993;186:693-696 55. Kim JI, Cho JY, Moon KC, Lee HJ, Kim SH. Segmental enhancement inversion at biphasic multidetector CT: characteristic finding of small renal oncocytoma. Radiology 2009;252:441-448 56. Woo S, Cho JY, Kim SH, Kim SY, Lee HJ, Hwang SI, et al. Segmental enhancement inversion of small renal oncocytoma: differences in prevalence according to tumor size. AJR Am J Roentgenol 2013;200:1054-1059 57. Woo S, Cho JY, Kim SH, Kim SY. Comparison of segmental enhancement inversion on biphasic MDCT between small renal oncocytomas and chromophobe renal cell carcinomas. AJR Am J Roentgenol 2013;201:598-604 58. McGahan JP, Lamba R, Fisher J, Starshak P, Ramsamooj R, Fitzgerald E, et al. Is segmental enhancement inversion on enhanced biphasic MDCT a reliable sign for the noninvasive diagnosis of renal oncocytomas? AJR Am J Roentgenol 2011;197:W674-W679 59. O’Malley ME, Tran P, Hanbidge A, Rogalla P. Small renal oncocytomas: is segmental enhancement inversion a. 112. characteristic finding at biphasic MDCT? AJR Am J Roentgenol 2012;199:1312-1315 60. Schieda N, McInnes MD, Cao L. Diagnostic accuracy of segmental enhancement inversion for diagnosis of renal oncocytoma at biphasic contrast enhanced CT: systematic review. Eur Radiol 2014;24:1421-1429 61. Alshumrani G, O’Malley M, Ghai S, Metser U, Kachura J, Finelli A, et al. Small (< or = 4 cm) cortical renal tumors: characterization with multidetector CT. Abdom Imaging 2010;35:488-493 62. Gakis G, Kramer U, Schilling D, Kruck S, Stenzl A, Schlemmer HP. Small renal oncocytomas: differentiation with multiphase CT. Eur J Radiol 2011;80:274-278 63. Bird VG, Kanagarajah P, Morillo G, Caruso DJ, Ayyathurai R, Leveillee R, et al. Differentiation of oncocytoma and renal cell carcinoma in small renal masses (<4 cm): the role of 4-phase computerized tomography. World J Urol 2011;29:787-792 64. Rosenkrantz AB, Hindman N, Fitzgerald EF, Niver BE, Melamed J, Babb JS. MRI features of renal oncocytoma and chromophobe renal cell carcinoma. AJR Am J Roentgenol 2010;195:W421-W427 65. Cornelis F, Lasserre AS, Tourdias T, Deminière C, Ferrière JM, Le Bras Y, et al. Combined late gadolinium-enhanced and double-echo chemical-shift MRI help to differentiate renal oncocytomas with high central T2 signal intensity from renal cell carcinomas. AJR Am J Roentgenol 2013;200:830-838 66. Cornelis F, Tricaud E, Lasserre AS, Petitpierre F, Bernhard JC, Le Bras Y, et al. Routinely performed multiparametric magnetic resonance imaging helps to differentiate common subtypes of renal tumours. Eur Radiol 2014;24:1068-1080 67. Lanzman RS, Robson PM, Sun MR, Patel AD, Mentore K, Wagner AA, et al. Arterial spin-labeling MR imaging of renal masses: correlation with histopathologic findings. Radiology 2012;265:799-808 68. Lassel EA, Rao R, Schwenke C, Schoenberg SO, Michaely HJ. Diffusion-weighted imaging of focal renal lesions: a metaanalysis. Eur Radiol 2014;24:241-249 69. Choyke PL. Imaging of hereditary renal cancer. Radiol Clin North Am 2003;41:1037-1051 70. Rowsell C, Fleshner N, Marrano P, Squire J, Evans A. Papillary renal cell carcinoma within a renal oncocytoma: case report of an incidental finding of a tumour within a tumour. J Clin Pathol 2007;60:426-428 71. Davis CJ Jr, Barton JH, Sesterhenn IA, Mostofi FK. Metanephric adenoma. Clinicopathological study of fifty patients. Am J Surg Pathol 1995;19:1101-1114 72. Patankar T, Punekar S, Madiwale C, Prasad S, Hanchate V. Metanephric adenoma in a solitary kidney. Br J Radiol 1999;72:80-81 73. Fielding JR, Visweswaran A, Silverman SG, Granter SR, Renshaw AA. CT and ultrasound features of metanephric adenoma in adults with pathologic correlation. J Comput Assist Tomogr 1999;23:441-444 74. Araki T, Hata H, Asakawa E, Araki T. MRI of metanephric adenoma. J Comput Assist Tomogr 1998;22:87-90 Korean J Radiol 16(1), Jan/Feb 2015. kjronline.org.
(15) Imaging Findings of Benign Small Renal Masses. 75. Prasad SR, Surabhi VR, Menias CO, Raut AA, Chintapalli KN. Benign renal neoplasms in adults: cross-sectional imaging findings. AJR Am J Roentgenol 2008;190:158-164 76. Katabathina VS, Vikram R, Nagar AM, Tamboli P, Menias CO, Prasad SR. Mesenchymal neoplasms of the kidney in adults: imaging spectrum with radiologic-pathologic correlation. Radiographics 2010;30:1525-1540 77. Steiner M, Quinlan D, Goldman SM, Millmond S, Hallowell MJ, Stutzman RE, et al. Leiomyoma of the kidney: presentation of 4 new cases and the role of computerized tomography. J Urol 1990;143:994-998 78. Radvany MG, Shanley DJ, Gagliardi JA. Magnetic resonance imaging with computed tomography of a renal leiomyoma. Abdom Imaging 1994;19:67-69 79. Martin SA, Mynderse LA, Lager DJ, Cheville JC. Juxtaglomerular cell tumor: a clinicopathologic study of four cases and review of the literature. Am J Clin Pathol 2001;116:854-863 80. Conn JW, Cohen EL, Lucas CP, McDonald WJ, Mayor GH, Blough WM Jr, et al. Primary reninism. Hypertension, hyperreninemia, and secondary aldosteronism due to renin-producing juxtaglomerular cell tumors. Arch Intern Med 1972;130:682696 81. Prasad SR, Narra VR, Shah R, Humphrey PA, Jagirdar J, Catena JR, et al. Segmental disorders of the nephron: histopathological and imaging perspective. Br J Radiol 2007;80:593-602 82. Dunnick NR, Hartman DS, Ford KK, Davis CJ Jr, Amis ES Jr. The radiology of juxtaglomerular tumors. Radiology 1983;147:321326 83. Remzi M, Katzenbeisser D, Waldert M, Klingler HC, Susani M, Memarsadeghi M, et al. Renal tumour size measured radiologically before surgery is an unreliable variable for predicting histopathological features: benign tumours are not necessarily small. BJU Int 2007;99:1002-1006 84. Duchene DA, Lotan Y, Cadeddu JA, Sagalowsky AI, Koeneman KS. Histopathology of surgically managed renal tumors: analysis of a contemporary series. Urology 2003;62:827-830 85. Silver DA, Morash C, Brenner P, Campbell S, Russo P. Pathologic findings at the time of nephrectomy for renal mass. Ann Surg Oncol 1997;4:570-574 86. Herts BR, Baker ME. The current role of percutaneous biopsy in the evaluation of renal masses. Semin Urol Oncol. kjronline.org. Korean J Radiol 16(1), Jan/Feb 2015. 1995;13:254-261 87. Rybicki FJ, Shu KM, Cibas ES, Fielding JR, vanSonnenberg E, Silverman SG. Percutaneous biopsy of renal masses: sensitivity and negative predictive value stratified by clinical setting and size of masses. AJR Am J Roentgenol 2003;180:1281-1287 88. Sahni VA, Silverman SG. Biopsy of renal masses: when and why. Cancer Imaging 2009;9:44-55 89. Helm CW, Burwood RJ, Harrison NW, Melcher DH. Aspiration cytology of solid renal tumours. Br J Urol 1983;55:249-253 90. Murphy WM, Zambroni BR, Emerson LD, Moinuddin S, Lee LH. Aspiration biopsy of the kidney. Simultaneous collection of cytologic and histologic specimens. Cancer 1985;56:200-205 91. Bonzanini M, Pea M, Martignoni G, Zamboni G, Capelli P, Bernardello F, et al. Preoperative diagnosis of renal angiomyolipoma: fine needle aspiration cytology and immunocytochemical characterization. Pathology 1994;26:170-175 92. Gupta RK, Nowitz M, Wakefield SJ. Fine-needle aspiration cytology of renal angiomyolipoma: report of a case with immunocytochemical and electron microscopic findings. Diagn Cytopathol 1998;18:297-300 93. Liu J, Fanning CV. Can renal oncocytomas be distinguished from renal cell carcinoma on fine-needle aspiration specimens? A study of conventional smears in conjunction with ancillary studies. Cancer 2001;93:390-397 94. Renshaw AA, Lee KR, Madge R, Granter SR. Accuracy of fine needle aspiration in distinguishing subtypes of renal cell carcinoma. Acta Cytol 1997;41:987-994 95. Zhou M, Roma A, Magi-Galluzzi C. The usefulness of immunohistochemical markers in the differential diagnosis of renal neoplasms. Clin Lab Med 2005;25:247-257 96. Smith EH. Complications of percutaneous abdominal fineneedle biopsy. Review. Radiology 1991;178:253-258 97. Silverman SG, Gan YU, Mortele KJ, Tuncali K, Cibas ES. Renal masses in the adult patient: the role of percutaneous biopsy. Radiology 2006;240:6-22 98. Wehle MJ, Grabstald H. Contraindications to needle aspiration of a solid renal mass: tumor dissemination by renal needle aspiration. J Urol 1986;136:446-448 99. Slywotzky C, Maya M. Needle tract seeding of transitional cell carcinoma following fine-needle aspiration of a renal mass. Abdom Imaging 1994;19:174-176. 113.
(16)
수치

+2
관련 문서
Differential Expression of Desmoglein1, Desmoglein3, Epithelial Membrane Antigen, Ber-EP4 and CD10 in Basal Cell Carcinoma and Squamous Cell Carcinoma
그런 가운데 시각장애인을 위한 점자 또한 인천 에서 태어난 송암 박두성 선생님께서 창안해 역사적인 문화유산을 보유하고 있는 곳입니다. 하지만 관계자 외 에는 그런
Carmustine (BCNU) Marrow (delayed nadir) GI, liver (high
Nephrotic syndrome Renal insufficiency Heart
After first field tests, we expect electric passenger drones or eVTOL aircraft (short for electric vertical take-off and landing) to start providing commercial mobility
1 John Owen, Justification by Faith Alone, in The Works of John Owen, ed. John Bolt, trans. Scott Clark, "Do This and Live: Christ's Active Obedience as the
Patients with breast cancer; ovarian cancer; renal cell carcinoma; pancreatic neuroendocrine cancer; colorectal cancer; head and neck cancer; non-small cell lung
Intermittent hemodialysis(IDH) and Continuous renal replacement therapy (CRRT) has been used widely for treating critically ill patients with acute renal failure, We
