ABSTRACT
BACKGROUND/OBJECTIVES: This study aimed to evaluate how breastfeeding and
complementary nutrition practices of mothers of 0–24-month-old children comply with the World Health Organization (WHO) recommendations for infant and young child feeding and to compare the results with selected demographic parameters related to the mother and child.
SUBJECTS/METHODS: The research sample comprised mothers (n = 250) with children less than 2 years old. Data were obtained via questionnaire and were analyzed using SPSS 20.0 package program. The Pearson χ
2or Fisher's exact tests were used for assessing relationships between categorical variables. The one-sample t-test was used for comparisons with reference values.
RESULTS: Most mothers (97.2%) breastfed their babies immediately after birth. The mean time to breastfeeding after delivery was 47.8 ± 14.8 minutes, and 40.8% of the mothers complied with the WHO recommendation. Furthermore, 59.8% of the mothers exclusively breastfed their children for 6 months (mean 5.2 ± 1.5 months). The mean duration to the start of providing complementary food was 5.8 ± 0.6 months, and 76.1% of mothers who complied with the WHO recommendation. Only 12.3% of mothers breastfed their children for at least 12 months (mean 7.7 ± 3.3 months). On average, mothers gave cow milk to their children for the first time at 10.1 ± 1.7 months and honey at 11.8 ± 2.3 months. The mothers' rates of compliance with the WHO recommendations on cow milk and honey feeding were 32.0% and 71.6%, respectively. The rate of mothers who complied with the WHO minimum meal frequency recommendation was 88.3%.
CONCLUSIONS: We suggest that the WHO recommendations on this subject will be realized more fully by emphasizing the importance of the positive effects of breastfeeding until the age of 2 years and of a timely start of complementary food provision. Such changes will affect child health over the long term.
Keywords: Breastfeeding; complementary feeding; infant; food
INTRODUCTION
A healthy source of nutrition has an important role in the healthy growth and development of newborns and young children [1]. Breast milk is the most critical food contributing to the healthy growth and development of children [2]. Exclusive breastfeeding (EBF) for the first
Original Research
Received: Sep 24, 2019 Revised: Nov 25, 2019 Accepted: May 30, 2020
§
Corresponding Author:
Gülperi Demir
Selcuk Universitesi, Sağlık Bilimleri Fakültesi Beslenme ve Diyetetik Bölümü, Alaaddin Keykubat Kampüsü, Konya 42250, Turkey.
Tel. +90-332-241-62-11 Fax. +90-332-240-00-56 E-mail. [email protected]
©2020 The Korean Nutrition Society and the Korean Society of Community Nutrition This is an Open Access article distributed under the terms of the Creative Commons Attribution Non-Commercial License (https://
creativecommons.org/licenses/by-nc/4.0/) which permits unrestricted non-commercial use, distribution, and reproduction in any medium, provided the original work is properly cited.
ORCID iDs Gülperi Demir
https://orcid.org/0000-0002-7362-3335 Hülya Yardimcı
https://orcid.org/0000-0002-2664-4176 Ayşe Özfer Özçelik
https://orcid.org/0000-0002-9087-2042 Funda Pınar Çakıroğlu
https://orcid.org/0000-0003-2324-6874 Conflict of Interest
The authors declare no potential conflicts of interests.
Author Contributions
Conceptualization: Demir G, Yardımcı H;
Data curation: Demir G, Yardımcı H; Formal
Gülperi Demir 1§ , Hülya Yardimcı 2 , Ayşe Özfer Özçelik 2 , and Funda Pınar Çakıroğlu 2
1
Department of Nutrition and Dietetics, Selçuk University, Alaaddin Keykubat Kampüsü, Konya 42250, Turkey
2
Department of Nutrition and Dietetics, Ankara University, Keçiören, Ankara 06290, Turkey
Compliance of mothers' breastfeeding
and complementary feeding practices
with WHO recommendations in Turkey
analysis: Demir G, Yardımcı H; Investigation:
Demir G, Yardımcı H; Methodology: Yardımcı H, Demir G; Supervision: Yardımcı H, Özçelik AÖ, Çakıroğlu FP; Writing - original draft:
Demir G, Yardımcı H; Writing - review &
editing: Yardımcı H, Demir G.
six months postpartum and complementary feeding in conjunction with breastfeeding for infants in the age range of 6–24 months are recommended by the World Health Organization (WHO) [3]. The type and duration of feeding in infants have important roles in biological and behavioral developments and affect subsequent growth and health [4]. The ability of breast milk to meet infants' macronutrient and micronutrient requirements diminishes with age [5].
The WHO, the United Nations International Children's Emergency Fund, and the Global Strategy on Infant and Young Child Feeding have recommended the practice of EBF for the first six months postpartum, beginning from the first hour of life with EBF continuing until the sixth month. Subsequently, appropriate semi-solid and solid complementary food can be provided in the sixth month, but breastfeeding should continue until, at least, the end of the first year [6,7]. Most countries, including Turkey, have adopted these recommendations.
The study evaluated how breastfeeding and complementary feeding practices of mothers of 0–24-month-old children in Turkey comply with the WHO recommendations and to compare the results with selected demographic parameters related to the mother and child.
SUBJECTS AND METHODS
Study design
This study had a cross-sectional, descriptive research design. The planning phase of the study began in January 2017, and data were collected from June to August 2017. Data evaluation was completed in March 2018.
Study setting and sample selection
The research population consisted of mothers and their children living in Aksaray province in the Central Anatolia region of Turkey. The mothers had children between the ages of 0 and 24 months. The mothers and children were enrolled at one of two governmental family health centers in the city center, met the research criteria, and agreed to participate in the study. To determine the appropriate sample size for this study, the results of a Turkey Nutrition and Health Survey (TNHS) performed in 2010 were used as a reference. According to the 2010 TNHS, 59.1% of mothers initiated breastfeeding in the first hour after birth [8]. The sample size of this study was then calculated using the G*Power 3.1.9.4 program with the known rate of 59.1%, an assumed deviation of 5%, and a desired power of 90%; the result indicated a minimum sample size of 248 mothers (Faul vd., 2007) [9]. The data obtained from two additional subjects were included, resulting in a total of 250 mothers and their children in the study sample.
The inclusion criteria for the mothers in the study were: having a 0–24-month-old child, no
mental or communication problems, literate, and a volunteer. The inclusion criteria for the
study children were: a birth weight over 2,000 g, no malnutrition or congenital anomalies,
and no health problems. The subjects participated voluntarily after being fully informed
about the objectives and methods of the study. They signed an informed consent form and
filled in questionnaires that adhered to the Declaration of Helsinki protocols (World Medical
Association). Ethical approval for this study was obtained by the Institutional Review Board
of Ankara University (No:18/304/2016). Permissions from the administrative bodies of the
two governmental family health centers were obtained.
Data collection and procedures
Data were obtained via a questionnaire, which was prepared by the authors after a review of relevant literature [7]. The research questions were based on the WHO recommendations for infant and young child feeding practices. These recommendations include the early initiation of breastfeeding (in the first hour after birth), EBF for 6 months, continued breastfeeding for at least one year, the introduction of solid, semi-solid, or soft foods at the 6
thmonth, and a minimum meal frequency. For breastfed infants, the WHO recommends a minimum of two complementary food meals between the 6
thand 8
thmonths postpartum and three such meals between the 9
thand 23
rdmonths postpartum [7]. In addition, two more time markers were identified in accordance with the WHO recommendations: introduction of cow's milk into the diet at 12 months or later and introduction of honey into the diet at 12 months or later.
To obtain responses to questions, mothers and children were taken into a quiet room and the questions administered via face-to-face interviews. Also, various demography-related questions were asked of the mother. The child's time of birth, birth weight, and birth length were obtained from the records of the Family Health Center at which they were registered.
Statistical analysis
Data were analyzed using SPSS 20.0 package program. The Kolmogorov-Smirnov one-sample test was used to determine the normality of the data. Quantitative data were summarized by presenting mean ( X� ), standard deviation (SD), and minimum and maximum values.
Categorical data were summarized by presenting number and percentage (%) values. The one-sample t-test was used for comparison of results with reference values. Pearson's χ
2or Fisher's exact tests were used to examine relationships between categorical variables. Any test result with a P-value less than 0.05 was accepted as a significant result.
RESULTS
General characteristics of mothers and children
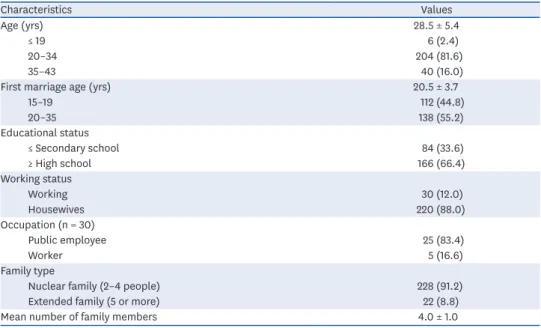
The mean age of the mothers enrolled in the study was 28.5 ± 5.4 years. The mean age at first marriage was 20.5 ± 3.7 years. Of the participating mothers, 66.4% were graduates of high school, and 88.0% were housewives. The majority (91.2%) of the mothers were from nuclear families, which averaged 4.0 ± 1.0 members (Table 1).
Among the children in the study, 48.4% were female, and 51.6% were male. Furthermore, 34.4% were 0–6 months old, 29.6% were 7–12 months old, 22.4% were 13–18 months old, and 13.6% were 19–24 months old. Moreover, 73.2% of the children were born between gestational weeks 38 and 42. Of the children, the average birth weight was 3,260.3 ± 491.4 g;
and the average birth length was 49.9 ± 2.2 cm. The children in the study were, on average, the mother's second child (Table 2).
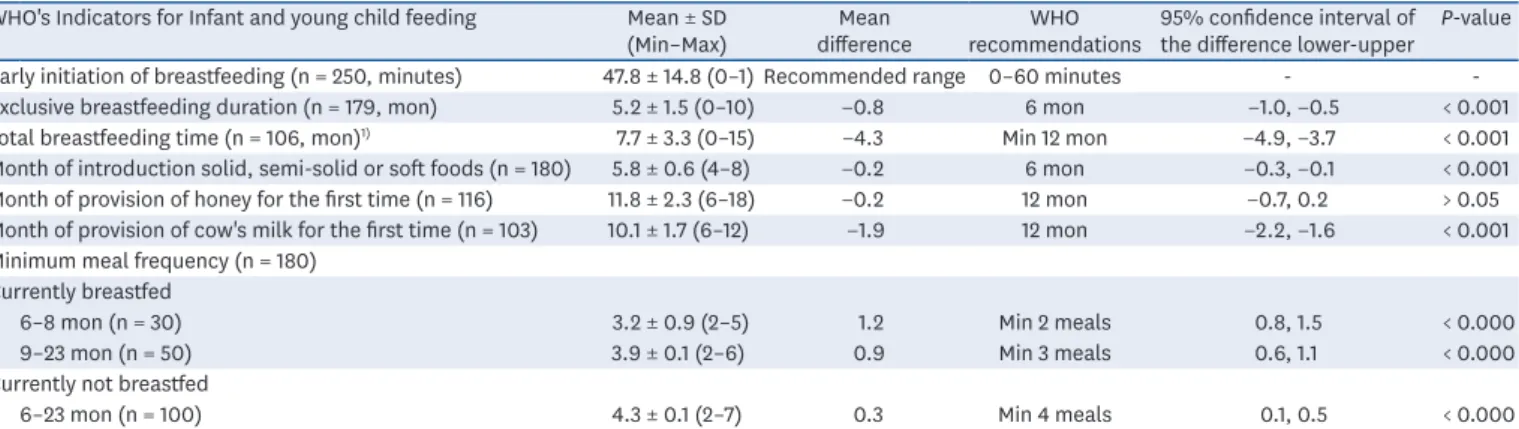
Child feeding practices of mothers based on WHO recommendations The initial breastfeeding time after birth was within the recommended range (47.8 ± 14.8 minutes). However, EBF duration, total breastfeeding duration, the month in which the children were given solid and semi-solid food, and the month in which the children were first given cow's milk significantly deviated from the WHO reference values by −0.8, −4.3,
−0.2, −1.9 months, respectively, P < 0.001). Furthermore, the number of meals was higher
than the WHO recommendation and significantly deviated from the reference values (mean
differences for the 6 to 8-month-old breastfed children: 1.2 meals, for the 9 to 23-month-old
breastfed children: 0.9 meal, and for the 6 to 23-month-old non-breastfed infants: 0.3 meal, P < 0.001; Table 3).
40.8% of the mothers complied with the WHO recommendation for early initiation of breastfeeding, 59.8% complied with the WHO recommendation for 6 months of EBF, 12.3%
complied with the WHO recommendation of continued breastfeeding for at least one year, 76.1% complied with the WHO recommendation to introduce solid, semi-solid, or soft foods at the 6th month, 88.3% complied with the WHO recommendation on a minimum meal frequency, 32.0% complied with the WHO recommendation to introduce cow's milk at an Table 1. Characteristic of the mothers enrolled in the study (n = 250)
Characteristics Values
Age (yrs) 28.5 ± 5.4
≤ 19 6 (2.4)
20–34 204 (81.6)
35–43 40 (16.0)
First marriage age (yrs) 20.5 ± 3.7
15–19 112 (44.8)
20–35 138 (55.2)
Educational status
≤ Secondary school 84 (33.6)
≥ High school 166 (66.4)
Working status
Working 30 (12.0)
Housewives 220 (88.0)
Occupation (n = 30)
Public employee 25 (83.4)
Worker 5 (16.6)
Family type
Nuclear family (2–4 people) 228 (91.2)
Extended family (5 or more) 22 (8.8)
Mean number of family members 4.0 ± 1.0
Values are expressed as mean ± SD or number (%).
Table 2. Characteristic of the children included in this study (n = 250)
Characteristics Values
Sex
Girl 121 (48.4)
Boy 129 (51.6)
Age (mon)
0–6 86 (34.4)
7–12 74 (29.6)
13–18 56 (22.4)
19–24 34 (13.6)
Gestational age (week)
≤ 37 38 (15.2)
38–42 183 (73.2)
> 42 29 (11.6)
Gestational weight (g) 3,260.3 ± 491.4
< 2,500 14 (5.6)
2,500–4,199 226 (90.4)
≥ 4,200 10 (4.0)
Gestational height (cm) 49.9 ± 2.2
< 46 9 (3.6)
46–52.9 228 (91.2)
≥ 53 13 (5.2)
Birth order (excluding stillbirths) 2.0
Values are expressed as mean ± SD or number (%).
age of 12 months or later, and 71.6% complied with the WHO recommendation to introduce honey at 12 months or later (Table 4).
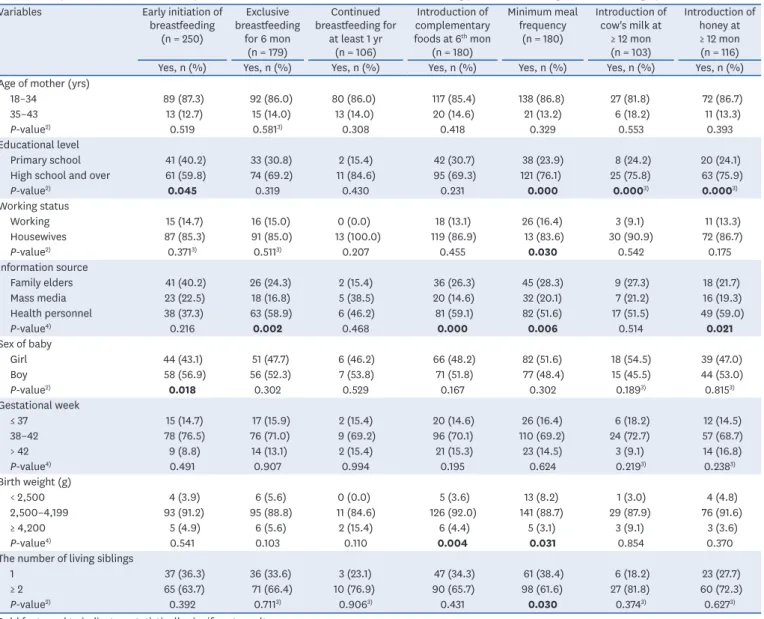
Mothers' compliance with WHO recommendations on child feeding practices There was a significant relationship between the early initiation of breastfeeding and the mother's educational level and the child's sex (P < 0.05). The EBF status of mothers was related to the mother's nutritional information source (P < 0.05). A significant relationship was also detected between the mothers' status of giving complementary food at the sixth month and their information sources (P < 0.05). Significant relationships were also detected between the minimum meal frequency and the mother's educational level, working status, information sources, the infants' birth weight, and the number of living siblings (P < 0.05).
The times of the initial provision of cow's milk and honey were significantly related to the mothers' educational level (P < 0.05), and there was a relationship between the timing of honey provision and the mothers' information sources (P < 0.05, Table 5).
DISCUSSION
In many countries, including Turkey, there are health policies and health implementation programs regarding EBF in the first 6 months of a child's life and the provision of solid food along with breast milk starting at the sixth month of life. However, studies have shown that recommendations made by various authorities, such as WHO, may not be fully implemented.
Recent data has shown that the EBF rate at 6 months of age is only 25.0% in the European Table 3. Assessment of mothers' child-feeding practices according to WHO recommendations
WHO's Indicators for Infant and young child feeding Mean ± SD
(Min–Max) Mean
difference WHO
recommendations 95% confidence interval of the difference lower-upper P-value Early initiation of breastfeeding (n = 250, minutes) 47.8 ± 14.8 (0–1) Recommended range 0–60 minutes - -
Exclusive breastfeeding duration (n = 179, mon) 5.2 ± 1.5 (0–10) −0.8 6 mon −1.0, −0.5 < 0.001
Total breastfeeding time (n = 106, mon)
1)7.7 ± 3.3 (0–15) −4.3 Min 12 mon −4.9, −3.7 < 0.001
Month of introduction solid, semi-solid or soft foods (n = 180) 5.8 ± 0.6 (4–8) −0.2 6 mon −0.3, −0.1 < 0.001 Month of provision of honey for the first time (n = 116) 11.8 ± 2.3 (6–18) −0.2 12 mon −0.7, 0.2 > 0.05 Month of provision of cow's milk for the first time (n = 103) 10.1 ± 1.7 (6–12) −1.9 12 mon −2.2, −1.6 < 0.001 Minimum meal frequency (n = 180)
Currently breastfed
6–8 mon (n = 30) 3.2 ± 0.9 (2–5) 1.2 Min 2 meals 0.8, 1.5 < 0.000
9–23 mon (n = 50) 3.9 ± 0.1 (2–6) 0.9 Min 3 meals 0.6, 1.1 < 0.000
Currently not breastfed
6–23 mon (n = 100) 4.3 ± 0.1 (2–7) 0.3 Min 4 meals 0.1, 0.5 < 0.000
One-sample t-test was administered. The difference between the number of individuals and sampling number was because those who were breastfed were also those who did not start complementary feeding.
WHO, world health organization.
1)
Calculated based on the number of mothers who quit breastfeeding.
Table 4. Percentage of mothers who complied with the WHO recommendations
WHO recommendations n (%) 95% confidence interval
Early initiation of breastfeeding (n = 250) 102 (40.8) 0.34–0.46
Exclusive breastfeeding for 6 mon (n = 179) 107 (59.8) 0.52–0.67
Breastfeeding for at least 1 year (n = 106)
1)13 (12.3) 0.06–0.18
Introduction of solid, semi-solid or soft foods at 6 mon (n = 180) 137 (76.1) 69.8–82.4
Minimum meal frequency (n = 180) 159 (88.3) 0.83–0.93
Introduction of cow's milk at ≥ 12 mon (n = 103) 33 (32.0) 0.22–0.41
Introduction of honey at ≥ 12 mon (n = 116) 83 (71.6) 0.63–0.79
WHO, world health organization.
1)
Calculated based on the number of mothers who quit breastfeeding.
region and 43% in the South-East Asia region. Despite the high breastfeeding initiation rates at birth in many countries, EBF rates have been reported to gradually decline over time, resulting in rather low EBF rates at 6 months of age, particularly in the European region [10].
Data presented in the latest available Turkey Demographic and Health Survey (TDHS) show that the rate of EBF in Turkey was 41.0% [11]. The TDHS showed that the rate of exclusively breastfed children decreases rapidly with age to 14.0% in 4–5-month-old children. Moreover, the breastfeeding rate of children in the first hour after birth was 71.0%, while the percentage starting complementary foods at 6
thmonths was 85.0%, and the rate of breastfeeding during the first year was 66.0% [11]. These results reveal that the targeted rates have not yet been reached in Turkey.
Table 5. Comparison of the mothers' compliance with the WHO recommendations on child feeding practices according to various demographic factors
1)Variables Early initiation of
breastfeeding (n = 250)
Exclusive breastfeeding
for 6 mon (n = 179)
Continued breastfeeding for
at least 1 yr (n = 106)
Introduction of complementary foods at 6
thmon
(n = 180)
Minimum meal frequency
(n = 180)
Introduction of cow's milk at
≥ 12 mon (n = 103)
Introduction of honey at
≥ 12 mon (n = 116)
Yes, n (%) Yes, n (%) Yes, n (%) Yes, n (%) Yes, n (%) Yes, n (%) Yes, n (%)
Age of mother (yrs)
18–34 89 (87.3) 92 (86.0) 80 (86.0) 117 (85.4) 138 (86.8) 27 (81.8) 72 (86.7)
35–43 13 (12.7) 15 (14.0) 13 (14.0) 20 (14.6) 21 (13.2) 6 (18.2) 11 (13.3)
P-value
2)0.519 0.581
3)0.308 0.418 0.329 0.553 0.393
Educational level
Primary school 41 (40.2) 33 (30.8) 2 (15.4) 42 (30.7) 38 (23.9) 8 (24.2) 20 (24.1)
High school and over 61 (59.8) 74 (69.2) 11 (84.6) 95 (69.3) 121 (76.1) 25 (75.8) 63 (75.9)
P-value
2)0.045 0.319 0.430 0.231 0.000 0.000
3)0.000
3)Working status
Working 15 (14.7) 16 (15.0) 0 (0.0) 18 (13.1) 26 (16.4) 3 (9.1) 11 (13.3)
Housewives 87 (85.3) 91 (85.0) 13 (100.0) 119 (86.9) 13 (83.6) 30 (90.9) 72 (86.7)
P-value
2)0.371
3)0.511
3)0.207 0.455 0.030 0.542 0.175
Information source
Family elders 41 (40.2) 26 (24.3) 2 (15.4) 36 (26.3) 45 (28.3) 9 (27.3) 18 (21.7)
Mass media 23 (22.5) 18 (16.8) 5 (38.5) 20 (14.6) 32 (20.1) 7 (21.2) 16 (19.3)
Health personnel 38 (37.3) 63 (58.9) 6 (46.2) 81 (59.1) 82 (51.6) 17 (51.5) 49 (59.0)
P-value
4)0.216 0.002 0.468 0.000 0.006 0.514 0.021
Sex of baby
Girl 44 (43.1) 51 (47.7) 6 (46.2) 66 (48.2) 82 (51.6) 18 (54.5) 39 (47.0)
Boy 58 (56.9) 56 (52.3) 7 (53.8) 71 (51.8) 77 (48.4) 15 (45.5) 44 (53.0)
P-value
2)0.018 0.302 0.529 0.167 0.302 0.189
3)0.815
3)Gestational week
≤ 37 15 (14.7) 17 (15.9) 2 (15.4) 20 (14.6) 26 (16.4) 6 (18.2) 12 (14.5)
38–42 78 (76.5) 76 (71.0) 9 (69.2) 96 (70.1) 110 (69.2) 24 (72.7) 57 (68.7)
> 42 9 (8.8) 14 (13.1) 2 (15.4) 21 (15.3) 23 (14.5) 3 (9.1) 14 (16.8)
P-value
4)0.491 0.907 0.994 0.195 0.624 0.219
3)0.238
3)Birth weight (g)
< 2,500 4 (3.9) 6 (5.6) 0 (0.0) 5 (3.6) 13 (8.2) 1 (3.0) 4 (4.8)
2,500–4,199 93 (91.2) 95 (88.8) 11 (84.6) 126 (92.0) 141 (88.7) 29 (87.9) 76 (91.6)
≥ 4,200 5 (4.9) 6 (5.6) 2 (15.4) 6 (4.4) 5 (3.1) 3 (9.1) 3 (3.6)
P-value
4)0.541 0.103 0.110 0.004 0.031 0.854 0.370
The number of living siblings
1 37 (36.3) 36 (33.6) 3 (23.1) 47 (34.3) 61 (38.4) 6 (18.2) 23 (27.7)
≥ 2 65 (63.7) 71 (66.4) 10 (76.9) 90 (65.7) 98 (61.6) 27 (81.8) 60 (72.3)
P-value
2)0.392 0.711
3)0.906
3)0.431 0.030 0.374
3)0.627
3)Bold font used to indicate a statistically significant result.
WHO, world health organization.
1)
The table only includes information on mothers who complied with the WHO recommendations.
2)
P-values obtained using Fisher's exact test.
3)
continuity correction.
4)