저작자표시-비영리-변경금지 2.0 대한민국 이용자는 아래의 조건을 따르는 경우에 한하여 자유롭게 l 이 저작물을 복제, 배포, 전송, 전시, 공연 및 방송할 수 있습니다. 다음과 같은 조건을 따라야 합니다: l 귀하는, 이 저작물의 재이용이나 배포의 경우, 이 저작물에 적용된 이용허락조건 을 명확하게 나타내어야 합니다. l 저작권자로부터 별도의 허가를 받으면 이러한 조건들은 적용되지 않습니다. 저작권법에 따른 이용자의 권리는 위의 내용에 의하여 영향을 받지 않습니다. 이것은 이용허락규약(Legal Code)을 이해하기 쉽게 요약한 것입니다. Disclaimer 저작자표시. 귀하는 원저작자를 표시하여야 합니다. 비영리. 귀하는 이 저작물을 영리 목적으로 이용할 수 없습니다. 변경금지. 귀하는 이 저작물을 개작, 변형 또는 가공할 수 없습니다.
농학석사학위논문
기능성 형질전환 콩과 고추의
환경위해성평가를 위한 토양 미생물
군집구조의 분자생물학적 연구
Molecular Analysis of Soil Bacterial
Community Structures for Environmental
Risk Assessment with Varieties of Genetically
Modified Soybean and Hot Pepper
2017년 8월
서울대학교 대학원
농생명공학부 식물미생물학전공
A THESIS FOR THE DEGREE OF MASTER OF SCIENCE
Molecular Analysis of Soil Bacterial
Community Structures for Environmental
Risk Assessment with Varieties of Genetically
Modified Soybean and Hot Pepper
By
Jungpyo Yun
Department of Agricultural Biotechnology
The Graduate School of Seoul National University
i
ABSTRACT
Molecular Analysis of Soil Bacterial
Community Structures for Environmental
Risk Assessment with Varieties of Genetically
Modified Soybean and Hot Pepper
Jungpyo Yun
Major in Plant Microbiology
Department of Agricultural Biotechnology
The Graduate School of Seoul National University
With the advance of gene technology, genetically modified (GM) crops have increased in recent years. GM crops offer us various benefits. But there are potential risks of GM crops on the environment. In this study, the impacts of transgenic plants on soil microbial community structures were assessed by using both cultivation and molecular methods during two consecutive years, 2015 and 2016. Two varieties of soybean (Glycine max L.) and hot pepper (Capsicum
annuum L.) were used in this study. The herbicide resistance gene, bar, was
introduced in soybean and hot pepper. The field plot consisted of four subplots planted with GM soybean, non-GM soybean, GM hot pepper, and non-GM hot pepper.To investigate whether or not GM crops have effects on the densities of soil
ii
microorganisms, specific selective media were used. To assess the effects of transgenic crops on microbial community structures, PCR-amplified 16S rRNA genes and nitrogenase genes (nifH) of soil microbial population were analyzed with denaturing gradient gel electrophoresis (DGGE) procedure. 16S rRNA gene sequencing on Illumina MiSeq platform was also performed to analyze soil microbial community distribution. Additionally, persistence of transgenes was monitored using quantitative real-time PCR procedure. The cultural methods and DGGE analysis indicated that soil microbial communities were not significantly different between GM and non-GM lines during the experimental period. The Amplicon-based community profile on Illumina MiSeq platform showed that soil microbial community structures were similar between GM and non-GM lines. The level of the introduced gene (bar) into soybean was greatly increased in soil when the crops were actively growing in the experimental field, but thereafter its level was gradually decreased to the initial level. Meanwhile, the level of the introduced gene (bar) into hot pepper was repeatedly increased and decreased about 4 times in soil depending on its flowering stages. These results indicated that soil microbial community structures were not significantly affected by cultivation of GM soybean and hot pepper varieties.
Keywords: Genetically modified soybean and hot pepper, Soil microbial
community structures, Real-time PCR-DGGE, Illumina MiSeq platform, Persistence of transgenes
iii
CONTENTS
Page
ABSTRACT...i
CONTENTS……….…..iii
LIST OF TABLES……….ⅴ
LIST OF FIGURES……….………….ⅵ
I. INTRODUCTION………..…….1
II. MATERIALS AND METHODS………..4
1. Soil samples and culture media………..4
2. PCR Amplification of Soil Bacterial 16S rDNA and nifH Gene……....7
3. Denaturing Gradient Gel Electrophoresis (DGGE) Analysis………….9
4. Analysis of DGGE Banding Profiles………...…..10
5. PCR Amplification of bar Gene………..……..11
6. Cloning of bar Gene………..………12
7. Quantification of bar Gene for Analysis of Persistence in Soil……...13
8. Illumina MiSeq Sequencing………...14
III. RESULTS……….…....15
iv
2. Real-Time PCR DGGE Analysis………...………….22
3. The Detection of bar Gene Persistence in Soybean and Hot Pepper
Field Soils……….….…….30
4. OTU-Based Microbial Community Profiles……….………..34
5. Taxonomic Composition of the Bacterial Communities in Soybean
and Hot Pepper Subplots……….…….. 37
IV. DISCUSSION……….………...41
LITERACTURE CITED………..……….45
v
LIST OF TABLES
Page
Table 1. The experimental conditions for real-time PCR amplification of
16S rDNA and nifH gene………..………. 8
Table 2. The results of amplicon-based bacterial community and diversity
vi
LIST OF FIGURES
Page
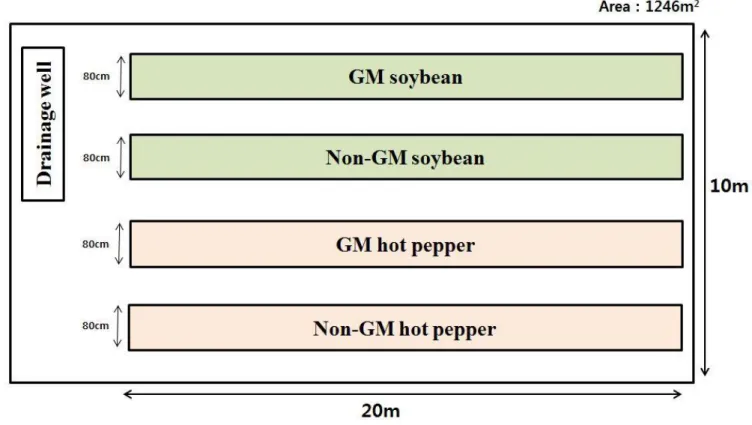
Figure 1. The experimental field design for environmental risk assessment
of GM soybean and hot pepper………...5
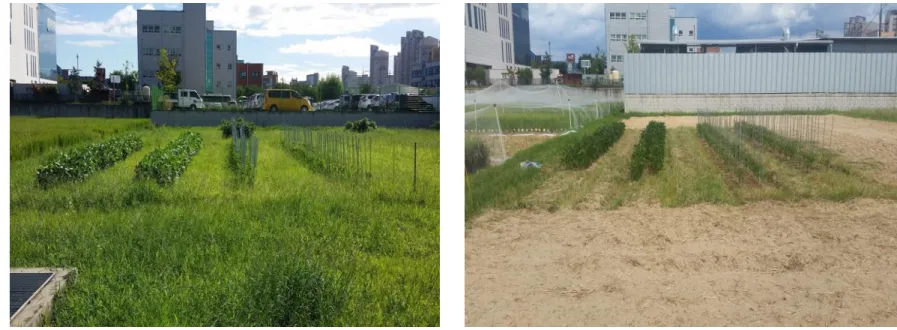
Figure 2. Four subplots consisted of GM soybean, non-GM soybean, GM
hot pepper, and non-GM hot pepper in Aug. 26, 2015 (a) and Aug. 29, 2016
(b)...6
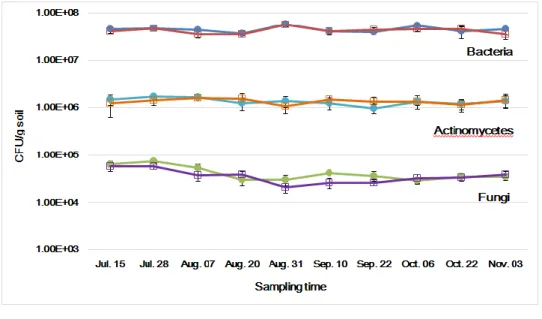
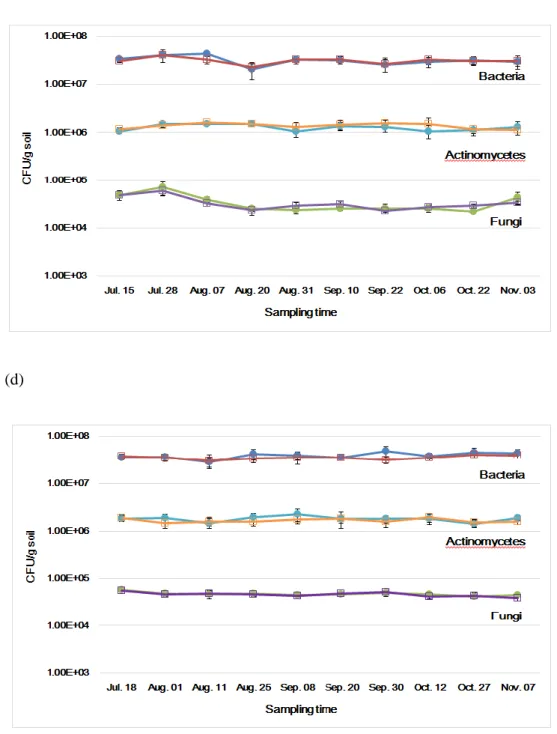
Figure 3. The changes of microbial densities in soybean soil in 2015 (a) and
2016 (b)……….18
Figure 4. The changes of microbial densities in hot pepper soil in 2015 (c)
and 2016 (d)………..………19
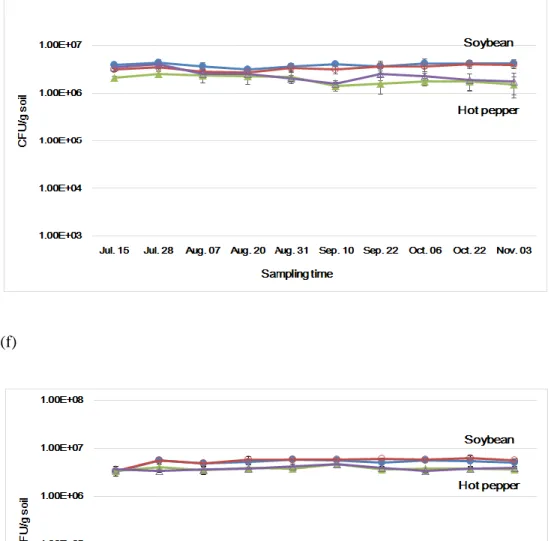
Figure 5. The changes of free-living nitrogen-fixing bacterial densities in
soybean and hot pepper soil in 2015 (e) and 2016 (f)………..…20
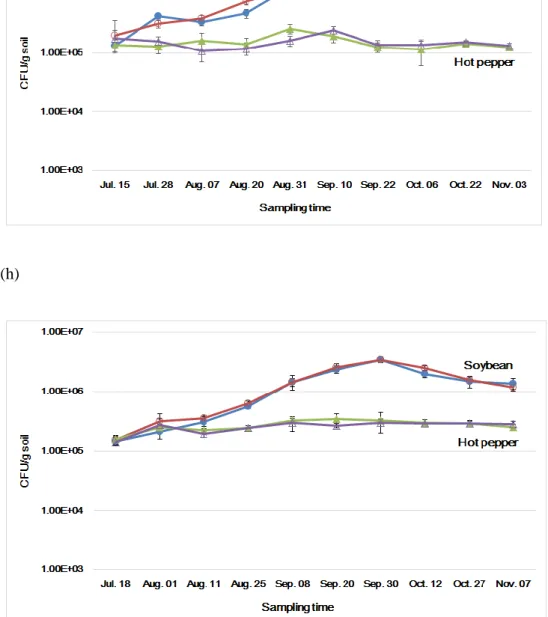
Figure 6. The changes of rhizobium densities in soybean and hot pepper soil
in 2015 (g) and 2016 (h)……….………..21
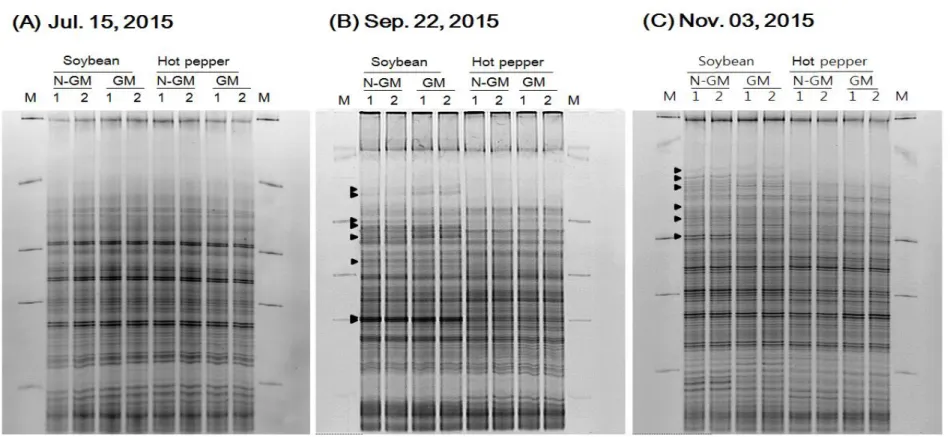
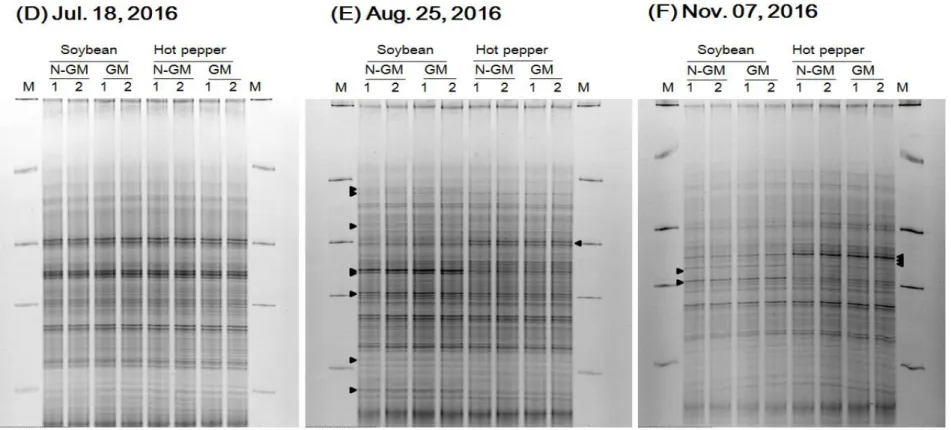
Figure 7. DGGE profiles of bacterial community structures in the
rhizosphere soils of GM soybean, non-GM soybean, GM hot pepper, and
non-GM hot pepper in 2015……….24
Figure 8. DGGE profiles of bacterial community structures in the
rhizosphere soils of GM soybean, non-GM soybean, GM hot pepper, and
non-GM hot pepper in 2016………...25
vii
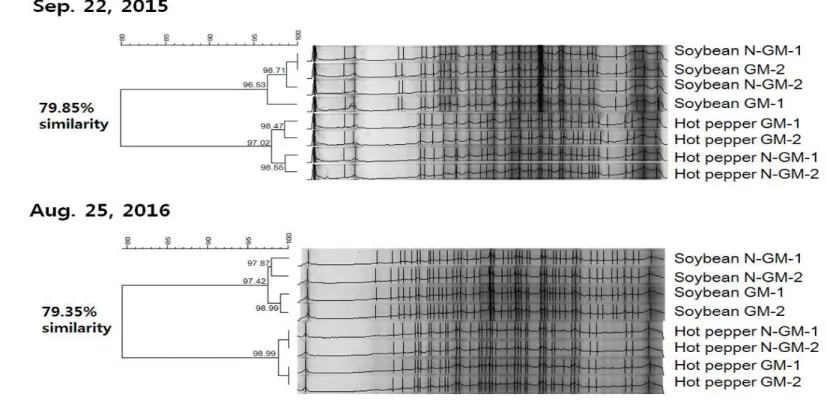
Figure 9. The dendrogram represensted the similarities between the 16S
rDNA -DGGE band patterns according to cluster analysis………….…...26
Figure 10. DGGE profiles of nitrogen-fixing bacterial community structures
in the rhizosphere soils of GM soybean, non-GM soybean, GM hot pepper,
and non-GM hot pepper in 2015………..27
Figure 11. DGGE profiles of nitrogen-fixing bacterial community structures
in the rhizosphere soils of GM soybean, non-GM soybean, GM hot pepper,
and non-GM hot pepper in 2016………..28
Figure 12. The dendrogram represensted the similarities between the nifH
-DGGE band patterns according to cluster analysis………...29
Figure 13. Changes in residual levels of herbicide-resistance bar gene in
GM and non-GM soybean cultivated soil………32
Figure 14. Changes in residual levels of herbicide-resistance bar gene in
GM and non-GM hot pepper cultivated soil………33
Figure 15. Rarefaction analysis of the soil samples………….…………...35
Figure 16. Relative abundances of bacterial phylogenetic groups at (a)
1
I. INTRODUCTION
Despite of many concerns about the potential impact of genetically modified (GM) crops on the environment, many varieties of GM crops have been developed. There are many transgenic crops, including insect-resistance, herbicide-resistance, and nutrition crops like BT cotton, HT soybean, and a golden rice (James, 2014). The total agricultural area planted with GM crops also has increased more than 100-fold during 19-year period from 1.7 million hectares in 1996 to 181.5 million hectares in 2014 (James, 2014). These GM crops offer us benefits such as higher effective yield, enhanced nutritional value, and sizeable income gains (Qaim, 2010). But there are potential risks of GM crops on the environment, which still have not been fully investigated. So, many researches are underway to investigate the environmental impact of GM crops in many countries.
The bar (or pat) gene used in this study was originally derived from
Streptomyces hygroscopicus (Thompson et al., 1987) and Streptomyces viridochromogenes (Wohlleben et al., 1992). The bar gene synthesizes the phosphinothricin acetyltrasnsferase, which inhibits the glufosinate. This bar gene has been introduced into plant to confer the herbicide-resistance (Thompson et al., 1987) and used as a selectable marker in plant engineering (D’ Halluin et al., 1992).
One of the major concerns is the release of transgenes and by-products from GM crops, which may cause spread of artificially-introduced genes in the environment and may have adverse effects on the soil microbial community structures (Lu, 2008). Soil microorganisms play a variety of roles in soil ecosystems such as plant growth promotion, elements and nutrients cycling, producer and decomposer
2
(Singh et al., 2011). The released transgenes have potential impact on the soil microbial community. Actually, there are some cases that total bacterial and fungal population was increased or decreased in rhizosphere of transgenic crop (Donegan
et al., 1995; Ahrenholtz et al., 2000). The horizontal gene transfer (HGT) that is
occurred by soil microorganisms taking up free recombinant DNA released from transgenic plants including conjugation, transduction and transformation also exerts influence on soil microorganisms such as antibiotic resistance transferring to pathogenic microbes (Kari and James., 2004; Kaare et al., 1998). Furthermore, the released transgenes could persist in soil for a long-term period (Gebhard and Smalla., 1999). In recent studies, although differences in soil microbial communities between GM plant and non-GM plant were observed during the plant growing period (Hur et al., 2011; Tan et al., 2010; Dunfield and Germida, 2001), there were no or minor differences in microbial communities between GM and non-GM plant (Kapur et al., 2010; Blackwood and Buyer, 2004; Singh et al., 2013).
This study aimed to assess the impacts of GM soybean and hot pepper containing glufosinate-resistance gene (bar) on soil microbial communities and monitor the persistence of transgene in rhizosphere soil during experimental periods. This study was conducted for two consecutive years. The changes of microbial density and the variations of microbial community structure were analyzed by a culture-dependent plating method and molecular methods such as DGGE profiles and amplicon-based community profiling using Illumina MiSeq platform. Quantitative Real-Time PCR procedure was used for monitoring the persistence of bar gene in rhizosphere soil. This study is expected to be utilized as an evaluation reference for environmental risk assessment of GM crops and a
3
standard protocol for assessment of the impacts of GM crops on soil microbial community.
4
II. MATERIALS AND METHODS
1. Soil Samples and Culture Media
The rhizosphere soil samples were obtained from the environmental risk assessment experimental field at farm of Seoul National University, Suwon. The soybean and hot pepper were provided from Crop Molecular Physiology & Weed Science Laboratory in Seoul National University and Nongwoobio Co., Ltd., respectively. The plot consisted of four subplots (Fig. 1). Four varieties (GM soybean, non-GM soybean, GM hot pepper and non-GM hot pepper) were planted on each subplot in July and grown for about 112 days in 2015 and 2016 years (Fig. 2). Beginning in mid-July, soil samples were taken 10 times at the interval of about 12 days during experimental periods. Soil samples from the experimental field were sieved through a 2-mm mesh and kept at 4 °C prior to use.
A 10-g soil sample from each subplot was homogenized with 9.5ml of sterilized 0.85% saline solution by shaking at 200 rpm on a rotary shaker (Vision Co., Bucheon, Korea). Total bacteria, actinomycetes, and fungi were measured with 5% PTYG agar, sodium caseinate agar, and malt extract agar medium, respectively (Weaver et al., 1999; Fredrickson and Balkwill, 1998). Total free living N2-fixing bacteria and rhizobia were also measured with JMV agar and YMA agar medium, repectively (Baldani et al., 2014; Graham, 1969). All cultures were incubated at 28 °C for 4-6 days. All colonies on agar medium were counted.
5
6
(a) (b)
Figure 2. Four subplots consisted of GM soybean, non-GM soybean, GM hot pepper, and non-GM hot pepper in Aug. 26, 2015 (a) and
7
2. PCR Amplification of Soil Bacterial 16S rDNA and nifH
Gene
Soil bacterial community DNA was extracted using a FastDNA® Spin Kit (MP Biomedicals, Solon, OH, U.S.A.). The concentration of all total soil DNA was equalized to 20 ng/µl. PCR amplification of 16S rDNA and nifH was performed with the 352TA-515r and polF-polR primer pairs (Table 1). The primer pair, 352TA and 515r, for amplifying the soil bacterial 16s rDNA target the highly variable V3 region (Ahn et al., 2009). A primer pair of polF and polR was used for amplifying the nifH encoding the iron protein subunit of nitrogenase (Young, 1996; Zehr et al., 2003; Raymond et al., 2004). PCR amplification was conducted using the LightCycler® 480 Real-Time PCR system (Roche). The PCR product contains a GC clamps, added to 352TA and polF, respectively. PCR amplification was performed in 50 µl reaction mixture containing 10×PCR buffer (TaKaRa Bio Inc.), 1 µl of DNA template, 20 pmol of each primer, 2.5 mM of each dNTP (TaKaRa Bio Inc.), 10 mg/ml bovine serum albumin, 0.5×SYBR Green I, 2.5 U of Taq polymerase (TaKaRa Bio Inc.).The PCR amplification was performed at 94 °C for 5 min initially, then 94 °C for 1 min, 51 °C for 1 min, and 72 °C for 1 min and final extension at 72 °C form 30 min. The amplification cycles of 16S rRNA and nifH genes were 24, 30, respectively. After PCR amplification, the PCR products were purified with MiniElute® PCR purification kit (Qiagen, Hilden, Germany) and checked by electrophoresis on horizontal 1 % agarose gels.
8
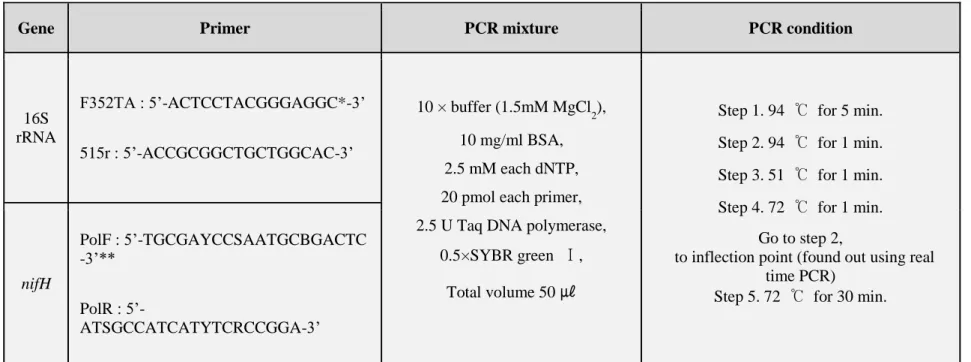
Table 1. The experimental conditions for real-time PCR amplification of 16S rDNA and nifH gene.
Gene Primer PCR mixture PCR condition
16S rRNA F352TA : 5’-ACTCCTACGGGAGGC*-3’ 515r : 5’-ACCGCGGCTGCTGGCAC-3’ 10 × buffer (1.5mM MgCl2), 10 mg/ml BSA, 2.5 mM each dNTP, 20 pmol each primer, 2.5 U Taq DNA polymerase,
0.5×SYBR green Ⅰ, Total volume 50 ㎕
Step 1. 94 ℃ for 5 min. Step 2. 94 ℃ for 1 min. Step 3. 51 ℃ for 1 min. Step 4. 72 ℃ for 1 min.
Go to step 2,
to inflection point (found out using real time PCR)
Step 5. 72 ℃ for 30 min.
nifH
PolF : 5’-TGCGAYCCSAATGCBGACTC -3’**
PolR :
5’-ATSGCCATCATYTCRCCGGA-3’
*GC clamp (CCGGGCGGCGCGCCCCGGGCGGGGCGCGGGGCACGGGCGC) was attached at the 5’ end.
9
3. Denaturing Gradient Gel Electrophoresis (DGGE) Analysis
DGGE was performed on a Dcode mutation detection system (BioRad, Hercules, CA, USA). DGGE analysis procedure was conducted as described previously (Ahn
et al., 2009). The amplified PCR products were mixed with 2x gel loading dye (2%
bromophenol blue, 2% xylene cyanol, 100% glycerol) and separated on Acrylamide-bisacrylamide (37.5:1) gels with a 43-63% denaturing gradient. The 100% denaturant contains 7M urea and 40% (vol/vol) formamide. The gels were eletrophoresed in 0.5x TAE buffer for 25hr at 60 °C and a voltage of 60 V. DGGE marker II (Wako Pure Chemical Industries, Osaka, Japan) was used with the samples. After electrophoresis, the gels were stained with SYBR Green I (Lonza, Rockland, ME, U.S.A) for 20 min, and then destained with 0.5×TAE buffer for 15 min. The gels were photographed with UV transillumination (302nm).
10
4. Analysis of DGGE Banding Profiles
The DGGE gel bands were analysed with Bionumerics® software (Applied Maths, St-Martens-Latem, Belgium). For comparison between each lane, DGGE bands were normalized. DGGE bands were counted according to the presence and absence of bands and quantified at each position. The similarities of DGGE gel band patterns between samples were shown as dendrograms that were constructed by the unweighted pair group method of arithmetic averages (UPGMA) and the Dice coefficient (Fromin N et al., 2002).
11
5. PCR Amplification of bar Gene
PCR amplification of bar gene fragments was performed using the primers barF
and barR (5’-GAGGCACAGGGCTTCAAGAG-3’ and
5’-CTGAAGTCCAGCTGCCAGAA). This primer pair was designed in this study. For the bar gene amplification, genomic DNAs were isolated from the young leaves of GM soybean and hot pepper plants using DNeasy® Plant Mini Kit (Qiagen). PCR amplification was performed in total 50 µl reaction mixture containing 5 µl 10×buffer (TaKaRa Bio Inc.), 5 µl forward primer (20 pmol/ μl), reverse primer (20 pmol/ μl), 5 µl dNTP (TaKaRa Bio Inc.), 0.5 µl Taq polymerase (TaKaRa Bio Inc.). The amplification conditions consisted of an initial denaturation at 94 °C for 10 min, subsequent denaturations at 94 °C for 1 min, annealing at 68 °C for 2 min, extension at 72 °C for 10 min. After PCR amplification, 2 μl samples of the PCR products were checked by electrophoresis on 1.0% agarose gels.
12
6. Cloning of bar Gene
The PCR products of amplified bar gene obtained from the young leaves of GM
soybean and hot pepper were cloned into the pGEM®-T Easy Vector as recommended by the manufacturer (Promega, Madison, U.S.A.). E. coli DH10B competent cell was used throughout this study for transformation. Before electroporation, 2 µl cloned DNA was mixed with 30 µl of competent cell and transferred to chilled electroporation cuvettes. Electroporation was performed at 1.7 kV pulse (200Ω, 4msec) using Gene Pulser® II apparatus equipped with a pulse controller (Bio-Rad). After the electroporation pulse, 1ml SOC medium (2% Bacto tryptone, 0.5% Bacto yeast extract, 10mM NaCl, 250mM KCl, 10mM mgCl2,
20mM glucose) was added into the cuvette immediately and transferred to culture tube. The culture tube was incubated for 1hr at 37 °C. LB agar medium containing 100 ppm ampicillin as working concentration was used to select the transformants. The selected colonies were counted, and cloned plasmid DNA was extracted by the Plasmid Extraction Miniprep Kit (Bioneer, South Korea). The extracted plasmid DNA was checked by electrophoresis on 1.0% agarose gels.
13
7. Quantification of bar Gene for Analysis of Persistence in
Soil
The quantity of bar gene in soil was determined using a quantitative PCR. In order to detect the copies of bar gene in the rhizosphere soil, standard curve was constructed by using E. coli transformed with bar gene as previously described method (Romanowski et al., 1993). The transformants were serially diluted into 20g soil, ranging from 101 to 108 copies / g soil. After that, diluted bar gene was extracted from each standard soil sample using FastDNA® Spin Kit (MP Biomedicals, Solon, OH, U.S.A.). Quantification of bar gene was conducted using the LightCycler® 480 Real-Time PCR system (Roche). Threshold cycle was calculated by real-time PCR analysis. The linear correlation between Ct value and
bar gene concentration was analyzed to determine the standard. Real-time PCR
was carried out in 0.2 μl forward primer (20 pmol), 0.2 μl reverse primer (20 pmol), 10 μl SYBRPremixExTaq II (Takara Bio Inc.), 2 μl template DNA, and ddH2O in a final volume of 20 μl. A two-step experimental run protocol was used: denaturation program at 95 °C for 5 min, amplification and quantification program repeated 40 times at 95 °C for 10 sec, 60 °C for 30 sec with a single fluorescence measurement, melting curve program at 95 °C for 5 sec, 65 °C 1 min, 97 °C with a continuous fluorescence measurement), and finally a cooling step to 40 °C.
14
8. Illumina MiSeq Sequencing
The sequencing of PCR amplicons from Illumina MiSeq was performed at Macrogen (Seoul, South Korea). All reads were checked, trimmed and filtered using CD-HIT-OUT (Li et al., 2012). The error-free reads were picked. After initial filtering, Operational taxonomic units (OTUs) with 97 % similarity cut-off were clustered using MOTHUR (Schloss et al., 2009). The selected sequences were aligned using the Basic Local Alignment Search Tool (BLAST). Raw sequencing data (FASTQ files) were processed including de-multiplexing, quality filtering, taxonomic assignment, and phylogenetic reconstruction using QIIME (Quantitative Insights Into Microbial Ecology) pipeline (Caporaso et al., 2010). Alpha diversity was analyzed by QIIME. The rarefaction analysis based on species richness was conducted to determine the diversity indices, including the Chao1, Shannon and Simpson diversity index.
15
III. RESULTS
1. Changes of Total Microbial Populations
To measure the changes of microbial density over time between GM and non-GM plants, the total viable count of bacteria, actinomycetes, fungi, free-living nitrogen-fixing bacteria, and rhizobium in rhizosphere soil of soybean and hot pepper field were estimated in 2015 and 2016 years, respectively. The total bacterial cell densities were in the range of 3.57 x 10⁷ - 4.47 x 10⁷ cfu/g soil in 2015 and 3.20 x 10⁷ – 5.76 x 10⁷ cfu/g soil in 2016 in GM and non-GM soybean cultivated soil (Fig. 3), and 2.93 x 10⁷ – 3.37 x 10⁷ cfu/g soil in 2015 and 2.87 x 10⁷ – 4.86 x 10⁷ cfu/g soil in 2016 in GM and non-GM hot pepper cultivated soil (Fig. 4). These bacterial cell density ranges showed that there were no significant differences between GM and non-GM field soils. The actinomycetes population densities were in the range of 1.23 x 10⁶ – 1.45 x 10⁶ cfu/g soil in 2015 and 1.53 x 10⁶ – 2.32 x 10⁶ cfu/g soil in 2016 in GM and non-GM soybean cultivated soil (Fig. 3),and 1.07 x 10⁶ – 1.32 x 10⁶ cfu/g soil in 2015 and 1.43 x 10⁶ – 2.26 x 10⁶ cfu/g soil in 2016 in GM and non-GM hot pepper cultivated soil (Fig. 4). These actinomycetes cell density ranges also showed that there were no significant differences between GM and non-GM field soils. The fungal population densities, which were in the range of 2.11 x 10⁴ – 7.36 x 10⁴ cfu/g soil in 2015 and 3.43 x 10⁴ – 5.72 x 10⁴
cfu/g soil in 2016 in GM and non-GM cultivated soil (Fig. 3), and 2.19 x 10⁴ – 7.06 x 10⁴ cfu/g soil in 2015 and 3.88 x 10⁴ – 5.72 x 10⁴ cfu/g soil in 2016 in GM and non-GM hot pepper cultivated soil were not significantly different between GM and non-GM field soils (Fig. 4). One-way analysis of variance
16
(ANOVA) was used to evaluate the statistical significance between GM and non-GM crops with the cell densities of bacterial, actinomycetal and fungal in 10 time sampling points. The result of ANOVA showed that no significant differences were observed between GM and non-GM soils in the microbial populations (P>0.05).
In addition to bacteria, actinomycetes, and fungi, the cell densities of the nitrogen-fixing bacteria (free-living nitrogen-fixing bacteria, rhizobium) were measured. The total free-living nitrogen-fixing bacteria cell densities were in the range of 2.69 x 10⁶ - 4.28 x 10⁶ cfu/g soil in 2015 and 3.22 x 10⁶ – 6.27 x 10⁶ cfu/g soil in 2016 in GM and non-GM soybean cultivated soil, and 1.56 x 10⁶ – 4.03 x 10⁶ cfu/g soil in 2015 and 3.34 x 10⁶ – 4.68 x 10⁶ cfu/g soil in 2016 in GM and non-GM hot pepper cultivated soil (Fig. 5). These density ranges showed that there were no significant differences between GM and non-GM field soils. The
rhizobium cell densities were in the range of 1.32 x 10⁵ – 3.80 x 10⁶ cfu/g soil in 2015 and 1.46 x 10⁵ – 3.48 x 10⁶ cfu/g soil in 2016 in GM and non-GM soybean cultivated soil (Fig. 6). The rhizobium cell densities were 105 CFU levels when the cultivation begins, thereafter the cell densities increased about 10 times to 106 CFU levels as soybean grew. This result suggested that rhizobium forms a symbiotic relationship with legume plants and the cell density was increased. On the other hand, The rhizobium cell densities in GM and non-GM hot pepper cultivated soils were consistent in the range of 1.08 x 10⁵ – 2.43 x 10⁵ cfu/g soil in 2015 and 1.42 x 10⁵ – 3.45 x 10⁵ cfu/g soil in 2016 (Fig. 6). One-way analysis of variance (ANOVA) was used to evaluate the statistical significance between GM and non-GM crops with the cell densies of free-living nitrogen-fixing bacteria and rhizobium in 10
17
time sampling points. The result of ANOVA showed that no significant differences were observed between GM and non-GM soils in the free-living nitrogen-fixing bacteria and rhizobium populations, respectively (P>0.05).
When all these results were combined, the microbial population dynamics were not significantly different between GM and non-GM crops during the experimental period.
18
(a)
(b)
Figure 3. The changes of microbial densities in soybean soil in 2015 (a) and 2016 (b). Colored circle, non-GM soybean soil; hollow square, GM soybean soil.
19
(c)
(d)
Figure 4. The changes of microbial densities in hot pepper soil in 2015 (c) and 2016 (d). Colored circle, non-GM hot pepper soil; hollow square, GM hot pepper soil.
20
(e)
(f)
Figure 5. The changes of free-living nitrogen-fixing bacterial densities in soybean and hot pepper soil in 2015 (e) and 2016 (f). Colored circle, non-GM soybean and hot pepper soil; hollow square, GM soybean and hot pepper soil.
21
(g)
(h)
Figure 6. The changes of rhizobium densities in soybean and hot pepper soil in 2015 (g) and 2016 (h). Colored circle, non-GM soybean and hot pepper soil; hollow square, GM soybean and hot pepper soil.
22
2. Real-Time PCR DGGE Analysis
To assess the impacts of GM soybean and hot pepper on microbial community structures, DGGE analysis was carried out with DNA extracted from experimental soil and amplified with the variable V3 region of 16S rRNA gene and the nifH. In the analysis of bacterial community structures using DGGE approach, the similar DGGE band patterns were observed in GM soybean, non-GM soybean, GM hot pepper, and non-GM hot pepper subplots on July 15, 2015 and July 18, 2016 immediately after soybean and hot pepper transplanting (Fig. 7A and Fig. 8D). As crops grew, the differences in these DGGE band patterns began to appear between different varieties of crops, soybean and hot pepper. However, there were significant differences between GM and non-GM crops except for some irregular fluctuations due to the heterogeneity of soil samples (Fig. 7B and Fig. 8E). At the end of the experiment, the differences of DGGE band patterns between soybean and hot pepper observed in the previous period were almost disappeared. The intensity of the strong band which showed differences between soybean and hot pepper soils was also weakened. As a result, the DGGE band patterns became similar at the end of the cultivation (Fig. 7C and Fig. 8F). The DGGE bands of Sep 22, 2015 and Aug 25, 2016, when the band variation was the greatest between crops, were clustered and analyzed using the Dice correlation matrix and the unweighted pair group method. The eight lanes of DGGE patterns were greatly divided into two groups of soybean and hot pepper, the similarities of two groups were 79.85% in Sep 22, 2015 and 79.35% in Aug 25, 2016. On the other hand, the similarities of GM and non-GM groups were more than 95% (Fig. 9)
23
In nitrogen-fixing bacteria community structures, the similar DGGE band patterns were observed in GM soybean, non-GM soybean, GM hot pepper, and non-GM hot pepper subplots on July 15, 2015 and July 18, 2016 immediately after soybean and hot pepper transplanting (Fig. 10A and Fig. 11D). As crops grew, the high-intensity bands appeared only in GM and non-GM soybean soils. There were similar band patterns between GM and non-GM soils, but only differences between soybean and hot pepper soils (Fig. 10B and Fig. 11E). At the end of the experiment, the high-intensity bands in GM and non-GM soybean soils were weakened and the DGGE band patterns became gradually similar between soybean and hot pepper soils (Fig. 10C and Fig. 11F). The DGGE profiles of Sep 22, 2015 and Sep 20, 2016, when the band variation was the greatest between crops, were clustered and analyzed using the Dice correlation matrix and the unweighted pair group method. The 8 lanes of DGGE bands were greatly divided into two groups of soybean and hot pepper, and the similarities of two groups were 60.01% in Sep 22, 2015 and 72.17% in Sep 20, 2016. On the other hand, the similarities of GM and non-GM groups were more than 95% (Fig. 12).
The results suggested that the microbial community structures were similar between GM and non-GM crops without being significantly affected by GM crops.
24
Figure 7. DGGE profiles of bacterial community structures in the rhizosphere soils of GM soybean, GM soybean, GM hot pepper, and non-GM hot pepper in 2015
25
Figure 8. DGGE profiles of bacterial community structures in the rhizosphere soils of GM soybean, GM soybean, GM hot pepper, and non-GM hot pepper in 2016
26
27
Figure 10. DGGE profiles of nitrogen-fixing bacterial community structures in the rhizosphere soils of GM soybean, non-GM soybean, GM hot pepper, and non-GM hot pepper in 2015
28
Figure 11. DGGE profiles of nitrogen-fixing bacterial community structures in the rhizosphere soils of GM soybean, non-GM soybean, GM hot pepper, and non-GM hot pepper in 2016
29
30
3. The Detection of bar Gene Persistence in Soybean and Hot
Pepper Field Soils
The persistence of recombinant bar gene in soybean and hot pepper field soils was monitored by using quantitative real-time PCR approach during the
experimental periods. In GM soybean field, the original background levels of glufosinate-resistance gene (bar) introduced into GM soybean were 1.01 x 101 copies/g soil on July 15, 2015 and 1.04 x 101 copies/g soil on July 18, 2016. Thereafter, the level of bar gene was greatly increased more than about 10 times compared with the initial background levels in GM soybean field during the flowering stage of soybean in the experimental field. The increased levels of bar gene were 5.30 x 10² copies/g soil on Aug 20, 2015 and 3.13 x 10² copies/g soil on Aug 01, 2016. The levels of the bar gene were decreased to 4.42 x 101 copies/g soil on Sep 10, 2015 and 6.48 x 101 copies/g soil on Aug 25, 2016, respectively. Its level was gradually recovered to the initial background level with 1.01 x 101 copies/g soil on Nov 3, 2015 and 1.04 x 101 copies/g soil on Nov 7, 2016 (Fig. 13). On the other hand, in non-GM soybean field which were not affected by bar gene, the levels of bar gene were remained in the constant range of 1.01 x 101 – 1.74 x 101 copies/g soil during the experimental periods (Fig. 13). In GM hot pepper field, the levels of bar gene in 2015 and 2016 were repeatedly increased and decreased about 4 times depending of its flowering. The original background levels of bar gene were 1.01 x 101 copies/g soil on July 15, 2015 and 1.04 x 101 copies/g soil on July 18, 2016. Thereafter, these levels were increased to 6.64 x 101 copies/g soil on Aug 07, 2015 and 2.43 x 10² copies/g soil on Aug 01, 2016 when the flowering
31
stage of hot pepper. The increased levels were decreased again to 3.55 x 101 copies/g soil on Aug 31, 2015 and 5.43 x 101 copies/g soil on Aug 11, 2016. And then, the residual levels of bar gene were repeatedly increased depending on its flowering stage and decreased in range of 3.64 x 101 – 8.93 x 101 copies/g soil and 1.73 x 101 – 6.70 x 101 copies/g soil in 2015 and 2016, respectively (Fig. 14). On the other hand, in non-GM hot pepper field which were not affected by bar gene, the levels of bar gene were remained in the constant range of 1.01 x 101 – 1.42 x 101 copies/g soil during the experimental periods (Fig. 14).
These results suggested that some of transgenes were released from GM crops into the field soil depending on flowering stage. The flowering of GM soybean and hot pepper caused the bar gene to flow into the cultivation rhizosphere soils. In the case of hot pepper, about 4 times of flowering stages were observed during the entire cultivation period while the soybean had a single flowering stage. The bar gene released into the soils was temporarily increased, but tended to be
32
(a) (b)
33
(c) (d)
34
4. OTU-Based Microbial Community Profiles
Operational taxonomic unit (OTU)-based profiles were analyzed to assess the GM crops on soil bacterial communities with soil samples of November 7th, 2016. The total number of 93,624 reads and 5,140 OTUs in 16S rDNA clone libraries were obtained through Illumina MiSeq sequencing analysis. The species richness in soil samples was estimated, based on the construction of rarefaction curve (Fig. 15). The rarefaction curves constructed from clone libraries of GM soybean (GS), non-GM soybean (NS), non-GM hot pepper (GP), and non-non-GM hot pepper (NP) approached the saturation plateau, showing the similar trends. The rarefaction curves of each sample indicated a low gap in the total number of OTUs.
The diversity indices of species in each sample were calculated by Chao1, Shannon and Simpson Index based on richness and evenness of OTUs (Table 2). The total OTUs of GS, NS, GP, and NP were ranged from 1,209 to 1,329 in a total of 5140 OTUs (Table 2). To evaluate the difference of species diversity between GM and non-GM crops, ANOVA analysis was performed with Chao1, Shannon and Simpson Index. The result of ANOVA analysis indicated that the bacterial diversity was no significantly different between GM and non-GM crops (P > 0.05). These results suggested that GM crops had no effects on the abundances of soil bacterial community structure.
35
36
Table 2. The results of amplicon-based bacterial community and diversity estimates in each soil sample.
Sample Reads OTUs Chao1 Shannon Simpson Goods coverage
GS 23,700 1,303 1447.065 8.584 0.994 0.990
NS 24,917 1,299 1422.193 8.514 0.993 0.991
GP 25,551 1,329 1442.801 8.529 0.993 0.992
37
5. Taxonomic Composition of the Bacterial Communities in
Soybean and Hot Pepper Subplots
The 16S rRNA sequences from the communities were identified and classified to assess the differences of bacterial distribution between GM and non-GM crops. The relative bacterial community abundances at the phylum, class levels were illustrated in Fig. 16. A total of 21 phyla and 41 classes were observed in all soil samples. Proteobacteria, Bacteroidetes, Acidobacteria, and Actinobacteria were commonly dominant phyla, which comprised more than 55% in total libraries of each sample. The percentages of Proteobacteria, the most abundant phylum, in GM soybean, non-GM soybean, GM hot pepper, and non-GM hot pepper were 26.94 %, 27.03 %, 26.09 %, and 25.27 %, respectively. Bacteroidetes, the second most abundant phylum, occupied 13.46 % (GM soybean), 16.92 % (non-GM soybean), 12.52 % (GM hot pepper), 14.24 % (non-GM hot pepper), of all libraries (Fig. 16a). The compositions of the bacterial community at phylum level were not significantly different except for slight differences between GM and non-GM soils.
Further analysis about the relative bacterial community abundance at the class level showed that Alphaproteobacteria was the most predominant class among the libraries (Fig. 16b). The percentages of Alphaproteobacteria were 14.44% (GM soybean), 15.58% GM soybean), 14.50% (GM hot pepper), and 14.18%
(non-GM hot pepper), respectively. Bacteroidetes_unclassified,
Actinobacteria_unclassified, and Gammaproteobacteria were dominant class. The
compositions at class level were also not significantly different between GM and non-GM soils, just as at the phylum level.
38
These results suggested that there were no significant differences between GM and non-GM crop lines in the composition of bacterial community structures, and GM crop did not affect the soil bacterial community structure.
39
40
(b)
41
IV. DISCUSSION
As the transgenic crops continue to increase, many concerns about their adverse impacts on the soil microbial communities are controversial. There are various methodological tools to analyze the soil microbial community structures including culture-dependent such as viable plating count, and culture-independent methods such as Denaturing gradient gel electrophoresis (DGGE), Terminal restriction fragment length polymorphism (T-RFLP), Community level physiological profiling (CLPP), Substrate induced respiration technique (SIR), Phospholipid fatty acids (PLFA), Fatty acid methyl ester (FAME), and enzymatic activity (Amann et al., 1995; Kim et al., 2016). Based on these tools, a lot of studies to assess the influence of transgenic plants on soil microbial communities have been actively conducted and debated. Some previous studies showed that soil microbial communities were influenced by transgenic plant (Hur et al., 2011; Tan et al., 2010; Dunfield and Germida, 2001). The other way, many researches suggested that there were no or minor changes in microbial communities, and the differences between GM and non-GM plant were temporary (Kapur et al., 2010; Blackwood and Buyer, 2004; Singh et al., 2013). Additionally, it was reported that the microbial catabolic activity was not affected by GM crop, when compared with non-GM crop (Brolsma
et al., 2015; Zhou et al., 2016). In the case of glufosinate-tolerant plant, glufosinate
ammonium-tolerant canola affected the microbial community compared to non-GM line (Dunfield and Germida, 2001). On the other hand, there were no significant differences in soil microbial communities between transgenic maize and its non-transgenic cultivar (Schmalenberger and Tebbe, 2002). The effects of
42
glufosinate-tolerant oilsed rape were also minor compared to the non-GM line (Gyamfi et al., 2002). In this study, we assessed the impact of glufosinate-tolerant transgenic soybean and hot pepper on soil microbial communities, using culture-dependent plating method, real-time PCR-DGGE, quantitative real-time PCR, and OTU-based community profiling with Illumina MiSeq platform. In culture-dependent method, total count of the bacteria, actinomycetes, and fungi were measured between GM and non-GM crops. Free-living nitrogen-fixing bacteria and
Rhizobium were also estimated to evaluate the effect of transgenic crops on specific
microorganism. The results showed that the microbial dynamics of GM subplots were quite similar compared to non-GM subplots. Only the density of Rhizobium associated with legume plants increased in soybean soils. The previous our study suggested that there were no meaningful differences of microbial community levels between GM and non-GM rice soils (Kim et al., 2008). Similarly, no differences were also detected in this study. The culture-dependent method is simple and useful, but molecular approaches should be performed concurrently due to limit in cultivation of whole soil microorganisms and detection of accurate impact.
Next, the amplified 16S rDNA and nifH gene fragments were analyzed using improved DGGE fingerprint methods from total soil DNA (Ahn et al., 2009). DGGE has great resolving power to analyze the microbial community in soil (Muyzer and Smalla, 1998). The results showed that there were no significant differences in DGGE band patterns between GM and non-GM lines even though slightly differences could be detected due to soil heterogeneities. DGGE band dendrogram showed that there were only obvious differences between crops (soybean and hot pepper), not between GM and non-GM lines. The previous
43
researches using glufosinate-tolerant oilseed rape and rice also showed that there were no or minor differences compared with non-GM lines (Gyamfi et al., 2002; Kim et al., 2008).
To obtain the detail data, the OTU-based community analysis was further performed because it is difficult to analyze differences of the related species using DGGE approach. 16S rDNA sequence libraries obtained from each soil samples were compared for evaluating the differences of GM and non-GM lines at the end of experiment. In conclusion, the clone libraries of four subplots, GM and non-GM lines of two crops, showed similar trends and species diversity in rarefaction curve. Moreover, the taxonomic distributions of four subplots based on phylum and class levels were similar between GM and non-GM lines. There were only slight gap between crops. The bacteria belonging to proteobacteria phylum was the most abundant in all four libraries. There were no statistically significant differences between GM and non-GM lines. The results suggested that the bacterial community structure was not significantly affected by the glufosinate-tolerant soybean and hot pepper.
To investigate the persistence of bar gene introduced into GM soybean and hot pepper in experimental field soils, quantitative real-time PCR was performed. The persistence of transgenic gene in soil has possibility of potential risk on environment for the long time (Lu, 2008). It has been already reported that transgenic DNA was detectable for several months (Widmer et al., 1996, Gebhard and Smalla, 1999). However, the level of transgenic DNA, rNPT-II, at the end of the experiment was reduced in the range from 0.03% to 0.14% compared to its
44
beginning level (Widmer et al., 1996). Likewise, in this study, the level of bar gene escaped from GM soybean was initially increased more than 10-fold in soils, but its level was gradually decreased to the initial level. In the case of GM hot pepper, the level of bar gene was repeatedly increased and decreased about four times in soil. The amount of bar gene was observed to increase depending on flowering stages in soil. The soybean once bloomed, but the hot pepper bloomed about four times during the cultivation. Although the released bar gene has been gradually degraded until the end of the experiment, it was still detectable. Therefore, it is necessary to confirm whether the gene is completely degraded or not by long-term experiment.
In conclusion, this study showed that the bacterial communities of the experimental field soils were not significantly affected by cultivation of GM soybean and hot pepper. There were not meaningful differences between GM and non-GM lines based on culture-dependent and molecular approaches. However, the released bar gene in soil was not completely degraded at the end of the experiment. Therefore, further studies are required to assess the impacts of residual transgene escaped from GM plants on soil environment.
45
LITERATURES CITED
Ahn, J.H., Kim, Y.J., Kim, T.S., Song, H.G., Kang, C.H., and Ka, J.O. 2009. Quantitative improvement of 16S rDNA DGGE analysis for soil bacterial community using real-time PCR. J. Microbiol. Methods 78, 216–222. Amann, R., W. Ludwig, and K.H. Schleifer. 1995. Phylogenetic identification and
in situ detection of individual microbial cells without cultivation. Microbiol. Rev. 59:143-169.
Ahrenholtz, I., Harms, K., De Vries, J., & Wackernagel, W. 2000. Increased Killing of Bacillus subtilison the Hair Roots of Transgenic T4 Lysozyme-Producing Potatoes. Applied and Environmental Microbiology, 66(5), 1862-1865.
Baldani, J. I., Reis, V. M., Videira, S. S., Boddey, L. H., & Baldani, V. L. D. 2014. The art of isolating nitrogen-fixing bacteria from non-leguminous plants using N-free semi-solid media: a practical guide for microbiologists. Plant and soil, 384(1-2), 413-431.
Brolsma, K. M., Vonk, J. A., Hoffland, E., Mulder, C., & de Goede, R. G. 2015. Effects of GM potato Modena on soil microbial activity and litter
decomposition fall within the range of effects found for two conventional cultivars. Biology and fertility of soils, 51(8), 913.
Caporaso, J. G., Kuczynski, J., Stombaugh, J., Bittinger, K., Bushman, F. D., Costello, E. K., ... & Huttley, G. A. 2010. QIIME allows analysis of high-throughput community sequencing data. Nature methods, 7(5), 335-336.
46
D'Halluin, K., De Block, M., Denecke, J., Janssen, J., Leemans, J., Reynaerts, A., & Botterman, J. 1992. The bar gene has selectable and screenable marker in plant engineering. Methods in enzymology, 216, 415-426.
Donegan, K. K., Palm, C. J., Fieland, V. J., Porteous, L. A., Ganio, L. M., Schaller, D. L., ... & Seidler, R. J. 1995. Changes in levels, species and DNA fingerprints of soil microorganisms associated with cotton expressing the Bacillus thuringiensis var. kurstaki endotoxin. Applied soil ecology, 2(2), 111-124.
Dunfield, K. E., & Germida, J. J. 2001. Diversity of bacterial communities in the rhizosphere and root interior of field-grown genetically modified Brassica napus. FEMS Microbiology Ecology, 38(1), 1-9.
Dunfield, K. E., & Germida, J. J. 2004. Impact of genetically modified crops on soil-and plant-associated microbial communities. Journal of
Environmental Quality, 33(3), 806-815.
Fredrickson, J. K., & Balkwill, D. L. 1998. Sampling and enumeration techniques. Techniques in microbial ecology, 239-254.
Gebhard, F., & Smalla, K. 1999. Monitoring field releases of genetically modified sugar beets for persistence of transgenic plant DNA and horizontal gene transfer. FEMS Microbiology Ecology, 28(3), 261-272.
Graham, P. H. 1969. Selective medium for growth of Rhizobium. Applied microbiology, 17(5), 769.
Gyamfi, S., U. Pfeifer, M. Stierschneider, and A. Sessitisch. 2002. Effects of transgenic glufosinate-tolerant oilseed rape (Brassica napus) and the associated herbicide application on eubacterial and Pseudomonas
47
communities in the rhizosphere. FEMS Microbiol. Ecol. 41: 181-190. Heinemann, J. A., & Traavik, T. 2004. Problems in monitoring horizontal gene
transfer in field trials of transgenic plants. Nature Biotechnology, 22(9), 1105-1109.
Hur, M., Kim, Y., Song, H. R., Kim, J. M., Im Choi, Y., & Yi, H. 2011. Effect of genetically modified poplars on soil microbial communities during the phytoremediation of waste mine tailings. Applied and environmental microbiology, 77(21), 7611-7619.
James, C. 2014. ISAAA Briefs brief 49 Global Status of Commercialized Biotech/GM Crops: 2014.
Kapur, M., Bhatia, R., Pandey, G., Pandey, J., Paul, D., & Jain, R. K. 2010. A case study for assessment of microbial community dynamics in genetically modified Bt cotton crop fields. Current microbiology, 61(2), 118-124. Keese, P. 2008. Risks from GMOs due to horizontal gene transfer. Environmental
Biosafety Research, 7(3), 123-149.
Kim, K., Islam, R., Benson, A., Joe, M. M., Denver, W., Chanratan, M., ... & Sa, T. 2016. An Overview of Different Techniques on the Microbial Community Structure, and Functional Diversity of Plant Growth Promoting Bacteria. Korean J. Soil Sci. Fert, 49(2), 144-156.
Kim, M. C., Ahn, J. H., Shin, H. C., Kim, T., Ryu, T. H., Kim, D. H., ... & Ka, J. O. 2008. Molecular analysis of bacterial community structures in paddy soils for environmental risk assessment with two varieties of genetically modified rice, Iksan 483 and Milyang 204. J Microbiol Biotechnol, 18(2), 207-218.
48
Li, W., Fu, L., Niu, B., Wu, S., & Wooley, J. 2012. Ultrafast clustering algorithms for metagenomic sequence analysis. Briefings in bioinformatics, 13(6), 656-668.
Lu, B. R. 2008. Transgene escape from GM crops and potential biosafety consequences: an environmental perspective. Collect Biosaf Rev, 4, 66-141.
Muyzer G, Smalla K. Application of denaturing gradient gel electrophoresis (DGGE) and temperature gradient gel electrophoresis (TGGE) in microbial ecology. Antonie Van Leeuwenhoek 1998; 73:127–141.
Nielsen, K. M., Bones, A. M., Smalla, K., & van Elsas, J. D. 1998. Horizontal gene transfer from transgenic plants to terrestrial bacteria–a rare event?. FEMS microbiology reviews, 22(2), 79-103.
Qaim, M. 2010. Benefits of genetically modified crops for the poor: household income, nutrition, and health. N Biotechnol, 27(5), 552-557.
doi:10.1016/j.nbt.2010.07.009
Raymond, J., Siefert, J.L., Staples, C.R., Blankenship, R.E., 2004. The natural history of nitrogen fixation. Mol. Biol. Evol. 21, 541–554.
Rieger, M. A., Lamond, M., Preston, C., Powles, S. B., & Roush, R. T. 2002. Pollen-mediated movement of herbicide resistance between commercial canola fields. Science, 296(5577), 2386-2388.
Romanowski, G., Lorenz, M. G., & Wackernagel, W. 1993. Use of polymerase chain reaction and electroporation of Escherichia coli to monitor the persistence of extracellular plasmid DNA introduced into natural soils. Applied and Environmental Microbiology, 59(10), 3438-3446.
49
Schloss, P. D., Westcott, S. L., Ryabin, T., Hall, J. R., Hartmann, M., Hollister, E. B., ... & Sahl, J. W. 2009. Introducing mothur: open-source, platform-independent, community-supported software for describing and comparing microbial communities. Applied and environmental microbiology, 75(23), 7537-7541.
Schmalenberger, A., & Tebbe, C. C. 2002. Bacterial community composition in the rhizosphere of a transgenic, herbicide-resistant maize (Zea mays) and comparison to its non-transgenic cultivar Bosphore. FEMS Microbiology Ecology, 40(1), 29-37.
Singh, A. K., Rai, G. K., Singh, M., & Dubey, S. K. 2013. Bacterial community structure in the rhizosphere of a Cry1Ac Bt-Brinjal crop and comparison to its non-transgenic counterpart in the tropical soil. Microbial ecology, 66(4), 927.
Singh, J. S., Pandey, V. C., & Singh, D. P. 2011. Efficient soil microorganisms: a new dimension for sustainable agriculture and environmental development. Agriculture, ecosystems & environment, 140(3), 339-353.
Tan, F., Wang, J., Feng, Y., Chi, G., Kong, H., Qiu, H., & Wei, S. 2010. Bt corn plants and their straw have no apparent impact on soil microbial communities. Plant and soil, 329(1), 349-364.
Thompson, C. J., Movva, N. R., Tizard, R., Crameri, R., Davies, J. E., Lauwereys, M., & Botterman, J. 1987. Characterization of the herbicide-resistance gene bar from Streptomyces hygroscopicus. The EMBO journal, 6(9), 2519.
50
Part 2 – Microbiological and Biochemical Properties. Soil Science Society of America, Madison, U.S.A.
Widmer, F., Seidler, R. J., & Watrud, L. S. 1996. Sensitive detection of transgenic plant marker gene persistence in soil microcosms. Molecular Ecology, 5(5), 603-613.
Wohlleben, W., Alijah, R., Dorendorf, J., Hillemann, D., Nussbaumer, B., & Pelzer, S. 1992. Identification and characterization of phosphinothricin-tripeptide biosynthetic genes in Streptomyces viridochromogenes. Gene, 115(1), 127-132.
Young, J.P.W., 1996. Phylogeny and taxonomy of rhizobia. Plant Soil 186, 45–52 Zehr, J.P., Jenkins, B.D., Short, S.M., Steward, G.F., 2003. Nitrogenase gene diversity and microbial community structure: a cross-system comparison. Environ. Microbiol. 5, 539–554.
Zehr, J.P., Jenkins, B.D., Short, S.M., Steward, G.F., 2003. Nitrogenase gene diversity and microbial community structure: a cross-system comparison. Environ. Microbiol. 5, 539–554.
Zhou, D., Xu, L., Gao, S., Guo, J., Luo, J., You, Q., & Que, Y. 2016. Cry1Ac transgenic sugarcane does not affect the diversity of microbial communities and has no significant effect on enzyme activities in rhizosphere soil within one crop season. Frontiers in plant science, 7.
51
기능성 형질전환 콩과 고추의
환경위해성평가를 위한 토양 미생물
군집구조의 분자생물학적 연구
윤정표
초록
1990년도에 유전자 변형 식물체가 상업적 용도로 재배된 이래로 국제 적으로 그 재배 면적이 약 100배 이상이 증가하여 현재 약 1억 8000만 헥타르에 달하고 있다. 이러한 재배되는 형질 전환 식물체는 계속해서 증가하고 있는 추세이며, 자연환경에 노출될 수 있다. 하지만 이렇게 증 가하는 추세와는 다르게 이들 유전자 변형 식물체에 의한 환경 위해성에 관한 연구가 미흡한 실정이다. 유전자 변형 식물체는 농업 환경 생태계 를 교란 시킬 수 있고, 이러한 악영향은 다른 생태계로 급속히 전파되어 전체 생태계에 큰 영향을 줄 수 있으므로 이에 대한 환경위해성을 분석 하고 평가할 필요성이 있다. 본 연구에서는 배양학적, 분자생물학적 방법을 사용하여 기능성 형질 전환 콩과 고추의 재배가 토양 미생물군집에 미치는 영향을 분석하였다.52
본 연구에 사용된 형질전환 콩 (Glycine max L. Merr)과 고추 (Capsicum
annuum L.)에는 제초제 저항성 유전자(bar)가 삽입되어 있다. 이 bar 유전
자는 Streptomyces hygroscopicus, Streptomyces viridochromogenes에서 분리된 유전자로써 phosphinothricin acetyltrasnsferase (PAT)효소를 합성함으로써 glufosinate의 독성을 불활성화 시키는 것으로 알려져 있다. 이러한 bar 유전자가 삽입된 콩과 고추를 각각 분양 받아 수원 서울대학교 LMO 격 리 포장에서 2년 동안 2회에 걸쳐 재배하며 토양 미생물상의 변화를 비 교 분석하였다. GM콩, Non-GM콩과 GM고추, Non-GM 고추를 재배한 토 양을 대상으로 하여 약 10-14일 정도의 간격을 두고 근권토양에서 토양 시료를 채집하였다. 먼저 배양학적인 방법으로 토착미생물상에 미치는 영향을 조사한 결과, 작물이 재배되는 토양에 서식하는 주요 토양미생물 인 세균, 방선균, 곰팡이, 질소고정균의 밀도는 실험기간 동안에 GM과 Non-GM 사이에 유의미한 차이가 없는 것으로 나타났다. 또한 전체 토양 미생물의 DNA를 대상으로 16S rRNA 유전자를 PCR로 증폭하고 Real-time PCR-DGGE (Denaturing gradient gel electrophoresis) 분석을 한 결과, 작 물의 재배기간 동안 작물 간에는 토양미생물의 군집구조가 서로 다른 것 으로 나타났으나, GM과 Non-GM사이에는 커다란 차이가 없이 유사한 것 으로 관찰되었다. Bionumerics 프로그램을 이용하여 DGGE 밴드에 대한 유사도를 분석해본 결과, 작물간에는 유의미한 차이가 나타났지만, GM과 non-GM의 밴드패턴은 높은 유사도를 보이며 clustering됨을 확인할 수 있 었다. 토양 세균 군집분포를 계통학적 방법으로 분석하기 위해 2016년
53
실험이 종료된 GM과 non-GM 콩, GM과 non-GM 고추 근권토양 시료를 대상으로 Illumina MiSeq platform을 통한 16S rRNA sequencing으로 미생물 군집 분포에 대한 정보를 분석해본 결과, 작물간에는 약간의 차이가 있 었지만 GM과 non-GM사이에 토양 미생물 군집은 유사한 것으로 나타났 다. Quantitative Real-time PCR을 통한 도입유전자 (bar)의 재식 토양에서 잔류성을 분석한 결과, GM콩에 도입된 제초제 저항성 유전자는 재식 후 개화기에 약 10배 이상 증가하였지만 재식 종료 때까지는 background 수 준으로 감소하였다. 반면 GM고추는 재식기간 동안 약 3-4회 정도 증가 와 감소를 반복하였지만 결국 재식 종료 때에 이르러서는 background수 준으로 감소하는 경향을 나타내었다. 제초제 저항성이 삽입된 형질전환 콩과 고추가 토양 미생물상에 미치 는 영향성에 대한 실험 결과, 형질전환 콩과 고추는 재식기간 동안 토양 미생물 군집상에 별다른 영향을 주지 않았으며, 재식 토양에 유출되었던 도입 유전자가 시간이 지남에 따라 점차 분해되어 없어지는 경향을 보이 는 것으로 관찰되어 제초제 저항성 유전자 (bar)가 도입된 작물의 재배 가 토양미생물상에 큰 영향을 주지는 않을 것으로 판단된다. 주요어: 기능성 형질전환 콩과 고추, 토양 미생물 군집, Real-time PCR-DGGE, Illumina MiSeq platform, 유전자 잔류성