RESEARCH ARTICLE
Received: June 28, 2017, Revised: August 8, 2017, Accepted: September 7, 2017 ISSN 1598-4478 (Print) / ISSN 2233-7679 (Online)
†
Correspondence to: Hyun-Ok Lee
Department of Dental Hygiene, Wonkwang Health Science University, 514 Iksan-daero, Iksan 54538, Korea Tel: +82-63-860-1265, Fax: +82-63-840-1269, E-mail: [email protected]
Copyright © 2017 by Journal of Dental Hygiene Science
Association of Psychological Health and Perceived Oral Health in Elderly Individuals:
Focusing on Depression, Stress, and Suicidal Ideation
Hyun-Ok Lee † , Sun-Mi Kim, and Ji-Young Park
Department of Dental Hygiene, Wonkwang Health Science University, Iksan 54538, Korea
The present study aimed to examine the influence of mental health factors on oral health factors using data from the Korean National Health and Nutrition Examination Survey (KNHANES). A total of 1,548 elderly individuals aged over 65 years who completed the screening and health questionnaire were selected as the final study participants. The psychological health factors related to perceived oral health status were depression and stress when the gender was controlled, and in terms of gender, both elderly male and female individuals were stressed and depressed. These results suggested that the psychological health of elderly individuals negatively affects not only perceived oral health but also the quality of life. In addition, the psychological health of the elderly individuals should be systematically managed along with oral health care and overall health care and lifestyle. If a comprehensive health management system is available for low-income groups or an elderly person living alone, it should positively affect and improve the quality of life of elderly individuals.
Key Words: Aged, Mental health, Oral health status
Introduction
The aging of population is occurring rapidly given the population distribution characteristics of Korea. Thus, with the rapid growth of the elderly population, elderly individuals will account for 40.1% of the entire population by 2060 1) . As such, successful aging and policies on the health management of elderly individuals have been a topic of interest, which help lengthen the lifespan of the rapidly growing elderly population. The period of old age is marked by several important health concerns, such as weakening of physical functions, disorders related to old age, and changes in social and psychological disposition and mental adaptation, and these problems commonly cause depression 2,3) , which is a common psychological response to negative emotions and losses, such as death of a spouse or other loved one, economic instability, and psychological changes after decreased motor functions 3)
The inability to perceive depression as a problem may lead to health issues, such as physical, cognitive, and social disorders, which decrease the quality of life and increase the risk of suicide 2) and sleeping disorders 3) .
Despite such rapid social changes, the mortality rate of
suicide in Korea remains the highest among the member
countries of the Organisation for Economic Co-operation
and Development. The rates of successful suicide are
8.0% for individuals below 65 years and 31.8% for elderly
individuals over 65 years. The average number of suicides
per 100,000 population were 42.4 for individuals aged 60
years, 73.1 for individuals aged 70 years, and 104.5 for
individuals aged 80 years 4) . In other words, the success
rates of suicides in elderly individuals was high. In
addition, the possibility of suicide attempts increases with
age. Thus, the identification of prevention methods by first
recognizing suicide-related factors as early as possible is
important 5) . Moreover, the psychological health of elderly
individuals is influenced by demographic, economic, physical, and psychological factors, such as stress and sleep duration. In addition, it significantly affects behavior or health status 5) . However, numerous studies consider elderly individuals as a homogeneous group and tend to overlook the diversity within the group, indicating the need for a specific and differentiating study that specifies demographic or socioeconomic factors 2,3) .
With the perception that quality of life affects oral health, the perception of perceived oral health and its objectives should be improved 6) . Perceived oral health is easier to use in projects related to oral health compared to the traditionally used objective and can be an accurate predictor of oral health since it measures the perceived level of oral health when an individual predicts his/her own oral health. Moreover, it can be used as evaluation criteria for the burden of oral diseases and a useful summary indicator 7) . Finlayson et al. 7) reported that higher levels of stress lead to higher levels of perceived oral health. Ma and Cho 8) identified that stress and depression influence the oral health of adolescents. Moreover, Won and Kim 9) studied the perceived oral health of adults, which is associated with mental counselling, higher levels of stress, depression, and presence of suicidal ideation.
These studies have generally focused on adults and adolescents, and studies on elderly individuals are limited.
Thus, the present study used the raw data from Korean National Health and Nutrition Examination Survey (KNHANES) to identify the association between the perceived oral health of elderly individuals and various factors that affect psychological health, such as stress, depression, and suicidal ideation in terms of gender. In addition, the results were presented as basic data that improve oral and psychological health.
Materials and Methods
1. Subjects
This study has utilized the raw data of the 6th KNHANES conducted in 2015, which are used for goal setting to improve the health of citizens and develop and evaluate health projects through the statistics of the
general health levels, health-related behaviors, and food and nutrition intake of the population 10) . These data are obtained from the health, check-up, and nutrition survey 10) . A total of 1,548 elderly individuals aged over 65 years who have completed the health survey were included in the study. Based on a study by Won and Kim 9) , the independent variables included gender (male and female), age (65∼69, 70∼74, 75∼79, and over 80 years old) and the presence of a spouse (yes or no). The socioeconomic characteristics included the level of education (no education, elementary school, middle school, or over), economic activity (yes or no), and household income (high, medium high, medium low, and low). Factors that affect mental health included symptoms of depression (depression for more than 2 weeks or none), stress perception (low and high), and experience of suicidal ideation (yes or no). The dependent variable of oral health was measured through face-to-face interviews on perceived oral health and reclassified as very good, good, average as “good” and bad, and very bad as “bad.”
2. Methods
KNHANES has a complex sample design where sample
extraction methods determine representation, and data
were analyzed using yearly weights. The domain variables
were analyzed using complex sample analysis methods,
and the stated values (n) were actual observed values and
percentages that are reflected as sample weights. For the
general characteristics, descriptive statistics and frequency
analysis were used. The relationship between demo-
graphic statistics and psychological health was analyzed
using chi-squared tests. The influence of psychological
health on perceived oral health that depend on the
participant’s psychological health, perceived oral health,
and gender was analyzed through logistic regression
analysis. OR and 95% CI were calculated, and a p-value of
0.05 was considered statistically significant. STATA 11.0
SE (Stata Co., College Station, TX, USA) was used in the
analysis. This study was passed at Wonkwang University
with IRB exemption (WKIRB-201705-SB-023).
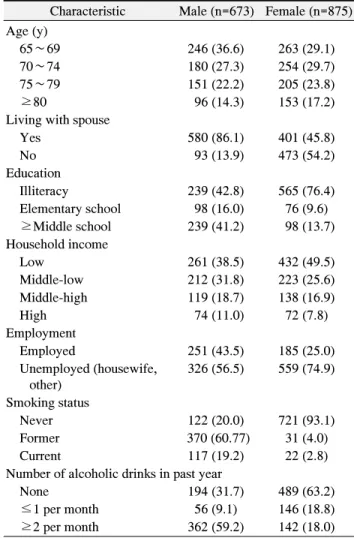
Table 1. Distribution and Rate of Study Subjects by Demographic Characteristics (n=1,548)
Characteristic Male (n=673) Female (n=875) Age (y)
65∼69 246 (36.6) 263 (29.1)
70∼74 180 (27.3) 254 (29.7)
75∼79 151 (22.2) 205 (23.8)
≥80 96 (14.3) 153 (17.2)
Living with spouse
Yes 580 (86.1) 401 (45.8)
No 93 (13.9) 473 (54.2)
Education
Illiteracy 239 (42.8) 565 (76.4)
Elementary school 98 (16.0) 76 (9.6) ≥Middle school 239 (41.2) 98 (13.7) Household income
Low 261 (38.5) 432 (49.5)
Middle-low 212 (31.8) 223 (25.6)
Middle-high 119 (18.7) 138 (16.9)
High 74 (11.0) 72 (7.8)
Employment
Employed 251 (43.5) 185 (25.0)
Unemployed (housewife, other)
326 (56.5) 559 (74.9)
Smoking status
Never 122 (20.0) 721 (93.1)
Former 370 (60.77) 31 (4.0)
Current 117 (19.2) 22 (2.8)
Number of alcoholic drinks in past year
None 194 (31.7) 489 (63.2)
≤1 per month 56 (9.1) 146 (18.8)
≥2 per month 362 (59.2) 142 (18.0) Values are presented as n (%). Percentages (%) reflect sample weights.
Results
1. Demographic characteristics
The participants were aged between 65 and 69 years. The majority of male participants were married, and the majority of female participants were unmarried. In terms of education level, most of the participants in the group answered “none.”
In terms of income, low-level income was significant irrespective of gender, and with regard to economic activity, most participants did not participate in economic activities.
In terms of smoking, the male participants indicated that they were former smokers. As to alcohol consumption, most of the participants in the group indicated they drank more than twice a month. Most of female participants are
non-smokers and non-drinkers (Table 1).
2. Relationship between demographic characteristics and psychological health
In terms of stress, statistically significant differences were observed in male participants who had spouses and income and in female participants who had income (p
<0.05; Table 2). In terms of depression symptoms, no significant differences were observed in male participants who had spouses (p<0.001) and income and those who participated in economic activities (p<0.01). In the case of female participants, statistically significant differences were observed in terms of income (p<0.01). With regard to suicidal ideation, significant differences were noted in male participants in terms of age, marital status, income, and economic activity (p<0.001). Statistical differences were also observed in female participants in terms of age (p<0.01) and economic activity (p<0.05).
3. Influence of the psychological health of patients on perceived oral health
To observe the influence of psychological health on perceived oral health, a logistic regression analysis was conducted after adjusting for gender, age, level of education, presence of spouse, income, and economic activity (Table 3). The results indicated that depression and stress influenced the perceived oral health of patients.
The perceived oral health was 1.60 times higher in participants who continuously experienced depression for more than 2 weeks versus those who did not and 1.70 times higher in participants who were stressed versus those who were not (p<0.05).
4. Influence of the psychological health of patients on perceived oral health in terms of gender
To observe the influence of psychological health on
perceived oral health in terms of gender, a logistic
regression analysis was conducted after adjusting for age,
level of education, presence of spouse, income, and
economic activity (Table 4). Depression affected the
perceived oral health of male participants, and depression
and stress influenced the perceived oral health of female
participants. The perceived oral health was 1.60 times
Tab le 2. D istr ib utio n an d Rate o f Stud y Su bje cts b y Ps ycho lo gi cal Hea lt h C harac teris tic D aily stre ss D ep ress ed co nditio ns Su icida l idea tion M ale (n =60 9) Fe m ale ( n= 627 ) M ale ( n= 610 ) Fem ale (n =77 5) M ale ( n= 608 ) Fem ale ( n=7 75) Ye s No Yes No Yes No Ye s No Ye s No Ye s No Ag e (y ) 65 ∼ 69 37 ( 5.6 ) 196 (3 2.0) 51 ( 6.5 ) 194 ( 23 .8) 34 ( 5.0) 19 9 ( 32.5 ) 55 ( 6.7 ) 19 0 ( 23.6 ) 14 ( 1.9 ) 219 ( 35 .7) 17 ( 2.1 ) 228 (2 8.2) 70 ∼ 74 24 ( 4.0 ) 140 (2 3.5) 54 ( 7.0 ) 174 ( 22 .8) 17 ( 2.9) 14 7 ( 24.6 ) 47 ( 5.7 ) 18 1 ( 24.0 ) 10 ( 1.7 ) 153 ( 25 .7) 17 ( 2.5 ) 211 (2 7.2) 75 ∼ 79 14 ( 2.4 ) 123 (2 0.2) 46 ( 6.2 ) 139 ( 18 .5) 15 ( 2.5) 12 3 ( 19.9 ) 31 ( 4.4 ) 15 4 ( 20.3 ) 6 ( 1.1 ) 131 ( 21 .2) 9 ( 1.4 ) 176 (2 3.3) ≥ 80 7 ( 1.2 ) 68 (1 1.1) 25 ( 3.4 ) 91 ( 11 .3) 7 ( 0.8) 68 ( 11.4 ) 25 ( 3.1) 92 ( 11.8 ) 7 ( 0.9 ) 68 ( 11 .4) 17 ( 2.4 ) 100 (1 2.5) χ
23.6 9 1.20 2.57 2.22 2.0 8* 9.93 ** Living w ith spou se Y es 61 (9.8 ) 466 (7 7.4) 87 (11.3 ) 263 (33 .8) 49 (7.5) 47 9 (79.7 ) 6 8 ( 8.2) 28 2 ( 36.9 ) 24 ( 3.7 ) 502 ( 83 .5) 24 ( 3.2 ) 326 (4 1.9) N o 21 (3.4 ) 61 (9 .2) 89 (11.9 ) 335 (42 .7) 24 (3.8) 58 (8.8) 90 (11 .8 ) 33 5 ( 43.0 ) 13 ( 2.0 ) 69 ( 10 .6) 36 ( 5.3 ) 389 (4 9.5) χ
211 .99* ** 1.63 26 .9** * 0.36 15.82 *** 0.69 Educ ation Illite ra cy 41 (7.3 ) 190 (3 4.7) 13 1 (19.0 ) 404 (56 .8) 34 (6.0) 19 7 ( 36.0 ) 11 2 ( 15.8 ) 42 3 ( 59.9 ) 18 ( 3.0 ) 213 ( 39 .0) 40 ( 6.4 ) 495 (6 9.4) Elem en tary scho ol 9 (1.4 ) 88 (1 4.7) 12 (1.9) 64 (8.2) 10 (1.6) 87 ( 14.5 ) 14 ( 1.5) 62 ( 8.5) 7 ( 1.0 ) 90 ( 15 .1) 2 ( 0.2 ) 74 (9 .8) ≥ M iddle sc hoo l 25 ( 4.5 ) 212 (3 7.1) 16 ( 2.4) 80 ( 11 .6) 22 ( 3.5) 21 5 ( 38 .1 ) 13 ( 1.9) 83 ( 12.1 ) 9 ( 1.6 ) 228 ( 40 .0) 10 ( 1.6 ) 86 (1 2.4) χ
26.8 9 5.04 3.56 2.89 3.5 9 3.82 H ouseh old in com e Low 31 (5.1 ) 196 (3 1.4) 92 (11.8 ) 289 (37 .6) 29 (4.6) 19 9 (32.0 ) 97 ( 12.1 ) 28 4 ( 37.3 ) 23 ( 3.5 ) 204 ( 33 .1) 32 ( 4.3 ) 349 (4 5.1) Mid dle-low 25 (4.0 ) 177 (2 9.2) 48 (4.0) 150 (18 .8) 27 (4.2) 17 5 ( 29.0 ) 32 ( 4.0) 16 6 ( 21.3 ) 11 ( 1.8 ) 190 ( 31 .4) 13 ( 1.9 ) 185 (2 3.4) Mid dle-hig h 17 (3.0 ) 90 (1 5.5) 23 (7.0) 100 (13 .5) 13 (1.9) 94 (1 6.5 ) 18 ( 2.6) 10 6 ( 14.4 ) 3 ( 0.4 ) 104 ( 18 .1) 7 ( 1.1 ) 117 (1 6.0) H igh 9 (1.1 ) 61 (1 0.3) 11 (1.4) 54 (6.6) 4 (0.6) 66 (10.8 ) 8 (1.0) 57 ( 6.9) 0 ( 0.0 ) 70 ( 11 .5) 6 ( 0.9 ) 59 (7 .1) χ
210.7 6* 6.49 ** 3.08* * 13 .54* * 13.12 *** 1.57 Em ploy m ent Em ploy ed 36 (6.2 ) 211 (3 6.8) 46 (6.6) 133 (18 .7) 20 (3.0) 22 8 (40 .0 ) 34 ( 5.1) 14 5 ( 20.2 ) 7 ( 1.1 ) 240 ( 41 .8) 7 ( 1.1 ) 172 (2 4.1) U nem ploye d (housew ife, other) 39 ( 7.1 ) 279 (4 9.7) 11 5 ( 16.8 ) 417 ( 57 .9) 46 ( 8.1) 27 2 ( 48.7 ) 10 7 ( 14 .4 ) 42 6 ( 60.1 ) 27 ( 4.5 ) 291 ( 52 .3) 45 ( 7.0 ) 488 (6 7.6) χ
20.6 4 1.27 5. 54* * 0.08 15.8 *** 4.0* Valu es ar e p resen ted as n (%). P ercentag es (%) r ef lect samp le w eights . *p < 0.05 , **p < 0.0 1, ** *p < 0.00 1, by chi- squa re test.
Table 4. Association between Psychological Health and Perceived Oral Health by Gender
Variable
aPerceived oral health status
Male Female
Good Bad OR 95% CI p>t
bGood Bad OR 95% CI p>t
bDepressed conditions
No 235 (42.6) 261 (45.6) Ref. 274 (39.3) 291 (41.5) Ref.
Yes 21 (3.3) 47 (8.5) 1.60 1.06∼2.40 0.021 56 (7.9) 82 (11.3) 2.46 0.37∼4.41 0.003 Daily stress
No 227 (40.8) 260 (45.5) Ref. 270 (38.4) 275 (38.4) Ref.
Yes 28 (5.0) 48 (8.7) 1.05 0.90∼1.57 0.232 60 (8.8) 98 (14.4) 1.39 1.07∼1.80 0.046 Suicidal ideation
No 242 (43.7) 287 (50.5) Ref. 308 (43.6) 346 (48.5) Ref.
Yes 13 (2.1) 21 (3.7) 0.85 0.49∼1.48 0.565 22 (3.6) 27 (4.3) 1.41 0.70∼2.85 0.335 Values are presented as n (%). Percentages (%) reflect sample weights.
OR: odds ratio, 95% CI: 95% confidence interval, ref.: reference.
a
Adjusted for age, education, living with spouse, household income and employment.
bBy logistic regression.
Table 3. Association between Psychological Health and Perceived Oral Health Status
Variable
aPerceived oral health status Good
(n=586)
Bad
(n=681) OR 95% CI p>t
bDepressed conditions
No 509 (40.7) 552 (43.3) Ref.
Yes 77 (5.8) 129 (10.0) 1.60 1.06∼2.40 0.020 Daily stress
No 497 (41.5) 535 (39.4) Ref.
Yes 88 (7.1) 146 (11.9) 1.70 0.49∼1.00 0.044 Suicidal ideation
No 550 (43.6) 633 (49.3) Ref.
Yes 35 (2.8) 48 (4.0) 1.29 0.75∼2.22 0.352 Values are presented as n (%). Percentages (%) reflect sample weights.
OR: odds ratio, 95% CI: 95% confidence interval, ref.: reference.
a