141
ABSTRACT
Purpose: Numerous studies have shown that the frequency of myeloid-derived suppressor cells (MDSCs) is associated with tumor progression, metastasis, and recurrence. Chemokine (C-C motif ) ligand 3 (CCL3) may be secreted by tumor cells and attract MDSCs into
the tumor microenvironment. In the present study, we aimed to explore the molecular mechanisms whereby CCL3 is involved in the interaction of breast cancer cells and MDSCs.
Methods: The expression of CCL3 and its receptors was investigated using real-time polymerase chain reaction, western blotting, and enzyme-linked immunosorbent assay. The cell counting Kit-8, wound healing, and transwell assays were performed to study cell growth, migration, and invasion. Cell cycling, apoptosis, and the frequency of MDSCs were investigated through flow cytometry. Transwell assays were used for co-culture and chemotaxis detection.
Markers of the epithelial-mesenchymal transition (EMT) were determined with western blotting. The role of CCL3 in vivo was studied via tumor xenograft experiments.
Results: CCL3 promoted cell proliferation, migration, invasion, and cycling, and inhibited apoptosis of breast cancer cells in vitro. Blocking CCL3 in vivo inhibited tumor growth and metastases. The frequency of MDSCs in patients with breast cancer was higher than that in healthy donors. Additionally, MDSCs might be recruited by CCL3. Co-culture with MDSCs activated the phosphoinositide 3-kinase-protein kinase B-mammalian target of rapamycin (PI3K-Akt-mTOR) pathway and promoted the EMT in breast cancer cells, and their proliferation, migration, and invasion significantly increased. These changes were not observed when breast cancer cells with CCL3 knockdown were co-cultured with MDSCs.
Conclusion: CCL3 promoted the growth of breast cancer cells, and MDSCs recruited by CCL3 interacted with these cells and then activated the PI3K-Akt-mTOR pathway, which led to EMT and promoted the migration and invasion of the cells.
Original Article
Received: Sep 11, 2019 Accepted: Apr 5, 2020 Correspondence to Xinhan Zhao
Department of Oncology, First Affiliated Hospital of Medical School of Xi'an Jiaotong University, 227 Yanta West Road, Xi'an, Shaanxi 710061, China.
E-mail: [email protected]
© 2020 Korean Breast Cancer Society This is an Open Access article distributed under the terms of the Creative Commons Attribution Non-Commercial License (https://
creativecommons.org/licenses/by-nc/4.0/) which permits unrestricted non-commercial use, distribution, and reproduction in any medium, provided the original work is properly cited.
ORCID iDs Anqi Luo
https://orcid.org/0000-0002-0942-6687 Min Meng
https://orcid.org/0000-0002-1977-4650 Guanying Wang
https://orcid.org/0000-0002-5868-2943 Rui Han
https://orcid.org/0000-0003-2612-3570 Yujiao Zhang
https://orcid.org/0000-0002-8820-1602 Xin Jing
https://orcid.org/0000-0002-4671-3706 Lin Zhao
https://orcid.org/0000-0002-2852-8558 Shanzhi Gu
https://orcid.org/0000-0001-6099-4543 Xinhan Zhao
https://orcid.org/0000-0002-8525-4178
Anqi Luo 1, Min Meng 2, Guanying Wang 3, Rui Han 4, Yujiao Zhang 3, Xin Jing 3, Lin Zhao 3, Shanzhi Gu 5, Xinhan Zhao 3
1 Department of Nuclear medicine, National Cancer Center/Cancer Hospital, Chinese Academy of Medical Sciences and Peking Union Medical College, Beijing, China
2Department of Oncology, Shandong Provincial Hospital Affiliated with Shandong University, Jinan, China
3 Department of Oncology, First Affiliated Hospital of Medical School of Xi'an Jiaotong University, Xi'an, China
4Department of Oncology, First Affiliated Hospital of Zhengzhou University, Zhengzhou, China
5Department of Forensic Medicine, Medical School of Xi'an Jiaotong University, Xi'an, China
Myeloid-Derived Suppressor Cells Recruited by Chemokine (C-C Motif) Ligand 3 Promote the Progression of Breast Cancer via Phosphoinositide 3-Kinase-Protein Kinase B-Mammalian Target of Rapamycin Signaling
https://ejbc.kr
Funding
This study was supported by the National Natural Science Foundation of China (No.
8167102406).
Conflict of Interest
The authors declare that they have no competing interests.
Author Contributions
Conceptualization: Luo A; Data curation:
Luo A, Han R; Formal analysis: Meng M;
Investigation: Wang G; Software: Jing X;
Supervision: Zhang Y, Zhao L; Validation: Gu S;
Writing - original draft: Luo A; Writing - review
& editing: Zhao X.
Keywords: Breast neoplasms; Chemokine CCL3; Epithelial-mesenchymal transition;
Myeloid-derived suppressor cells; Tumor microenvironment
INTRODUCTION
Tumor growth, invasion, and metastasis are all inseparable from the tumor
microenvironment. The stability of the tumor microenvironment provides the basis for cell metabolism, proliferation, and differentiation. The tumor microenvironment is composed of tumor parenchymal cells, fibroblasts, immune cells, adipocytes, blood vessels, and lymphatic vessels [1]. As an important part of the tumor microenvironment, immune cells play a unique role in immunotherapy. These include T, B, antigen-presenting, natural killer, and myeloid suppressor cells. The interactions between tumors and the immune system are inseparable from the multiple types of immune cell.
Myeloid-derived suppressor cells (MDSCs) are an important class of immunosuppressive cells found in a variety of tumors that form a group of primitive myeloid cells with no differentiation potential. MDSCs in humans and mice are divided into 2 types, namely, monocyte-type MDSCs (Mo-MDSCs) and polymorphonuclear-type MDSCs (PMN-MDSCs). MDSCs
accumulate in most malignant tumors in mice and humans, and promote cancer progression by inhibiting antitumor immune responses, promoting angiogenesis, and creating a pre- metastatic environment. Through this mechanism tumors may evade the control by the immune system and impair the efficacy of the anticancer immunotherapy [2,3].
Tumor cells recruit MDSCs via chemokines such as CCL2, CCL3, and chemokine C-X-C motif 12 (CXCL12), and immune factors such as the granulocyte macrophage colony-stimulating factor (GM-CSF), interleukin (IL)-1β, and transforming growth factor (TGF)-β. MDSCs have many functions in tumors, such as immunosuppression and promoting tumor angiogenesis, growth, metastasis, and matrix deposition. Many studies have indicated that the proportion of MDSCs in the peripheral blood is significantly increased in a variety of tumors such as breast, pancreatic, gastric, and esophageal cancers, and melanoma; a high number of MDSCs are associated with poor prognosis [4-6]. When MDSCs are recruited into the tumor microenvironment, they interact with tumor cells. Studies have shown that MDSCs may promote the epithelial-mesenchymal transition (EMT) and activate multiple signaling pathways in tumor cells to promote tumor cell migration and distant metastasis [7-9]. The phosphoinositide 3-kinase (PI3K) pathway is involved in chemotaxis of leukocytes in vivo and regulates the function of MDSCs. A downstream component of the PI3K pathway, namely mammalian target of rapamycin (mTOR), affects the production of myeloid cells, which may be related to the production of MDSCs [10,11]. In addition, the activation of the PI3K pathway is closely related to the occurrence and development of tumors and affects the prognosis and therapeutic effects in patients with cancer [12,13].
However, the role of CCL3 in the interaction between breast cancer cells and MDSCs, the specific mechanism, as well as, which signaling pathway is activated are still unclear.
In the present study, we conducted in vitro and in vivo experiments to analyze the effect of CCL3 on breast cancer cells and their interaction with MDSCs, and investigated the potential underlying mechanisms. Results demonstrated that the CCL3–C-C chemokine receptor 5 (CCR5) axis is essential for the growth of breast cancer cells, and CCL3 plays a vital role in promoting EMT via the PI3K-protein kinase B (Akt)-mTOR signaling pathway in breast cancer cells when co-cultured with MDSCs.
Myeloid-Derived Suppressor Cells Promoted the Progression of Breast Cancer
METHODS
Patients and samples
Peripheral blood sample was collected from 48 patients with breast cancer and 44 healthy donors. All patients were diagnosed from June 2017 to May 2019 at the Department of Breast Surgery, First Affiliated Hospital of Medical School of Xi'an Jiaotong University. The patients included in this study received no treatment such as surgery or chemotherapy. Meanwhile, these patients had no other malignant tumor along with breast cancer and their record data were complete. The experimental protocol was approved by the Human Ethics Review Board of the First Affiliated Hospital of Medical School of Xi'an Jiaotong University and written informed consent was obtained from all subjects (Institutional Review Board approval number: XJTUIAF2019LSK-035).
Cell culture
Human breast cancer MDA-MB-231, MCF-7, T47D, and SK-BR-3 cell lines, or mouse breast cancer 4T1 cell line at passages 3 to 15 were obtained from Shanghai Cell Bank, Chinese Academy of Sciences (Shanghai, China). Cells were cultured in the following media: DMEM, Leibovitz's L15, or RPMI1640 supplemented with 10% fetal bovine serum (FBS; Gibco, Grand Island, USA) in a humidified 5% CO2 incubator at 37°C.
MDSCs analysis and isolation
Peripheral blood of patients with breast cancer was collected in tubes with
ethylenediaminetetraacetic acid anticoagulant and transported at 4°C. Peripheral blood mononuclear cells (PBMCs) were isolated from blood with the Ficoll-Paque plus (Amersham Biosciences, Piscataway, USA) density gradient centrifugation. PBMCs were stained with CD33 (BioLegend Inc., San Diego, USA), HLA-DR (BD Biosciences, Franklin Lakes, USA), CD14 (BioLegend Inc.), and CD15 (BD Biosciences) for 2 hours. Then, MDSCs stained with CD33 and HLA-DR were sorted on a FACS Aria cell sorter (BD, San Diego, USA). Finally, different subsets of MDSCs were analyzed through flow cytometry. This process yielded a cell-type suspension with purity > 95%.
Real-time polymerase chain reaction (RT-PCR)
Total RNA was extracted from tissues using TRIzol (Invitrogen; Thermo Fisher Scientific Inc., Waltham, USA) according to the manufacturer's protocol. Synthesis of cDNA was performed using the TaKaRa PrimeScript® RT reagent Kit (Takara Bio Inc., Shiga, Japan).
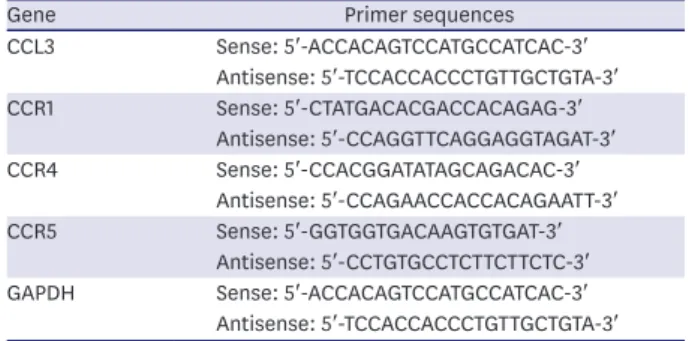
Quantitative RT-PCR was performed using the SYBR Premix Ex Taq TM system (TaKaRa Bio Inc.); primer sequences are listed in Table 1. The target gene expression was normalized to glyceraldehyde 3-phosphate dehydrogenase and calculated using the comparative threshold cycle (2−ΔΔCT) method.
Western blot analysis
Cells were lysed in RIPA buffer in the presence of protease and phosphatase inhibitor.
Samples were separated in sodium dodecyl sulphate-polyacrylamide gel electrophoresis and transferred to nitrocellulose membranes (Invitrogen). The membranes were blocked for 2 hours at 30oC and then with primary antibodies diluted in Tris buffer saline-Triton X at 4oC overnight. The membranes were washed and incubated with the appropriate secondary antibodies (1:10,000; Cat. No. 93702; Cell Signaling Technology Inc., Danvers, USA). The primary antibodies included were: E-cadherin (1:1,000; Cat. No. 3195), N-cadherin (1:1,000;
Cat. No. 13116), vimentin (1:1,000; Cat. No. 5741), Akt (1:1,000; Cat. No. 4685), p-Akt 143 https://ejbc.kr https://doi.org/10.4048/jbc.2020.23.e26
(1:1,000; Cat. No. 4060), mTOR (1:1,000; Cat. No. 2983), p-mTOR (1:1,000; Cat. No. 5536), proliferating cell nuclear antigen (PCNA; 1:1,000; Cat. No. 5536) (Cell Signaling Technology Inc.), occludin (1:1,000; Cat. No. ab167161), CCR5 (1:1,000; Cat. No. ab65850), Snail (1:1,000; Cat. No. ab53519), matrix metalloproteinase-1 (MMP1) (1:1,000; Cat. No. ab137332), MMP2 (1:1,000; Cat. No. ab37150), and MMP9 (1:1,000; Cat. No. ab38898; Abcam,
Cambridge, USA). The pathway inhibitors used in the assay were PI3K inhibitor-LY294002 (20 μM, pretreated for 12 hours; Cat. No. S1105; Selleck Chemicals, Houston, USA) and Akt inhibitor-MK2206 (1 μM, pretreated for 12 hours; Cat. No. S1078; Selleck Chemicals).
Enzyme-linked immunosorbent assay (ELISA)
The supernatants of 4 types of breast cancer cells were collected after 24, 48, and 72 hours.
The supernatants of the breast cancer cells with CCL3-knockdown were collected after 24 hours. The CCL3 levels of these supernatants were detected with the CCL3 ELISA kit (Cat. No.
PDMA00; R&D Systems Inc., Minneapolis, USA) according to the manufacturer's instructions.
Three wells per condition were tested and all experiments were repeated in triplicates.
SiRNA transfection
The transient transfection with small interfering RNAs (siRNAs) specific for CCL3 was performed with Lipofectamine 2000 (Invitrogen) according to the manufacturer's instructions. Negative control siRNAs and siRNA targeting CCL3 (Si-CCL3:
5′-CGGCAGAUUCCACAGAAUUTT-3′, 5′-AAUUCUGUGGAAUCUGCCGGG-3′) were synthesized by Qiagen (Cat. No. SI03078439; Hilden, Germany). CCL3 protein and mRNA levels were analyzed through RT-PCR and ELISA.
Cell counting kit-8 (CCK-8) assay
Cells were cultured in a 96-well plate with 5,000 cells/well. CCK-8 solution (10 µL; CCK-8;
Dojindo Molecular Technologies Inc., Kumamoto, Japan) was added to each well for different amounts of time (24 and 48 hours) and incubated for 2 hours at 37°C. Cell proliferation was determined measuring the absorbance at 450 nm.
Cell cycle analysis
Some groups of cells were cultured at different CCL3 concentrations (1 and 10 nM; Cat. No.
300-08; Peprotech, Rocky Hill, USA), whereas another group of cells was pretreated with the CCR5 inhibitor (DAPTA; 1 nM; Cat. No. S8501; Selleck Chemicals) for 4 hours and then treated with CCL3. Otherwise, cells were transfected with specific siRNA targeting CCL3.
After 24 hours, cells were treated with 75% ethanol at 4°C overnight, washed with phosphate buffer saline (PBS), and resuspended. The cell cycle was analyzed through flow cytometry Myeloid-Derived Suppressor Cells Promoted the Progression of Breast Cancer
Table 1. The RT-PCR primer sequences of interested genes
Gene Primer sequences
CCL3 Sense: 5′-ACCACAGTCCATGCCATCAC-3′
Antisense: 5′-TCCACCACCCTGTTGCTGTA-3′
CCR1 Sense: 5′-CTATGACACGACCACAGAG-3′
Antisense: 5′-CCAGGTTCAGGAGGTAGAT-3′
CCR4 Sense: 5′-CCACGGATATAGCAGACAC-3′
Antisense: 5′-CCAGAACCACCACAGAATT-3′
CCR5 Sense: 5′-GGTGGTGACAAGTGTGAT-3′
Antisense: 5′-CCTGTGCCTCTTCTTCTC-3′
GAPDH Sense: 5′-ACCACAGTCCATGCCATCAC-3′
Antisense: 5′-TCCACCACCCTGTTGCTGTA-3′
RT-PCR = real-time polymerase chain reaction.
after staining with propidium iodide (BD Pharmingen, Franklin Lakes, USA) and RNaseA (BD Pharmingen) according to the manufacturer's instructions.
Apoptotic analysis
Cells were cultured with different CCL3 concentrations (1 and 10 nM) or pretreated with DAPTA for 4 hours and then treated with CCL3. Otherwise, cells were transfected with specific siRNA targeting CCL3. After 24 hours, cells were stained with Annexin-V (BD Biosciences) and 7-AAD (BD Biosciences), and analyzed through flow cytometry.
Wound healing assay
Cells pretreated with CCL3 or pretreated with DAPTA for 4 hours and then treated with CCL3 were plated in 6-well plates, cultured in serum-free medium for 24 hours, and then scratched using a sterile 20-µL pipette tip. Cell cultures were washed with PBS, serum-free medium was added to the cells, and the wound size recorded at 0 and 24 hours using an inverted light microscope (Nikon Eclipse TS 100; Nikon Corporation, Tokyo, Japan). The migration rate was measured according to the changes of the wound width.
Transwell migration and invasion assay
Breast cancer cells pretreated with CCL3, DAPTA for 4 hours and then CCL3, or co-cultured with MDSCs were seeded on the upper chambers of 24-well transwell inserts (8 μm; Millipore, Billerica, USA). For the invasion assay, the underside of the insert membrane was coated with Matrigel (BD Biosciences). The bottom well contained 500 µL of RPMI-1640 medium containing 10% FBS. After 24 hours (migration assay) or 36 hours (invasion assay) at 37°C and 5% CO2, the filtered cells were fixed in 4% paraformaldehyde solution and stained with 1%
crystal violet. The stained cells from 5 selected views were observed under a light microscope at a × 200 magnification. In all experiments, each data point was performed in triplicates.
Conditioned medium
Breast cancer cells were cultured in serum-free medium for 24 hours. Supernatants were centrifuged and collected, and further purified through a 0.2 μm filter (Millipore).
Chemotaxis
MDSCs isolated from the peripheral blood of patients with breast cancer were resuspended and placed on the upper chambers of 24-well transwell inserts. The lower chamber contained 1 nM or 10 nM CCL3 in 500 μL of RPMI-1640 medium, or 500 μL of breast cancer conditioned medium. After 12 hours, the number of cells migrating into each bottom compartment was counted using a hemocytometer. Experiments were performed at least in triplicates.
Co-culture of breast cancer cells with MDSCs
A transwell insert (0.4 μm; Millipore) was used for the co-culture of breast cancer cells with MDSCs. MDSCs were added on top of the transwell insert and breast cancer cells were harvested in the bottom chambers. After 24 hours, breast cancer cells were isolated for RT- PCR, western blot, and the rest of the assays.
Construction of 4T1 breast cancer-bearing murine models
Four-week-old female BALB/c mice were purchased from Silaike Laboratory Animal (Shanghai, China) and housed in a pathogen-free animal facility supplied with autoclaved water and food. The mammary fat pads of BALB/c mice (n = 5 per group) were injected with 1 × 10⁵ 4T1 cells. Mice were randomly divided into control and anti-CCL3 group. The
145 https://ejbc.kr https://doi.org/10.4048/jbc.2020.23.e26
CCL3 neutralizing antibody (Cat. No. MAB4502; R&D Systems Inc.) was intraperitoneally injected (1.6 μg per mouse) to mice every 2 days. The tumor volume was calculated using the formula: V = a × b2/2, where “a” is the length and “b” is the width of the tumor. The metastatic tumor nodules on lungs were counted and stained with hematoxylin and eosin (H&E). All procedures were conducted according to the guidelines approved by the Animal Ethics Review Board of Xi'an Jiaotong University.
Immunohistochemistry (IHC)
Sections were deparaffinized, rehydrated, and incubated with anti-E-cadherin (1:400; Cat.
No. 3195; Cell Signaling Technology Inc.), anti-N-cadherin (1:125; Cat. No. 13116; Cell Signaling Technology Inc.), anti-PCNA (1:8,000; Cat. No. 13110; Cell Signaling Technology Inc.), or anti-Gr-1 (1:50; Cat. No. 553123; BD Biosciences) at 4°C overnight. Sections were further treated with horseradish peroxidase-conjugated secondary antibody (1:2,000; Cat.
No. sc-2005; Santa Cruz Biotechnology Inc., Dallas, USA) for 30 minutes at 30°C. The visualization was performed with the DAB substrate (Dako; Agilent Technologies Inc., Santa Clara, USA) for 2 minutes and counterstained using hematoxylin. The tissue sections were examined under a light microscope and 5 high-power fields (magnification × 400) for each section were randomly selected for histological evaluation. The staining intensity was categorized into 4 grades: 0 (no staining), 1 (weak staining), 2 (moderate staining), and 3 (strong staining). The percentage of positively stained cells was categorized into 5 grades: 0 (no staining), 1 (≤ 10%), 2 (11%–50%), 3 (51%–80%) and 4 (≥ 81%). The IHC score was the sum of the multiplication of the staining intensity grade and the percentage of positive cells.
H&E staining
Sections were deparaffinized, rehydrated, stained with hematoxylin for 10 minutes, and then treated with hydrochloric acid alcohol for several seconds. Sections were washed, placed in eosin for 5 minutes, and dehydrated in 70% and 100% alcohol for 10 minutes each step. The sections were then placed in xylene for 5 minutes until they became transparent. Five fields (magnification, × 200 and × 400) for each tissue section were randomly selected for analysis.
Statistical analysis
Data were analyzed using the SPSS software (version 22.0; IBM., Armonk, USA). Results were expressed as mean ± standard deviation /standard error of the mean from 3 independent experiments. The 2-tailed Student's t-test and analysis of variance were used to assess
differences between experimental groups. The p < 0.05 was considered statistically significant.
RESULTS
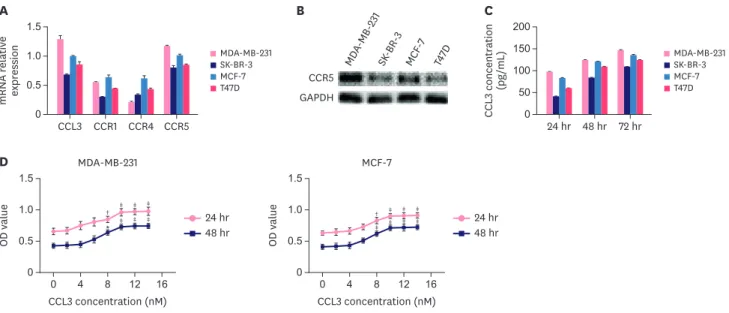
The CCL3–CCR5 axis promotes cell proliferation, migration, invasion, and cycling of breast cancer cells in vitro
We examined CCL3 and its receptors in 4 breast cancer cell lines. MDA-MB-231 cells exhibited the highest mRNA level of CCL3 and the expression of CCR5 was higher in MDA- MB-231 and MCF-7 cells. Lower levels of CCL3 and CCR5 were observed in T47D and SK- BR-3 cells (Figure 1A and B). The ELISA analysis indicated that MDA-MB-231 cells exhibited the highest protein level of CCL3, which increased as the culture period was prolonged (Figure 1C). MDA-MB-231 and MCF-7 cells were used for further studies. Further experiments were performed to investigate how the CCL3–CCR5 axis affected the biological functions of breast cancer cells. The CCK-8 analysis showed that CCL3 was able to promote cell Myeloid-Derived Suppressor Cells Promoted the Progression of Breast Cancer
proliferation (Figure 1D). Flow cytometry was used to determine the cell cycle distribution of breast cancer cells and identify changes in their apoptosis rate. The cell cycling analysis indicated that the percentage of cells in the S-phase increased when breast cancer cells were treated with CCL3. In contrast, the percentage of cells in the S-phase decreased when the cells were treated with DAPTA, which is a potent and specific antagonist of CCR5 (Figure 1E).
Moreover, the results indicated that the apoptosis rate of breast cancer cells decreased when the cells were treated with CCL3 but increased when DAPTA was added. However, this result had no practical significance because the total apoptotic rate was too low (below 10%) (Figure 1F). The effect of the CCL3–CCR5 axis on the migration and invasion of breast cancer cells was determined with the wound healing and transwell assays, which showed that cancer cells treated with CCL3, were more motile than control cancer cells (p < 0.05; Figure 1G and H). However, breast cancer cells exhibited a significant decrease in migration when pretreated with DAPTA. The number of invading breast cancer cells significantly increased when the cells were treated with CCL3, whereas the number was significantly lower than that of cancer cells treated with CCL3 alone when the cells were treated with DAPTA and then CCL3 (p < 0.001; Figure 1I). Hence, the CCL3–CCR5 axis is crucial for the proliferation, migration, invasion, and survival of breast cancer cells in vitro.
Knockdown of CCL3 in breast cancer cells inhibits cell proliferation, migration, invasion, and cycling, and promotes apoptosis of breast cancer cells in vitro
We investigated the effects of CCL3 knockdown on the biological behavior of MDA-MB-231 and MCF-7 cells. Fluorescence microscope, RT-PCR and ELISA showed the transfection and knockdown effect of CCL3 in breast cancer cells (Supplementary Figure 1). Compared with
147 https://ejbc.kr https://doi.org/10.4048/jbc.2020.23.e26
Migration index
MDA-MB-231
0.8 0.6 0.4 0.2 0 Control
CCL3 (1 nM) CCL3 (10 nM)
Anti-CCR5
Migration index
MCF-7
*
0.8 0.6 0.4 0.2 0 Control
CCL3 (1 nM) CCL3 (10 nM)
Anti-CCR5
G
0 hr24 hrMDA-MB-231
Control CCL3 (1 nM) CCL3 (10 nM) Anti-CCR5
0 hr24 hrMCF-7
Control CCL3 (1 nM) CCL3 (10 nM) Anti-CCR5
MDA-MB-231MCF-7 MDA-MB-231MCF-7
Cells/field
MDA-MB-231/Migration 250
200 150 100 50 0
Cells/field
MDA-MB-231/Invasion
‡ ‡
150 100 50 0
‡
‡ ‡
‡
‡ ‡
‡
‡
‡
‡
‡
‡
‡
‡
‡
‡
‡
‡
‡ ‡ ‡
*
†
‡ ‡
‡ ‡
‡
Cells/field
MCF-7/Migration 150
100 50 0 Control
CCL3 (1 nM) CCL3 (10 nM)
Anti-CCR5
Cells/field
MCF-7/Invasion 150
100 50 0 Control
CCL3 (1 nM) CCL3 (10 nM)
Anti-CCR5
H
Control CCL3 (1 nM) CCL3 (10 nM) Anti-CCR5
I
Control CCL3 (1 nM) CCL3 (10 nM) Anti-CCR5 MDA-MB-231
%Cell No. of apoptosis
8 6 4 2 0
Control CCL3 (1 nM)
CCL3 (10 nM) Anti-CCR5
MCF-7
%Cell No. of apoptosis
8 6 4 2 0
Control CCL3 (1 nM)
CCL3 (10 nM) Anti-CCR5 MDA-MB-231
Proportion of cells (%)
80 60 40 20
0 G0/G1 S G2 G0/G1 S G2
MCF-7
Proportion of cells (%)
80 60 40 20 0
E
Number
Channels (FL2-A)
MDA-MB-231MCF-7
Control CCL3 (1 nM) CCL3 (10 nM) Anti-CCR5 F
7-AAD
Annexin V
MDA-MB-231MCF-7
Control CCL3 (1 nM) CCL3 (10 nM) Anti-CCR5
Control CCL3 (1 nM) CCL3 (10 nM) Anti-CCR5 Control
CCL3 (1 nM) CCL3 (10 nM) Anti-CCR5
A C
CCL3 concentration (pg/mL) 200 150 100 50
0 24 hr 48 hr 72 hr
MDA-MB-231 SK-BR-3 MCF-7 mRNA relative expression T47D
1.5 1.0 0.5
0 CCL3 CCR1 CCR4 CCR5
MDA-MB-231 SK-BR-3 MCF-7 T47D
B
CCR5 GAPDH
MDA-MB- 231
SK-BR-3 MCF
-7 T47D
*
† ‡
†
‡ ‡
‡
‡ ‡
‡
D
0 0 4 8 12 16
OD value
1.5
0.5 1.0
CCL3 concentration (nM) MDA-MB-231
48 hr 24 hr
0 0 4 8 12 16
OD value
1.5
0.5 1.0
CCL3 concentration (nM) MCF-7
48 hr 24 hr
Figure 1. Effect of CCL3 on breast cancer cells in vitro. (A) RT-PCR was performed to determine the relative mRNA expression levels of CCL3, CCR1, CCR4, and CCR5 in different breast cancer cell lines. (B) Western blot analysis of CCR5 levels in different breast cancer cell lines. (C) CCL3 concentration in 4 breast cancer cell lines at different culture times (24, 48, and 72 hours). (D) The proliferation of different groups of cells in the presence or absence of different concentrations of CCL3 at the indicated time points was determined with the CCK-8 assay. The cell cycle distribution (E) and apoptosis rate (F) of breast cancer cells pretreated with different concentrations of CCL3 (1 and 10 nM), or with DAPTA and then CCL3 determined by flow cytometry. The migration (G, magnification, ×100; H, magnification, ×200) and invasion (I, magnification, ×200) of breast cancer cells pretreated with CCL3 (1 and 10 nM) or with DAPTA and then CCL3 determined by the wound healing and the transwell assays. Results are representative of 3 experiments with similar results.
CCL = chemokine (C-C motif) ligand; CCR = C-C chemokine receptor; CCK-8 = cell counting kit-8; RT-PCR = real-time polymerase chain reaction.
*p < 0.05, †p < 0.01, ‡p < 0.001. (continued to the next page)
siNC cells, the expression level of CCL3 were inhibited up to 80–90% in both siCCL3 cell lines (p < 0.001). The treatment with siRNA targeting CCL3 significantly decreased the levels of cell proliferation (p < 0.001; Figure 2A). The cell cycling analysis indicated that CCL3 knockdown in breast cancer cells decreased the percentage of cells in the S-phase (p < 0.01 and p < 0.001;
Figure 2B). The flow cytometry analysis revealed that CCL3 knockdown increased the rate of apoptotic breast cancer cells (Figure 2C). The wound healing and transwell assays Myeloid-Derived Suppressor Cells Promoted the Progression of Breast Cancer
Migration index
MDA-MB-231
0.8 0.6 0.4 0.2 0 Control
CCL3 (1 nM) CCL3 (10 nM)
Anti-CCR5
Migration index
MCF-7
*
0.8 0.6 0.4 0.2 0 Control
CCL3 (1 nM) CCL3 (10 nM)
Anti-CCR5
G
0 hr24 hrMDA-MB-231
Control CCL3 (1 nM) CCL3 (10 nM) Anti-CCR5
0 hr24 hrMCF-7
Control CCL3 (1 nM) CCL3 (10 nM) Anti-CCR5
MDA-MB-231MCF-7 MDA-MB-231MCF-7
Cells/field
MDA-MB-231/Migration 250
200 150 100 50 0
Cells/field
MDA-MB-231/Invasion
‡ ‡
150 100 50 0
‡
‡ ‡
‡
‡ ‡
‡
‡
‡
‡
‡
‡
‡
‡
‡
‡
‡
‡
‡ ‡ ‡
*
†
‡ ‡
‡ ‡
‡
Cells/field
MCF-7/Migration 150
100 50 0 Control
CCL3 (1 nM) CCL3 (10 nM)
Anti-CCR5
Cells/field
MCF-7/Invasion 150
100 50 0 Control
CCL3 (1 nM) CCL3 (10 nM)
Anti-CCR5
H
Control CCL3 (1 nM) CCL3 (10 nM) Anti-CCR5
I
Control CCL3 (1 nM) CCL3 (10 nM) Anti-CCR5 MDA-MB-231
%Cell No. of apoptosis
8 6 4 2 0
Control CCL3 (1 nM)
CCL3 (10 nM) Anti-CCR5
MCF-7
%Cell No. of apoptosis
8 6 4 2 0
Control CCL3 (1 nM)
CCL3 (10 nM) Anti-CCR5 MDA-MB-231
Proportion of cells (%)
80 60 40 20
0 G0/G1 S G2 G0/G1 S G2
MCF-7
Proportion of cells (%)
80 60 40 20 0
E
Number
Channels (FL2-A)
MDA-MB-231MCF-7
Control CCL3 (1 nM) CCL3 (10 nM) Anti-CCR5 F
7-AAD
Annexin V
MDA-MB-231MCF-7
Control CCL3 (1 nM) CCL3 (10 nM) Anti-CCR5
Control CCL3 (1 nM) CCL3 (10 nM) Anti-CCR5 Control
CCL3 (1 nM) CCL3 (10 nM) Anti-CCR5
A C
CCL3 concentration (pg/mL) 200 150 100 50
0 24 hr 48 hr 72 hr
MDA-MB-231 SK-BR-3 MCF-7 mRNA relative expression T47D
1.5 1.0 0.5
0 CCL3 CCR1 CCR4 CCR5
MDA-MB-231 SK-BR-3 MCF-7 T47D
B
CCR5 GAPDH
MDA-MB- 231
SK-BR-3 MCF
-7 T47D
*
† ‡
†
‡ ‡
‡ ‡
‡ ‡
D
0 0 4 8 12 16
OD value
1.5
0.5 1.0
CCL3 concentration (nM) MDA-MB-231
48 hr 24 hr
0 0 4 8 12 16
OD value
1.5
0.5 1.0
CCL3 concentration (nM) MCF-7
48 hr 24 hr
Figure 1. (Continued) Effect of CCL3 on breast cancer cells in vitro. (A) RT-PCR was performed to determine the relative mRNA expression levels of CCL3, CCR1, CCR4, and CCR5 in different breast cancer cell lines. (B) Western blot analysis of CCR5 levels in different breast cancer cell lines. (C) CCL3 concentration in 4 breast cancer cell lines at different culture times (24, 48, and 72 hours). (D) The proliferation of different groups of cells in the presence or absence of different concentrations of CCL3 at the indicated time points was determined with the CCK-8 assay. The cell cycle distribution (E) and apoptosis rate (F) of breast cancer cells pretreated with different concentrations of CCL3 (1 and 10 nM), or with DAPTA and then CCL3 determined by flow cytometry. The migration (G, magnification, ×100; H, magnification, ×200) and invasion (I, magnification, ×200) of breast cancer cells pretreated with CCL3 (1 and 10 nM) or with DAPTA and then CCL3 determined by the wound healing and the transwell assays. Results are representative of 3 experiments with similar results.
CCL = chemokine (C-C motif) ligand; CCR = C-C chemokine receptor; CCK-8 = cell counting kit-8; RT-PCR = real-time polymerase chain reaction.
*p < 0.05, †p < 0.01, ‡p < 0.001.
showed that the migration and invasion abilities of both cell lines were reduced after CCL3 knockdown (p < 0.001; Figure 2D-I). Collectively, these data showed that CCL3 knockdown in breast cancer cells exhibited strong effects in terms of inhibiting cell proliferation, migration, invasion, and cycling, while promoting apoptosis.
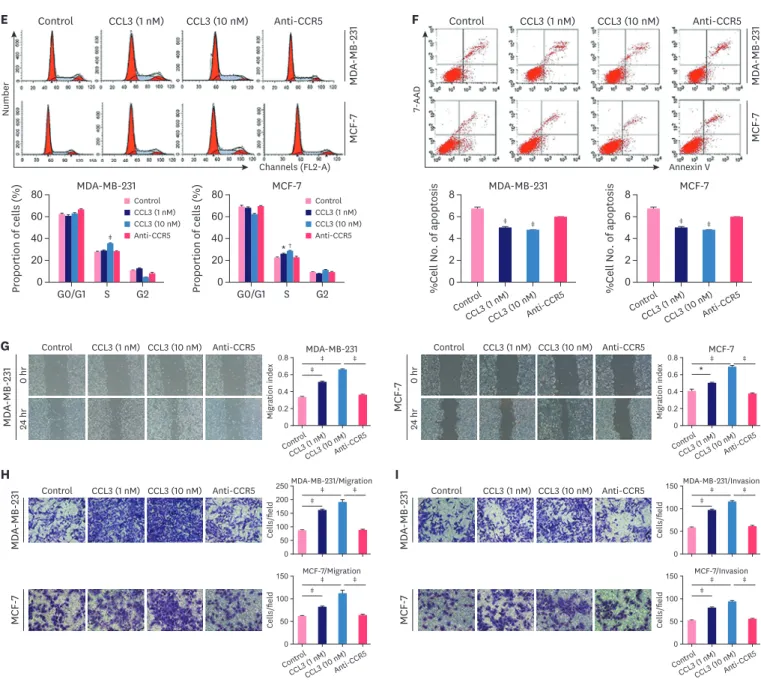
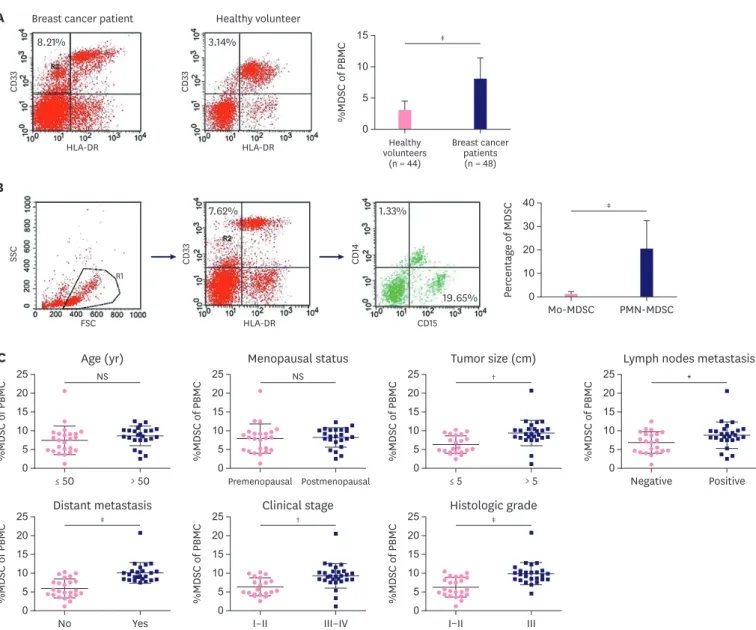
The frequency of MDSCs increases in peripheral blood of patients with breast cancer
We found a significant increase in MDSCs levels in breast cancer patients compared with healthy donors when the MDSCs population was calculated as a percentage of the total PBMCs (8.08% ± 3.31% vs. 3.11% ± 1.36%, p < 0.001; Figure 3A). We also identified the 2 subtypes of MDSCs and found that the percentage of PMN-MDSCs was higher than that of Mo-MDSCs (p < 0.001; Figure 3B). Moreover, we observed that the frequency of MDSCs was correlated with some clinical characteristics of patients with breast cancer. The percentage of MDSCs in patients in the advanced stages (III–IV) was higher than that in patients in the
149 https://ejbc.kr https://doi.org/10.4048/jbc.2020.23.e26
B C
Number
Channels (FL2-A)
D
24 hr 0 hr
MDA-MB-231
Control siNC siCCL3
24 hr 0 hr
MCF-7
Control siNC siCCL3
MDA-MB-231MCF-7
MDA-MB-231 A
OD value
1.0 0.8 0.6 0.4 0.2 0
24 hr 48 hr 72 hr
siNC siCCL3 Control
†
†
†
MCF-7
OD value
1.0 0.8 0.6 0.4 0.2 0
24 hr 48 hr 72 hr
siNC siCCL3 Control
†
†
†
Proportion of cells (%)
80 60 40 20
0 G0/G1 S G2
siNC siCCL3 Control
Proportion of cells (%)
80 60 40 20
0 G0/G1 S G2
siNC siCCL3 Control
* †
†
†
%Cell No. of apoptosis
15 10 5
0 %Cell No. of apoptosis
10 8 6 4 2
Control siNC siCCL3 0 Control siNC siCCL3
Control siNC siCCL3 Control siNC siCCL3
7-AAD
Annexin V
MDA-MB-231MCF-7
E
MDA-MB-231 Migration Invasion
MCF-7
†
Migration index
0.4 0.3 0.2 0.1 0
Control siNCsiCCL3
†
Migration index
0.4 0.3 0.2 0.1 0
Control siNCsiCCL3
†
Cells/field
100 80 60 40 20 0
Control siNCsiCCL3
†
Cells/field
80 60 40 20 0
Control siNCsiCCL3
†
Cells/field
80 60 40 20 0
Control siNCsiCCL3
†
Cells/field
60 40 20 0
Control siNCsiCCL3
G MDA-MB-231 MCF-7 H MDA-MB-231/Migration MCF-7/Migration I MDA-MB-231/Invasion MCF-7/Invasion
MCF-7
Control siNC siCCL3 F
MDA-MB-231
Control siNC siCCL3
Figure 2. CCL3 knockdown inhibits cell proliferation, migration, invasion, and cycling and promotes apoptosis of breast cancer cells in vitro. (A) The effect of CCL3 knockdown on the proliferation of breast cancer cells was determined with the CCK-8 assay. The effect of CCL3 knockdown on the cell cycling (B) and apoptosis (C) of breast cancer cells was determined by flow cytometry. The effect of CCL3 knockdown on the migration of breast cancer cells was determined with the wound healing (D, magnification, ×100; G) and the transwell assays (E, magnification, ×200; H). The effect of CCL3 knockdown on the invasion of breast cancer cells was determined by the transwell assay (F, magnification, ×200; I). Three experiments for each setting were performed.
CCL = chemokine (C-C motif) ligand; CCK-8 = cell counting kit-8; si = short interfering; NC = negative control.
*p < 0.01, †p < 0.001 vs. controls. (continued to the next page)
early stages (I–II) (p = 0.001; Figure 3C). Besides, patients with an extensive tumor burden, lymph node metastases, distant metastases, and poorly differentiated tumors had a higher percentage of MDSCs and there was a significant difference between the 2 groups (p < 0.05).
Age and menopause status were not related to the percentage of MDSCs.
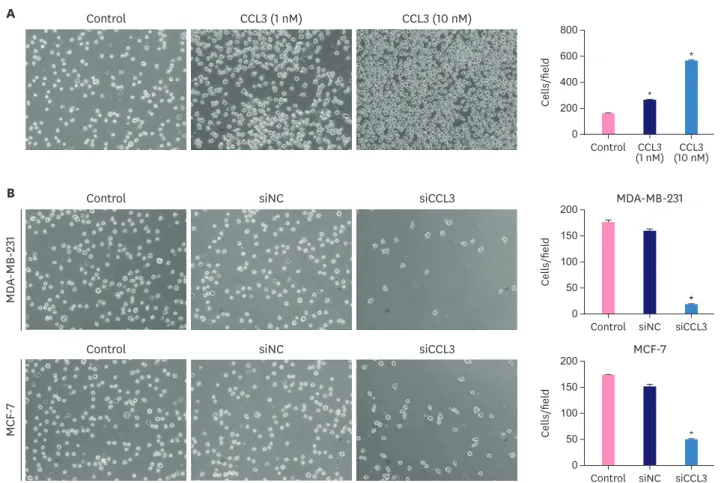
CCL3 recruits MDSCs in vitro
MDSCs were sorted through flow cytometry and then we used the transwell assay to investigate the chemotactic effect of CCL3 on MDSCs. First, we added recombinant human CCL3 (rhCCL3) to the lower chambers and MDSCs to the upper chambers. We found that CCL3 attracted MDSCs and the number of MDSCs increased with the increase in CCL3 concentration. The difference in comparison with the control group was significant (p <
0.001; Figure 4A). Then we placed conditioned medium from breast cancer cells in the lower chambers and MDSCs in the upper chambers. A statistical analysis showed a decrease in chemotaxis when the conditioned medium was obtained from CCL3 knockdown breast cancer cells (p < 0.001; Figure 4B).
Myeloid-Derived Suppressor Cells Promoted the Progression of Breast Cancer
B C
Number
Channels (FL2-A)
D
24 hr 0 hr
MDA-MB-231
Control siNC siCCL3
24 hr 0 hr
MCF-7
Control siNC siCCL3
MDA-MB-231MCF-7
MDA-MB-231 A
OD value
1.0 0.8 0.6 0.4 0.2
0 24 hr 48 hr 72 hr
siNC siCCL3 Control
†
†
†
MCF-7
OD value
1.0 0.8 0.6 0.4 0.2
0 24 hr 48 hr 72 hr
siNC siCCL3 Control
†
†
†
Proportion of cells (%)
80 60 40 20
0 G0/G1 S G2
siNC siCCL3 Control
Proportion of cells (%)
80 60 40 20
0 G0/G1 S G2
siNC siCCL3 Control
* †
†
†
%Cell No. of apoptosis
15 10 5
0 %Cell No. of apoptosis
10 8 6 4 2
Control siNC siCCL3 0 Control siNC siCCL3
Control siNC siCCL3 Control siNC siCCL3
7-AAD
Annexin V
MDA-MB-231MCF-7
E
MDA-MB-231 Migration Invasion
MCF-7
†
Migration index
0.4 0.3 0.2 0.1 0
Control siNCsiCCL3
†
Migration index
0.4 0.3 0.2 0.1 0
Control siNCsiCCL3
†
Cells/field
100 80 60 40 20 0
Control siNCsiCCL3
†
Cells/field
80 60 40 20 0
Control siNCsiCCL3
†
Cells/field
80 60 40 20 0
Control siNCsiCCL3
†
Cells/field
60 40 20 0
Control siNCsiCCL3
G MDA-MB-231 MCF-7 H MDA-MB-231/Migration MCF-7/Migration I MDA-MB-231/Invasion MCF-7/Invasion
MCF-7
Control siNC siCCL3 F
MDA-MB-231
Control siNC siCCL3
Figure 2. (Continued) CCL3 knockdown inhibits cell proliferation, migration, invasion, and cycling and promotes apoptosis of breast cancer cells in vitro.
(A) The effect of CCL3 knockdown on the proliferation of breast cancer cells was determined with the CCK-8 assay. The effect of CCL3 knockdown on the cell cycling (B) and apoptosis (C) of breast cancer cells was determined by flow cytometry. The effect of CCL3 knockdown on the migration of breast cancer cells was determined with the wound healing (D, magnification, ×100; G) and the transwell assays (E, magnification, ×200; H). The effect of CCL3 knockdown on the invasion of breast cancer cells was determined by the transwell assay (F, magnification, ×200; I). Three experiments for each setting were performed.
CCL = chemokine (C-C motif) ligand; CCK-8 = cell counting kit-8; si = short interfering; NC = negative control.
*p < 0.01, †p < 0.001 vs. controls.
Blockade of CCL3 inhibits the growth and metastasis of breast cancer cells in mice and reduces the recruitment of MDSCs
In vitro experiments revealed that CCL3 might promote cell proliferation, migration, and invasion, and regulate the cell cycle of breast cancer cells, which prompted us to investigate the effect of CCL3 in vivo. We injected 4T1 cells into the mammary fat pads of mice to explore the effect of CCL3 on tumor cells in vivo. We found that tumors of the control group were larger and heavier than those of the anti-CCL3 group (p < 0.001; Figure 5A-C); many more lung metastatic nodules were observed in mice of the control group. A quantitative analysis showed that the mean number of lung metastatic nodules in the control group was significantly higher than that in the anti-CCL3 group (p < 0.001; Figure 5D and E).
151 https://ejbc.kr https://doi.org/10.4048/jbc.2020.23.e26
Age (yr) C
%MDSC of PBMC 0 25 20 15 10 5
≤ 50 > 50
Menopausal status
%MDSC of PBMC 0 25 20 15 10 5
Premenopausal Postmenopausal
Tumor size (cm)
%MDSC of PBMC 0 25 20 15 10 5
≤ 5 > 5
Distant metastasis
%MDSC of PBMC 0 25 20 15 10 5
No Yes
Clinical stage
%MDSC of PBMC 0 25 20 15 10 5
I–II III–IV
Histologic grade
%MDSC of PBMC 0 25 20 15 10 5
I–II III
Lymph nodes metastasis
%MDSC of PBMC 0 25 20 15 10 5
Negative Positive
NS NS †
‡ † ‡
*
A
%MDSC of PBMC 0 15 10 5
Healthy volunteers
(n = 44)
Breast cancer patients (n = 48)
‡
HLA-DR
CD33
Healthy volunteer 3.14%
Breast cancer patient
HLA-DR
CD33
8.21%
R2
B
Percentage of MDSC 0 40 30 20 10
Mo-MDSC PMN-MDSC
‡
FSC
SSC
R1
HLA-DR
CD33
7.62%
R2
CD15
CD14
1.33%
19.65%
Figure 3. Frequency of MDSCs in breast cancer patients and their relation with clinical features. (A) The frequencies of MDSCs in breast cancer patients and healthy donors were determined with flow cytometry. (B) The frequencies of 2 subtypes of MDSCs in breast cancer patients were determined by flow cytometry.
(C) The relation between MDSCs and clinical features was analyzed with the t-test. Data represent the analysis conducted on 44 healthy volunteers and 48 patients with breast cancer; representative images are shown.
MDSC = myeloid-derived suppressor cell; NS = no significance; Mo-MDSC = monocyte-type myeloid-derived suppressor cell; PMN-MDSC = polymorphonuclear- type myeloid-derived suppressor cell.
*p < 0.05, †p < 0.01, ‡p < 0.001.
Histological staining clearly showed metastatic tumors in mice lungs (Figure 5F). The length and weight of the spleens in the anti-CCL3 group decreased, which may be related to the decrease in the accumulation of MDSCs (Figure 5G-I). The immunohistochemical (p < 0.001; Figure 5J) analysis revealed that the number of Gr-1+ cells in the tumors, lungs, and spleens of the control group was higher than that of the anti-CCL3 group. This result suggested that blocking CCL3 in mice might reduce the recruitment of MDSCs and CCL3 might attract MDSCs in vivo. Considering that CCL3 might promote the proliferation of breast cancer cells in vitro and CCL3 and MDSCs might affect the EMT, PCNA and EMT-related markers such as E-cadherin and N-cadherin were analyzed using IHC and western blot. The staining intensity of anti-PCNA and anti-N-cadherin in control tumors was significantly higher than that in anti-CCL3 tumors, while the E-cadherin level increased in anti-CCL3 tumors (p < 0.001; Figure 5K). Western blot analysis also showed that the level of PCNA and N-cadherin in control tumors was higher than that in anti-CCL3 tumors, while the E-cadherin level increased in anti-CCL3 tumors (p < 0.01 and p < 0.001; Supplementary Figure 2). These results indicated that CCL3 played a key role in the recruitment of MDSCs and regulated the EMT, tumor growth, and metastasis of breast cancer cells.
CCL3 is crucial for promoting the proliferation, migration, and invasion of breast cancer cells after co-culture with MDSCs
EMT is a crucial step in cancer invasion and metastasis. In previous studies, it was found that both CCL3 and MDSCs play important roles in the migration and invasion of breast cancer Myeloid-Derived Suppressor Cells Promoted the Progression of Breast Cancer
Control siNC siCCL3 MDA-MB-231
MDA-MB-231
MCF-7
MCF-7
Control siNC siCCL3
B
0
Cells/field
200 150 100 50
Control siNC siCCL3
0
Cells/field
200 150 100 50
Control siNC siCCL3
**
*
A
0
Cells/field
Control CCL3 (1 nM) CCL3 (10 nM)
800 600 400 200
Control CCL3 (1 nM) CCL3
(10 nM)
*
*
Figure 4. CCL3 recruits MDSCs in vitro. The chemotactic effects of different concentrations of CCL3 (1 and 10 nM) (A) and the conditioned medium from breast cancer cells with or without CCL3 knockdown (B) on MDSCs. Images (magnification, ×200) are representative and data are from 3 separate experiments.
CCL = chemokine (C-C motif) ligand; MDSC = myeloid-derived suppressor cell; si = short interfering; NC = negative control.
*p < 0.001.