D I A B E T E S & M E T A B O L I S M J O U R N A L D I A B E T E S & M E T A B O L I S M J O U R N A L
This is an Open Access article distributed under the terms of the Creative Commons Attribution Non-Commercial License (http://creativecommons.org/licenses/by-nc/4.0/) which permits unrestricted non-commercial use, distribution, and reproduction in any medium, provided the original work is properly cited.
Application of the Oral Minimal Model to Korean Subjects with Normal Glucose Tolerance and Type 2 Diabetes Mellitus
Min Hyuk Lim1, Tae Jung Oh2, Karam Choi3, Jung Chan Lee1, Young Min Cho2, Sungwan Kim1
Departments of 1Biomedical Engineering, 2Internal Medicine, Seoul National University College of Medicine, Seoul,
3Interdisciplinary Program of Bioengineering, Seoul National University College of Engineering, Seoul, Korea
Background: The oral minimal model is a simple, useful tool for the assessment of β-cell function and insulin sensitivity across the spectrum of glucose tolerance, including normal glucose tolerance (NGT), prediabetes, and type 2 diabetes mellitus (T2DM) in humans.
Methods: Plasma glucose, insulin, and C-peptide levels were measured during a 180-minute, 75-g oral glucose tolerance test in 24 Korean subjects with NGT (n=10) and T2DM (n=14). The parameters in the computational model were estimated, and the indexes for insulin sensitivity and β-cell function were compared between the NGT and T2DM groups.
Results: The insulin sensitivity index was lower in the T2DM group than the NGT group. The basal index of β-cell responsivity, basal hepatic insulin extraction ratio, and post-glucose challenge hepatic insulin extraction ratio were not different between the NGT and T2DM groups. The dynamic, static, and total β-cell responsivity indexes were significantly lower in the T2DM group than the NGT group. The dynamic, static, and total disposition indexes were also significantly lower in the T2DM group than the NGT group.
Conclusion: The oral minimal model can be reproducibly applied to evaluate β-cell function and insulin sensitivity in Koreans.
Keywords: Computational method; Disposition index; Glucose tolerance test; Insulin resistance; Oral minimal model; Respon- sivity index
Corresponding authors: Sungwan Kim https://orcid.org/0000-0002-9318-849X Department of Biomedical Engineering, Seoul National University College of Medicine, 101 Daehak-ro, Jongno-gu, Seoul 03080, Korea
E-mail: [email protected]
Young Min Cho https://orcid.org/0000-0002-2331-6126
Department of Internal Medicine, Seoul National University College of Medicine, 101 Daehak-ro, Jongno-gu, Seoul 03080, Korea
E-mail: [email protected]
INTRODUCTION
The pathophysiology of type 2 diabetes mellitus (T2DM), a representative multifactorial disease, is very complex and en- compasses decreased β-cell function, unsuppressed α-cell overactivity, increased hepatic glucose production, decreased glucose uptake in the skeletal muscle, increased lipolysis in the adipose tissue, decreased effect of incretin hormones, in- creased renal glucose reabsorption, and neurotransmitter ab-
normality [1]. Despite the highly complex nature of glucose homeostasis, there have been continuous efforts to build mathematical models for glucose metabolism using biological variables to predict glucose and insulin responses [2-6]. How- ever, some efforts to adjust numerous variables resulted in an overfitting problem [7]. In this regard, Bergman’s minimal model merits by requiring minimal numbers of parameters to estimate β-cell function and insulin sensitivity [8].
Two types of minimal models for the assessment of β-cell http://dx.doi.org/10.4093/dmj.2016.40.4.308
pISSN 2233-6079 · eISSN 2233-6087
function and insulin sensitivity have been developed according to the different routes of glucose administration: intravenous glucose tolerance test (IVGTT) [8] and oral glucose tolerance test (OGTT), or mixed-meal tolerance test [3,9]. The IVGTT- based minimal model consists of glucose and insulin subsys- tems, where insulin in the plasma compartment passes the en- dothelium and enters a remote interstitial compartment to ex- ert insulin action. In this model, if plasma insulin levels were solely measured, actual insulin secretion rates (ISRs) might be underestimated owing to the influence of different hepatic ex- tractions of insulin [10]. Therefore, a C-peptide-based model was developed to overcome this shortcoming to estimate more accurate ISRs [11,12]. However, the intravenous administra- tion of glucose is far from the physiologic way of glucose in- take, which necessitates further improvement of the model by incorporating the physiology of oral glucose intake [13]. Since the OGTT is the gold standard method to determine glucose tolerance status, glucose, and insulin responses during the OGTT have been incorporated into mathematical models [2,4,14,15]. Among various oral glucose models, the oral mini- mal model can be easily applied to examine the dynamic phys- iology of glucose homeostasis, especially during the postpran- dial period. The oral minimal model comprises three submod- els: The glucose minimal model assesses insulin secretion due to intestinal glucose absorption and consequent increases in the plasma glucose levels. The C-peptide minimal model de- termines how insulin controls the plasma glucose levels. The insulin and C-peptide minimal model was developed based on the C-peptide minimal model to assess the hepatic extraction of insulin. The oral minimal model can also be readily adapted to various situations by modifying its structure.
East Asians have a unique pathophysiology of T2DM.
Compared to their Caucasian counterparts, early β-cell dete- rioration with relatively preserved insulin sensitivity is char- acteristic during the pathogenesis of T2DM in East Asians [16]. Therefore, it would be meaningful to test whether or not the oral minimal model can be used in the Korean popula- tion. In this study, we applied the oral minimal model to Ko- rean subjects with T2DM and normal glucose tolerance (NGT) to assess β-cell function and insulin sensitivity.
METHODS
Subjects and ethical statement
Our study included 14 patients with T2DM and 10 subjects
with NGT, aged 18 to 75 years. The T2DM patients were diag- nosed according to the criteria by the American Diabetes As- sociation and had been treated with either lifestyle modifica- tions or oral antidiabetic drugs. They did not have diabetic complications, such as retinopathy, microalbuminuria, or car- diovascular disease.
The study protocol was approved by the Institutional Re- view Board at the Seoul National University Hospital (regis- tration number: H-1504-018-662) and was in compliance with the Declaration of Helsinki, as revised in 2000. Written informed consent was obtained from all of the participants before any study-related procedures.
Study procedures
Before visiting the Biomedical Research Center at the Seoul National University Hospital, all of the subjects had a 1-week washout period for oral antidiabetic drugs. They also fasted the night before the study day. All of the participants under- went a 180-minute, 75-g OGTT. Venous blood was drawn at 0, 15, 30, 60, 90, 120, and 180 minutes for the measurement of plasma glucose, insulin, and C-peptide levels. Glucose was measured by a glucose oxidase method (YSI 2300 STAT Plus analyzer; Yellow Springs Instruments, Yellow Springs, OH, USA). Insulin (DIAsource, Nivelles, Belgium) and C-peptide (Immunotech, Prague, Czech Republic) concentrations were measured with chemiluminescence immunoassay.
The mathematics of the oral minimal model
The oral glucose minimal model and the oral C-peptide mini- mal model were adopted in this study. The oral glucose mini- mal model has two ordinary differential equations that repre- sent the changes in plasma glucose and insulin concentra- tions. From previous studies [3,7,17], the following equations were derived:
dG(t)= –[X(t)]×G(t)–SG×[G(t)–Gb]+Ra(t) G(0)=Gb
dt V , (Equation 1) dX(t)= –p2×X(t)+p3×[I(t)–Ib], X(0)=0 (Equation 2)
dt
G(t) is the plasma glucose concentration, V is the glucose distribution volume, and SG is the fractional glucose effective- ness for promoting glucose disposal and altering the net hepat- ic glucose balance (Equation 1). Ra(t) is the glucose appearance rate in plasma following oral glucose intake. X(t) represents
the insulin action on glucose disposal and glucose production, and b denotes the basal value (Equations 1 and 2). Parameters, such as p2 and p3, are rate constants representing the dynamics and magnitude of insulin action. Namely, p2 is the rate con- stant in the remote insulin compartment (i.e., interstitial com- partment) from which insulin action is derived, and p3 is used for the scaling of the amplitude of insulin action [17]. I(t) is the plasma insulin concentration (Equation 2). These equations describe the glucose response to a given insulin action and the intake of glucose from the gastrointestinal tract.
The oral C-peptide minimal model has four ordinary dif- ferential equations [3,14]. In this model, C-peptide kinetics is used instead of plasma insulin concentrations for the purpose of reflecting more accurate ISRs.
dq1(t)
=–(k01 + k21)×q1(t)+k12×q2(t)+ISR(t), d
c1(t)= q1(t)
q1(0)=0 (Equation 3) V ,
dq2(t)=–k12×q2(t)+k21×q1(t), q2(0)=0 (Equation 4) dt
ISR(t)=y(t)+KG×dG(t) (Equation 5) dt
dy(t)
=– 1 [y(t)–β×(G(t)–Gb)], y(0)=0 (Equation 6) dt T
Briefly, in Equation 3, q1 and q2 are the increased C-peptide amounts from the basal amounts in the accessible and remote compartments, respectively. ISR means increased C-peptide secretion rates from the basal rates. c1 is the increased C-pep- tide plasma concentration from the basal level. k01, k12, and k21
are rate constants characterizing C-peptides kinetics. c1 is the increased C-peptide concentration from the basal level, and y(t) is the insulin provision (i.e., the proportion of synthesized insulin reaching the β-cell membrane and ready to be secreted after a delay [T]). KG and β are regarded as dynamic and static parameters, respectively.
The oral insulin and C-peptide minimal model is based on the oral C-peptide minimal model; a subsystem for the hepat- ic extraction of insulin is inserted. The insulin delivery rate (IDR) and hepatic insulin extraction (HE) can be determined in this model [12].
dI(t)=–n×I(t)+IDR(t)/VI, I(0)=Ib (Equation 7) dt
IDR(t)=ISR(t)×[1–HE(t)]/VI (Equation 8)
In this model, ‘n’ is the rate constant of insulin elimination, VI is the distribution volume of insulin, and (1–HE) means the fraction of ISR reaching the C-peptide accessible com- partment.
Parameter estimation
Three parameters (SG, p2, and p3) in Equations 1 and 2 were evaluated in the glucose minimal model using clinical data.
Their values were obtained by minimizing the nonlinear least square function, which reflects the differences between the an- ticipated and measured points. Among the three parameters in the oral glucose minimal model, glucose effectiveness SG and the ratio of p2 to p3 are important for characterizing the plasma glucose and insulin responses in each subject. Their values can be precisely estimated due to the inherent robustness of the model against errors in which the estimated ratio of p2 to p3
was nearly consistent, if p2 and p3 were respectively overesti- mated [18]. During this estimation process, all of the parame- ters were explored based on the reference values [19-21] within the parametric space using optimization techniques. One sub- ject in the NGT group and two subjects in the T2DM group were excluded from this calculation via outlier reduction. The function of the absorption rate of glucose into the mesenteric circulation was derived from a previous study [21]. The simu- lated annealing method in the parametric space for optimiza- tion was performed [22]. Because the smooth slopes of curves were important in the calculations, we used simulated re- sponses for estimation. The rate constants (k01, k12, and k21) characterizing the C-peptide kinetics were adapted from a pre- vious study [23]. All of the processes were carried out for each subject using the MATLAB system (The Mathworks Inc., Natick, MA, USA).
Calculations
Our goals of the calculations were two-fold. Our first goal was to compare the insulin sensitivity (SI) and β-cell function (i.e., basal, dynamic, static, and total responsivity indexes [Φb, Φd, Φs, and Φt]) between the NGT and T2DM groups. The second goal was to graphically present the dynamic, static, and total disposition indexes (DIs, DId, and DIt) of the subjects using the DI metric to show the distribution of insulin sensitivity and β-cell responsivity of the NGT and T2DM groups.
In the oral minimal model, Φb reflects the insulin secretion
at the basal state. Φd and Φs, respectively, correspond to first and second phase of insulin secretion. Φt combines the effects of both Φd and Φs [14].
The indexes SI and Φb, Φd, Φs, and Φt of the subjects were calculated based on the derived parameters. In the glucose minimal model, SI and SG were calculated as follows [24]:
SI= p3 V (10–5 dL/kg/min per pmol/L), SG=p1 (min–1)
p2 (Equation 9)
In the C-peptide minimal model, the β-cell responsivity in- dexes represent the capacity of the β-cells to release insulin.
They were approximated as follows [14,25]:
ϕb=k01CPb (10–9 min–1) (Equation 10) Gb
ϕd=KG (10–9) (Equation 11) ϕs=β (10–9 min–1) (Equation 12)
ϕt=ϕs+ ϕd (Gmax–Gb) (10–9 min–1) (Equation 13) ∫0∞ [G(t)–Gb]dt
The DId, DIs, and DIt were calculated through multiplying Φd, Φs, and Φt, respectively, by SI.
The basal hepatic insulin extraction ratio (HEb) and post- glucose challenge hepatic insulin extraction ratio (HEpost) were calculated. T0, 180 minutes in this study, is the time reaching the end of the tests [12].
HEb=ISRb–IDRb =1– Ib×n×VI (%) (Equation 14) ISRb ISRb
HEpost=∫0T0 ISR(t)dt–∫0T0 IDR(t)dt (%) (Equation 15) ∫0T0 ISR(t)dt
Statistical analysis
To compare the variables between the NGT and T2DM groups, the Mann-Whitney test, chi-square test, Welch’s test, and analysis of covariance for adjusting differences in age were performed. The oral minimal model indexes were log transformed for analysis and back transformed. The Spear- man correlation analysis was also used. Prism 5.0 (GraphPad, San Diego, CA, USA), R 3.1.2 (The R Foundation, Vienna, Austria), and SPSS 19.0 (IBM Co., Armonk, NY, USA) soft- ware were used for statistical analysis. The significance level was set at 0.05 for the judgment of intergroup differences.
RESULTS
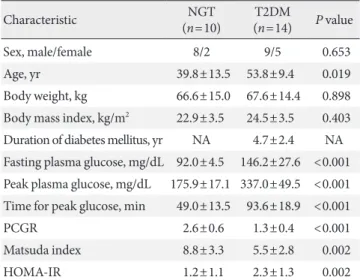
The clinical characteristics of the participants are presented in Table 1. The T2DM group was older than the NGT group (mean±standard deviation, 53.8±9.4 years vs. 39.8±13.5 years, P<0.019). The fasting glucose levels (146.2±27.6 mg/
dL vs. 92.0±4.5 mg/dL, P<0.001) and peak glucose levels dur- ing the OGTT (337.0±49.5 mg/dL vs. 175.9±17.1 mg/dL, P<
0.001) were higher in the T2DM group than the NGT group.
The T2DM group had a longer delay in reaching the peak glu- cose levels than the NGT group (93.6±18.9 minutes vs.
49.0±13.5 minutes, P<0.001). The body weight and body mass indexes were not significantly different between the NGT and T2DM groups.
Other indexes of insulin secretion or insulin action, such as postprandial C-peptide to glucose ratio (PCGR) [26], Matsu- da index [27], and homeostasis model assessment of insulin resistance (HOMA-IR) [28], were compared between the NGT and T2DM groups and are shown in Table 1. The PCGR and Matsuda index were higher in the NGT group than the T2DM group (2.649±0.642 vs. 1.254±0.423, P<0.001; 8.818±3.260 vs. 5.466±2.814, P=0.002, respectively). HOMA-IR was lower in the NGT group than the T2DM group (1.2±1.1 vs. 2.3±
1.3, P=0.002).
Table 1. Clinical characteristics of the subjects
Characteristic NGT
(n=10) T2DM
(n=14) P value
Sex, male/female 8/2 9/5 0.653
Age, yr 39.8±13.5 53.8±9.4 0.019
Body weight, kg 66.6±15.0 67.6±14.4 0.898 Body mass index, kg/m2 22.9±3.5 24.5±3.5 0.403 Duration of diabetes mellitus, yr NA 4.7±2.4 NA Fasting plasma glucose, mg/dL 92.0±4.5 146.2±27.6 <0.001 Peak plasma glucose, mg/dL 175.9±17.1 337.0±49.5 <0.001 Time for peak glucose, min 49.0±13.5 93.6±18.9 <0.001
PCGR 2.6±0.6 1.3±0.4 <0.001
Matsuda index 8.8±3.3 5.5±2.8 0.002
HOMA-IR 1.2±1.1 2.3±1.3 0.002
Values are presented as mean±standard deviation. P values were cal- culated using the chi-square test or the Mann-Whitney test, where appropriate.
NGT, normal glucose tolerance; T2DM, type 2 diabetes mellitus; NA, not applicable; PCGR, postprandial C-peptide to glucose ratio;
HOMA-IR, homeostasis model assessment of insulin resistance.
Insulin sensitivity, β-cell responsivity indexes, and HE ratios
Insulin sensitivity and β-cell responsivity indexes were com- pared between the NGT and T2DM groups. As shown in Fig.
1, the NGT group had a higher SI than the T2DM group (20.0±8.2 [×10–5 dL/kg/min per pmol/L] vs. 13.3±11.8 [×10–
5 dL/kg/min per pmol/L], P=0.024). The basal β-cell respon- sivity index (Φb) was not significantly different between the NGT and T2DM groups (2.8±1.2 [×10–9 min–1] vs. 2.9±1.2 [×10–9 min–1], respectively, P=0.578, age-adjusted P=0.972).
The Φd, Φs, and Φt were higher in the NGT group than the T2DM group (Φd: 661.7±411.1 [×10–9] vs. 170.9±138.7 [×10–9], P< 0.001, age-adjusted P=0.005; Φs: 33.5±9.4 [×10–9 min–1] vs. 13.9±6.5 [×10–9 min–1], P<0.001, age-adjusted P<
0.001; Φt: 41.9±13.2 [×10–9 min–1] vs. 15.5±7.2 [×10–9 min–1], P<0.001, age-adjusted P<0.001, respectively). The HEb was
not significantly different between the NGT and T2DM groups (55.20%±12.91% vs. 64.26%±9.27%, P=0.064). The HEpost appeared to be different between the NGT and T2DM groups (49.20%±20.79% vs. 66.99%±10.72%, P=0.028), which lost statistical significance after adjusting for age differ- ence (P=0.141).
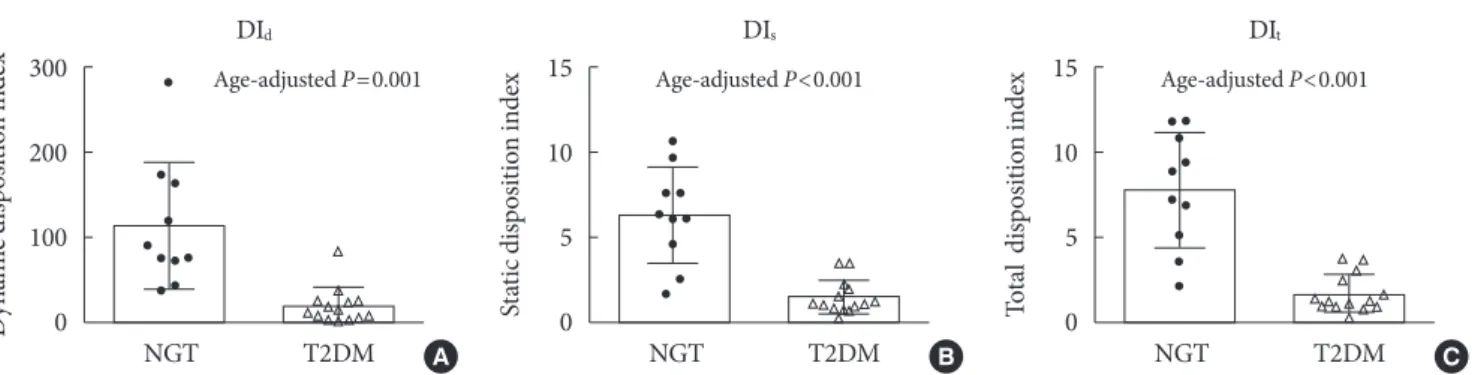
Disposition indexes between NGT and T2DM groups The T2DM group had significantly lower DId, DIs, and DIt than the NGT group (DId: 20.7±19.9 [×10–12 dL/kg/min per pmol/
L] vs. 114.7±74.6 [×10–12 dL/kg/min per pmol/L], P=0.001, age-adjusted P<0.001; DIs: 1.6±1.0 [×10–12 dL/kg/min2 per pmol/L] vs. 6.4±2.8 [×10–12 dL/kg/min2 per pmol/L], P<
0.001, age-adjusted P<0.001; DIt: 1.8±1.1 [×10–12 dL/kg/min2 per pmol/L] vs. 7.9±3.4 [×10–12 dL/kg/min2 per pmol/L], P<0.001, age-adjusted P<0.001, respectively) (Fig. 2). The hy- Fig. 1. The indexes for (A) insulin sensitivity (SI) and (B) basal, (C) dynamic, (D) static, and (E) total β-cell responsivity (Φb, Φd, Φs, and Φt), (F) basal hepatic in- sulin extraction ratio (HEb), and (G) post-glucose challenge hepatic insulin ex- traction ratio (HEpost). The Mann-Whitney test was used to compare the indexes between the groups. NGT, normal glucose tolerance; T2DM, type 2 diabetes mellitus; NS, not significant.
60
40
20
0
50 40 30 20 10 0
8 6 4 2 0
80 60 40 20 0
1,500
1,000
500
0
100 80 60 40 20 0
100 80 60 40 20 0
Insulin sensitivityStatic responsivity Basal responsivityTotal secretion index Dynamic sensitivityBasal hepatic extraction ratio (%)
Post-glucose hepatic extraction ratio (%)
NGT T2DM
NGT T2DM
NGT T2DM
NGT T2DM
NGT T2DM
NGT T2DM
NGT T2DM
SI
Φs
Φb
Φt
Φd
HEb
HEpost
P=0.024
Age-adjusted P=NS
Age-adjusted P<0.001 Age-adjusted P<0.001
Age-adjusted P=0.005
P=NS
Age-adjusted P=NS A
D
B
E
C
F
G
perbolic relation is shown in the three DI metrics in Fig. 3. The hyperbolic line for the T2DM group was located in the left- ward and downward region of the NGT group.
Correlation between other indexes of insulin secretion or insulin action and oral minimal model indexes
As shown in Fig. 4, the PCGR has significant correlation with the dynamic and static responsivity indexes (r=0.77, P<0.001 and r=0.89, P<0.001, respectively). The Matsuda index was significantly correlated with insulin sensitivity (r=0.51, P=
0.011), whereas HOMA-IR did not show any significance (r=
–0.21, P=0.105).
DISCUSSION
In this Korean study, SI and β-cell responsivity indexes (Φd,
Φs, and Φt) were lower in the patients with T2DM than in the individuals with NGT. Compared to the NGT group, insulin sensitivity was 33.9% lower, and the Φd, Φs, and Φt were 74.1%, 58.3%, and 63.3% lower, respectively, in the T2DM group. Our results were in line with those of previous studies, showing decreased insulin sensitivity and insulin secretion in Korean T2DM patients, which were conducted with the eug- lycemic hyperinsulinemic clamp method [29], the hypergly- cemic clamp method [30], or the IVGTT-based minimal model [31]. Compared to other methods, the oral minimal model has advantages for the separate assessment of insulin sensitivity and dynamic nature of β-cell responsivity simulta- neously from a single data set. There are many surrogate mea- sures for insulin sensitivity and/or β-cell function, such as HOMA methods [28], quantitative insulin sensitivity check index (QUICKI) [32], and Matsuda index [27]. Fasting mea- Fig. 2. The (A) dynamic, (B) static, and (C) total disposition indexes (DId, DIs, and DIt) in the patients with type 2 diabetes melli- tus (T2DM) and individuals with normal glucose tolerance (NGT). The Mann-Whitney test was used to compare the indexes between the groups.
300
200
100
0
15
10
5
0
15
10
5
Dynamic disposition index spdexn intioStosiic diat osin intiodexspl ditaTo 0
NGT T2DM NGT T2DM NGT T2DM
DId DIs DIt
Age-adjusted P=0.001 Age-adjusted P<0.001 Age-adjusted P<0.001
A B C
Fig. 3. Distribution of insulin sensitivity and secretion in the patients with type 2 diabetes (T2DM) and individuals with normal glucose tolerance (NGT). The hyperbolae for the (A) dynamic, (B) static, (C) and total disposition (DIs, DId, and DIt) indexes are shown for the NGT group (black line and open black circles) and the T2DM group (gray line and open gray circles) with a DI metric. Each circle or square represents a single subject. The subjects in each group presumably share the same disposition in- dex, and a tendency toward the leftward and downward positioning in the T2DM patients can be observed. Φd, dynamic; Φs, static; Φt, total β-cell responsivity.
35 30 25 20 15 10
5 Insulin sensitivity (S)I 0
20 40 60 80 100 Φs
DIs
B
35 30 25 20 15 10
5 Insulin sensitivity (S)I 0
20 40 60 80 100 Φt
DIt
C 35
30 25 20 15 10
5 Insulin sensitivity (S)I 0
200 400 600 800 1,000 Φd
DId
NGTT2DM NGT
T2DM NGT
T2DM
A
sures, such as HOMA-insulin resistance and QUICKI, mainly reflect hepatic insulin sensitivity rather than peripheral insu- lin sensitivity [33,34]. Because HOMA β-cell function is also derived from fasting data [28], it cannot describe the dynam- ics of postprandial insulin secretion. In contrast, the SI calcu- lated by the oral minimal model represents not only hepatic but also peripheral insulin sensitivity [3,35,36]. Although the Matsuda index using the mean insulin and glucose responses during the OGTT correlates well with the insulin sensitivity measured by the euglycemic hyperinsulinemic clamp [27], this index is not matched for a measure of β-cell function that reflects the dynamic nature of postprandial insulin secretion.
In this regard, the benefits of the oral minimal model are pro- vision of comprehensive measures for insulin sensitivity, β-cell function, and hepatic extraction of insulin. In addition, the indexes obtained from the oral minimal model and other indexes of postchallenge insulin secretion and insulin sensi-
tivity were well correlated.
The oral minimal model is simpler than the IVGTT-based minimal model [3,8], which requires much more frequent blood sampling and control for blood glucose concentrations.
Therefore, it can be broadly applied for various clinical stud- ies. First, the model can be used to assess characteristics of glucose metabolism in a large number of subjects. A previous study, which enrolled as many as 250 Japanese and Caucasian subjects, showed lower β-cell function and higher insulin sen- sitivity in the Japanese subjects than the Caucasian subjects [37]. Second, the oral minimal model can be used to assess the effect of antidiabetic drugs on insulin sensitivity and β-cell function, as shown elsewhere [38]. Taken together, the oral minimal model may reduce the burdens of effort in measur- ing physiologic parameters of glucose homeostasis in various forms of clinical research.
The oral minimal model has good expandability and can be Fig. 4. Correlation analyses between the indexes obtained in the oral minimal model and other indexes of insulin secretion or insulin sensitivity (SI). Spearman correlation analysis was used. Correlations of (A) dynamic (Φd) and (B) static β-cell responsiv- ity (Φs) with postprandial C-peptide to glucose ratio (PCGR) are shown. Correlations of insulin sensitivity (SI) with (C) Matsu- da index and (D) homeostasis model assessment of insulin resistance (HOMA-IR) are shown.
1,500
1,000
500
0
0.0006
0.0004
0.0002
0
50 40 30 20 10 0
0.0006
0.0004
0.0002
0
ΦdSI ΦsSI
1 2 3 4
5 10 15
1 2 3 4
2 4 6
PCGR
Matsuda index
PCGR
HOMA-IR r=0.77, P<0.001
r=0.51, P=0.011
r=0.89, P<0.001
r=−0.21, P=0.105 A
C
B
D
readily modified in an engineering manner. To develop a fur- ther upgraded version of the oral minimal model, the incretin effect would be a candidate component to be incorporated in the model. If equations describing the incretin effect [39] were added to the oral minimal model, it could become a more physiologic model. Since a glucagon-adapted model has also been developed [40], it might be useful to assess the glycemic responses to specific antidiabetic drugs and to establish algo- rithms for the bihormonal artificial pancreas.
This study had some limitations. First, in this study, insulin and C-peptide were measured at 0, 15, and 30 minutes during the first 30 minutes, whereas other studies [14,25] included 0-, 10-, 20-, and 30-minute samples. Since the insulin response during the first 30 minutes is crucial to determine the dynam- ic β-cell responsivity index, more frequent measurements would support a more accurate estimation. Second, we did not directly validate the oral minimal model indexes with the values of the hyperglycemic clamp and the euglycemic hyper- insulinemic clamp studies, which are considered the gold standard methods for measuring insulin secretion and SI. Lastly, the subjects with prediabetes, such as impaired fasting glucose or impaired glucose tolerance, were not included in this study.
In this study, in accordance with the results of previously published studies using other physiologic methods in Kore- ans, the insulin sensitivity index, β-cell responsivity indexes, and disposition indexes obtained by the oral minimal model were generally lower in the T2DM group than the NGT group. Based on our results, the oral minimal model can also be applied to Koreans to evaluate insulin sensitivity and dy- namics of insulin secretion using OGTT data.
CONFLICTS OF INTEREST
No potential conflict of interest relevant to this article was re- ported.
ACKNOWLEDGMENTS
This work was supported by National Research Foundation of Korea (NRF) grants funded by the Korean Government (2015 M1A3A3A02012636, 2011-0009127, and 2010-0024462).
REFERENCES
1. Defronzo RA. Banting lecture. From the triumvirate to the ominous octet: a new paradigm for the treatment of type 2 di- abetes mellitus. Diabetes 2009;58:773-95.
2. Brubaker PL, Ohayon EL, D’Alessandro LM, Norwich KH. A mathematical model of the oral glucose tolerance test illustrat- ing the effects of the incretins. Ann Biomed Eng 2007;35:
1286-300.
3. Cobelli C, Dalla Man C, Toffolo G, Basu R, Vella A, Rizza R.
The oral minimal model method. Diabetes 2014;63:1203-13.
4. Cobelli C, Toffolo GM, Dalla Man C, Campioni M, Denti P, Caumo A, Butler P, Rizza R. Assessment of beta-cell function in humans, simultaneously with insulin sensitivity and hepatic extraction, from intravenous and oral glucose tests. Am J Physi- ol Endocrinol Metab 2007;293:E1-15.
5. Hovorka R, Canonico V, Chassin LJ, Haueter U, Massi-Bene- detti M, Orsini Federici M, Pieber TR, Schaller HC, Schaupp L, Vering T, Wilinska ME. Nonlinear model predictive control of glucose concentration in subjects with type 1 diabetes.
Physiol Meas 2004;25:905-20.
6. Lee JC, Kim M, Choi KR, Oh TJ, Kim MY, Cho YM, Kim K, Kim HC, Kim S. In silico evaluation of glucose control proto- cols for critically ill patients. IEEE Trans Biomed Eng 2012;59:
54-7.
7. James G, Witten D, Hastie T, Tibshirani R. An introduction to statistical learning: with applications in R. New York: Springer;
2013. p37.
8. Bergman RN, Ider YZ, Bowden CR, Cobelli C. Quantitative estimation of insulin sensitivity. Am J Physiol 1979;236:E667- 77.
9. Staten MA, Kelley DE. Using oral challenge testing to assess insulin action and secretion with mathematical modeling. Di- abetes 2014;63:1188-90.
10. Caumo A, Vicini P, Zachwieja JJ, Avogaro A, Yarasheski K, Bier DM, Cobelli C. Undermodeling affects minimal model index- es: insights from a two-compartment model. Am J Physiol 1999;276(6 Pt 1):E1171-93.
11. Toffolo G, De Grandi F, Cobelli C. Estimation of beta-cell sen- sitivity from intravenous glucose tolerance test C-peptide data. Knowledge of the kinetics avoids errors in modeling the secretion. Diabetes 1995;44:845-54.
12. Campioni M, Toffolo G, Basu R, Rizza RA, Cobelli C. Mini- mal model assessment of hepatic insulin extraction during an oral test from standard insulin kinetic parameters. Am J
Physiol Endocrinol Metab 2009;297:E941-8.
13. Basu R, Dalla Man C, Campioni M, Basu A, Klee G, Toffolo G, Cobelli C, Rizza RA. Effects of age and sex on postprandial glucose metabolism: differences in glucose turnover, insulin secretion, insulin action, and hepatic insulin extraction. Dia- betes 2006;55:2001-14.
14. Breda E, Cavaghan MK, Toffolo G, Polonsky KS, Cobelli C.
Oral glucose tolerance test minimal model indexes of beta-cell function and insulin sensitivity. Diabetes 2001;50:150-8.
15. Burattini R, Morettini M. Identification of an integrated math- ematical model of standard oral glucose tolerance test for characterization of insulin potentiation in health. Comput Methods Programs Biomed 2012;107:248-61.
16. Cho YM. Incretin physiology and pathophysiology from an Asian perspective. J Diabetes Investig 2015;6:495-507.
17. Dalla Man C, Caumo A, Cobelli C. The oral glucose minimal model: estimation of insulin sensitivity from a meal test. IEEE Trans Biomed Eng 2002;49:419-29.
18. McDonald C, Dunaif A, Finegood DT. Minimal-model esti- mates of insulin sensitivity are insensitive to errors in glucose effectiveness. J Clin Endocrinol Metab 2000;85:2504-8.
19. Caumo A, Bergman RN, Cobelli C. Insulin sensitivity from meal tolerance tests in normal subjects: a minimal model in- dex. J Clin Endocrinol Metab 2000;85:4396-402.
20. Steil GM, Hwu CM, Janowski R, Hariri F, Jinagouda S, Darwin C, Tadros S, Rebrin K, Saad MF. Evaluation of insulin sensitivi- ty and beta-cell function indexes obtained from minimal mod- el analysis of a meal tolerance test. Diabetes 2004;53:1201-7.
21. Kim M, Oh TJ, Lee JC, Choi K, Kim MY, Kim HC, Cho YM, Kim S. Simulation of oral glucose tolerance tests and the cor- responding isoglycemic intravenous glucose infusion studies for calculation of the incretin effect. J Korean Med Sci 2014;29:
378-85.
22. Venkataraman P. Applied optimization with MATLAB pro- gramming. 2nd ed. Hoboken: John Wiley & Sons; 2009. p358.
23. Van Cauter E, Mestrez F, Sturis J, Polonsky KS. Estimation of insulin secretion rates from C-peptide levels. Comparison of individual and standard kinetic parameters for C-peptide clearance. Diabetes 1992;41:368-77.
24. Dalla Man C, Yarasheski KE, Caumo A, Robertson H, Toffolo G, Polonsky KS, Cobelli C. Insulin sensitivity by oral glucose minimal models: validation against clamp. Am J Physiol Endo- crinol Metab 2005;289:E954-9.
25. Breda E, Toffolo G, Polonsky KS, Cobelli C. Insulin release in impaired glucose tolerance: oral minimal model predicts nor-
mal sensitivity to glucose but defective response times. Diabe- tes 2002;51 Suppl 1:S227-33.
26. Lee EY, Hwang S, Lee SH, Lee YH, Choi AR, Lee Y, Lee BW, Kang ES, Ahn CW, Cha BS, Lee HC. Postprandial C-peptide to glucose ratio as a predictor of beta-cell function and its use- fulness for staged management of type 2 diabetes. J Diabetes Investig 2014;5:517-24.
27. Matsuda M, DeFronzo RA. Insulin sensitivity indices ob- tained from oral glucose tolerance testing: comparison with the euglycemic insulin clamp. Diabetes Care 1999;22:1462-70.
28. Matthews DR, Hosker JP, Rudenski AS, Naylor BA, Treacher DF, Turner RC. Homeostasis model assessment: insulin resis- tance and beta-cell function from fasting plasma glucose and insulin concentrations in man. Diabetologia 1985;28:412-9.
29. Chae BN, Lee SK, Hong EG, Chung YS, Lee KW, Kim HM.
The role of insulin secretion and insulin resistance in the de- velopment of Korean type 2 diabetes mellitus. J Korean Diabe- tes Assoc 1998;22:491-50.
30. Oh TJ, Park KS, Cho YM. Correlation of the incretin effect with first- and second-phase insulin secretions in Koreans with various glucose tolerance statuses. Clin Endocrinol (Oxf) 2015;83:59-66.
31. Song J, Oh JY, Sung YA, Pak YK, Park KS, Lee HK. Peripheral blood mitochondrial DNA content is related to insulin sensi- tivity in offspring of type 2 diabetic patients. Diabetes Care 2001; 24:865-9.
32. Katz A, Nambi SS, Mather K, Baron AD, Follmann DA, Sulli- van G, Quon MJ. Quantitative insulin sensitivity check index:
a simple, accurate method for assessing insulin sensitivity in humans. J Clin Endocrinol Metab 2000;85:2402-10.
33. Otten J, Ahren B, Olsson T. Surrogate measures of insulin sen- sitivity vs the hyperinsulinaemic-euglycaemic clamp: a meta- analysis. Diabetologia 2014;57:1781-8.
34. Reaven GM. What do we learn from measurements of HOMA- IR? Diabetologia 2013;56:1867-8.
35. Dalla Man C, Caumo A, Basu R, Rizza R, Toffolo G, Cobelli C.
Measurement of selective effect of insulin on glucose disposal from labeled glucose oral test minimal model. Am J Physiol Endocrinol Metab 2005;289:E909-14.
36. Man CD, Toffolo G, Basu R, Rizza RA, Cobelli C. Use of la- beled oral minimal model to measure hepatic insulin sensitiv- ity. Am J Physiol Endocrinol Metab 2008;295:E1152-9.
37. Moller JB, Dalla Man C, Overgaard RV, Ingwersen SH, Tornoe CW, Pedersen M, Tanaka H, Ohsugi M, Ueki K, Lynge J, Vas- concelos NM, Pedersen BK, Kadowaki T, Cobelli C. Ethnic
differences in insulin sensitivity, beta-cell function, and hepat- ic extraction between Japanese and Caucasians: a minimal model analysis. J Clin Endocrinol Metab 2014;99:4273-80.
38. Alba M, Ahren B, Inzucchi SE, Guan Y, Mallick M, Xu L, O’Neill EA, Williams-Herman DE, Kaufman KD, Goldstein BJ. Sitagliptin and pioglitazone provide complementary effects on postprandial glucose and pancreatic islet cell function. Di- abetes Obes Metab 2013;15:1101-10.
39. Dalla Man C, Micheletto F, Sathananthan A, Rizza RA, Vella A, Cobelli C. A model of GLP-1 action on insulin secretion in nondiabetic subjects. Am J Physiol Endocrinol Metab 2010;298: E1115-21.
40. Herrero P, Georgiou P, Oliver N, Reddy M, Johnston D, Toumazou C. A composite model of glucagon-glucose dy- namics for in silico testing of bihormonal glucose controllers.
J Diabetes Sci Technol 2013;7:941-51.