Assessment of Mechanical Engineering Research Output
using Scientometric Indicators: A Comparative Study of
India, Japan, and South Korea
Open Access
Accepted date: June 1, 2017 Received date: April 12, 2017
*Corresponding Author: D. M. Pattanashetti Research Student
Dept. of Library & Information Science University of Mysore, Mysuru, India E-mail: [email protected]
All JISTaP content is Open Access, meaning it is accessible online to everyone, without fee and authors’ permission. All JISTaP content is published and distributed under the terms of the Creative Commons Attribution License (http:/ creativecommons. org/licenses/by/3.0/). Under this license, authors reserve the copyright for their content; however, they permit anyone to unrestrictedly use, distribute, and reproduce the content in any medium as far as the original authors and source are cited. For any reuse, redistribution, or reproduction of a work, users must clarify the license terms under which the work was produced. ABSTRACT
This study examined the mechanical engineering research output from India, Japan, and South Korea on different parameters including growth, collaboration indices, and activity index. The purpose of the study is to understand the overall development of mechanical engineering through analytical approaches applied on the scholarly out-come of the countries considered for the study. The study focuses on analysing the articles published by India, Ja-pan, and South Korea, and is restricted to articles indexed in the Science Citation Index – Web of Science for the pe-riod 2000 to 2014. The ratios of number of paper to citations for India, Japan, and Korea are 20,836: 1,97,679; 24,494: 2,04,393; and 30,578: 2,66,902 respectively for the period 2000-2014. The findings show that there is a decline in Japanese publications in mechanical engineering, whereas other two countries have recorded an increasing trend. While India has tripled its publications in a span of 15 years, South Korea, on the other hand, has doubled its pub-lications in the same span of time. There has been an increasing trend towards collaboration in almost all fields of science and technology. However, the extent of collaboration and their rate of growth varied for one subject to another, one branch to another branch of the same subject, and from one country to another country. The present study analyses the growth of research publications of the mechanical engineering domain including authorship distribution, collaboration indices, prominent journals, and activity index.
Keywords: Scientometrics, Mechanical Engineering, Doubling Time, Activity Index, Growth Rate for Scientific Publication, India, Japan, South Korea, Authorship Distribution, Collaboration Indices, Bradford’s Law
D. M. Pattanashetti *
Dept. of Library & Information Science University of Mysore, Mysuru, India E-mail: [email protected]
N. S. Harinarayana
Dept. of Library & Information Science University of Mysore, Mysuru, India E-mail: [email protected]
http://dx.doi.org/10.1633/JISTaP.2017.5.2.5 eISSN : 2287-4577 pISSN : 2287-9099
1. INTRODUCTION
Mechanical engineering (UNESCO, 2010) emerged as a field during the industrial revolution in Europe in the 18th century; however, its development can be traced back several thousand years around the world. Mechanical engineering was driven forward by the suc-cessive waves of innovation and industrial revolutions. The literature on the subject recognizes seven waves in the growth and development of mechanical engineer-ing startengineer-ing from the 1750’s (UNESCO, 2010). The last three waves have had significant impacts on carving the road map of the growth of mechanical engineering as a discipline and a profession. The fifth wave, based on information and telecommunications, was related to electrical and mechanical engineering. The sixth wave, beginning around 1980, was based on new knowledge production and application in such fields as IT, biotech-nology, and materials. The seventh wave, beginning around 2005, and the current one, based on sustainable ‘green’ engineering and technology to promote sustain-able development, climate change mitigation, and adap-tation, will once again be focused particularly on a core of mechanical engineering.
The developments discussed above are significant in terms of total R&D expenditures at the global level which have been on the rise. The indicators published in 2016 by the National Science Foundation (2014, pp. 4-17) highlight that China, South Korea, and India are investing heavily in R&D and in developing a well-ed-ucated workforce skilled in science and engineering. The R&D expenditure in Asia is fast growing and the countries of India, China, South Korea, and Japan are the front runners, which was predicted many years ago. The high-technology manufacturing industries in Chi-na, Japan, and South Korea too have risen rapidly since 1998 (National Science Foundation, 2014, pp. 6-9).
Borrego (2007) studied the engineering research outcome to understand the role of engineering edu-cation coalitions in advancing the field of engineering education. Engineering research has grown into a large research community with an ever-increasing number of publications and scholars. Borrego, Froyd, and Hall (2010) and Wankat (2012) found that engineering edu-cation scholars are not well informed about research by other scholars and the research outcomes. For mechan-ical engineering, being among the oldest and greatly
evolved disciplines, it remains unclear whether the mechanical engineering community is experiencing the same gap. This gap has high potential of bringing down the migration of research findings into practice.
Asia has a long history of engineering growth and this study plans to highlight the research growth with special reference to India, Japan, and South Korea. The research outcome from India, China, South, Korea and Japan have a high publication productivity compared to other countries of Asia in the area of mechanical engineering, according to data retrieved from the Science Citation Index for the period 2000-2014. Globally, the USA tops the list with 1,22,314 articles, followed by China with 69,515 articles, which is followed by England with 31,054 articles. While authors from India, Japan, and South Korea have published 20,850, 30,578 and 24,494 articles respectively, China has a larger number with 69,515 articles in Asia which is more than double the articles published by Japan, which is the highest among the three. The intention of this study is to have a com-parison of the countries on an equal footing. Hence, the study revolves around the contributions of the three countries excluding China. Further, the first author of this paper, a mechanical engineer and also a library pro-fessional, has a natural flavour towards the discipline. These are the drivers which motivated the authors to take up a study which focuses on scientometric analysis of mechanical engineering.
The present study aims at finding out the growth of research publications of the mechanical engineering domain from India, Japan, and South Korea, including authorship distribution, collaboration indices, and ac-tivity index.
2. REVIEW OF LITERATURE
This study describes and explores the factual picture of research interests within mechanical engineering by analyzing the literature.
Bibliometrics has established itself as a viable and dis-tinctive research technique for studying the science of science based on bibliographical and citation data (Gup-ta & Gup(Gup-ta, 2004). There has been an increasing interest in using scientometric information for assessing or monitoring research activities for the past few decades. The discipline devoted to the quantitative study and
evaluation of the scientific literature is called sciento-metrics or bibliosciento-metrics. Bibliosciento-metrics has been applied to the evaluation of scientific disciplines, national scien-tific production, and bibliographic databases, and it pro-vides valuable tools to describe scientific activity in the past and to orient future research (Schoepflin & Glanzel, 2001). The aim of scientometrics is to provide quantita-tive characterizations of scientific activity. Because of the particular importance of publications in scientific com-munities, it largely overlaps with bibliometrics, which is quantitative analysis of media in any written form.
Bibliometric studies on engineering are rather scant-ly found. Kim (2002) compared the citation patterns of researchers from physics and mechanical engineering domains in Korea and found that the type of publica-tion source and type of authorship were found to influ-ence the choice of sources cited by them. Noteworthy is that articles in physics journals from Japan are more frequently cited in papers written with purely Korean authorship than those with international co-author-ship. In addition, articles in Korean journals are more highly cited in nationally authored papers than in internationally co-authored papers, in both fields. Rav-ichandra Rao and Suma (1999) analysed the Indian engineering literature and found that the engineers in India publish in a few selected journals and only a few of the institutions are concentrated in engineer-ing research. They observed that research output in applied physics, light and optics, bioengineering, and information science are increasing both at the world and India level. Kaur and Gupta (2009) examined India’s performance based on its publication output in immunology and microbiology during 1999-2008, based on several parameters including the country’s annual average growth rate, global publications share and rank, institutional profile of top 15 institutions, international collaboration profiles and major collabo-rative partners, patterns of communication in national and international journals, and characteristics of its top 15 most productive authors. Karamourzov (2012) assessed the results of the independent development of the Commonwealth of Independent States (CIS) countries in the field of science over the period 1990-2009. Jesiek et al. (2011) studied the global trends in engineering education with the help of scientometric indicators and recommended ways to build global ca-pacities in engineering education, and suggested steps
to grow cross-national collaboration. In a similar study comparing the outputs of India and China in the fields of sciences and engineering, Panat (2014) found that Chinese research output is increasing compared to India’s. In a recent study, Banshal, Muhuri, Singh, and Basu (2017) analyse the research output of 16 (out of 23) of the most prestigious engineering and technology institutions of India (Indian Institute of Technology), comparing with the likes of MIT-USA and NTU-Sin-gapore. In the engineering disciplines, mechanical engineering stands in the top 5, inviting policy mak-ers/funding agencies to make strategic decisions in terms of the allocation of funds and resources toward upliftment of the discipline. In a recent similar cross national comparitive assessment on endocrinology and metabolism, Lyu, Pu, and Zhang (2017) compare the research output of China, Japan, and South Korea. The research articles from China and South Korea in-creased in a span of 10 years from 2005-2014, but for Japan there wasn’t significant increase.
Sangam, Keshava, and Agadi (2010), Gupta, Kshitij, and Verma (2011), Bhattacharya, Shilpa, and Bhati (2012), Elango and Rajendran (2015), Hadagali and Anandhalli (2015), Singh, Banshal, Singhal, and Ud-din (2015), Liu, Lin, Wang, Peng, and Hong (2016), Barrot (2017), Zou and Laubichler (2017), and Nobre and Tavares (2017) are studies assessing scientific re-search output in the last ten years, to mention a few. There has been an increasing trend towards collabo-ration between countries and institutions in almost all fields of science and technology. However, the extent of collaboration and their rate of growth varies from one subject to another, one branch to another branch of the same subject, and from one country to another country. The present study aims at finding the growth of research publications of the mechanical engineering domain from India, Japan, and South Korea.
3. METHODOLOGY
The data for this study were collected from the Science Citation Index- Expanded (SCI-E) of Web of Science, a comprehensive and exhaustive database enveloping almost all subjects of Science and Tech-nology. Its coverage in the engineering field is quite comprehensive and well acknowledged. The database
was searched for collecting documents pertaining to the areas related to mechanical engineering published between 2000 and 2014.
The query used to search documents from South Korea is:
CU = South Korea AND WC= (Mechanics OR En-gineering Mechanical OR Thermodynamics OR Engi-neering, Aerospace OR Engineering Manufacturing OR Engineering Industrial OR Robotics). The search results were restricted to Science Citation Index Expanded with the time span 2000-2014. Indian and Japanese publications were retrieved by changing CU=India and CU=Japan in the query respectively.
The data set was collected in the month of April 2016. Articles, conference proceedings, and review articles are considered for the present study. The data were then analysed with the help of Microsoft Excel, and formulae related to scientometric analysis have been used to calculate the desired results. Scientomet-ric indicators like collaboration indices and activity index have been calculated in addition to publications growth and author productivity, and the most promi-nent journals are calculated.
The collaboration indices have been calculated, and the formulae to calculate the various indices are stated here:
Where fi is the total number of articles with i authors
published during a certain period of time,
N is the total number of articles published during the same time period,
k is the number of authors per article in each disci-pline,
f1 is the number of single authored papers,
fj is the number of articles with a single author
pub-lished during a certain period of time.
The Activity Index (AI) is also calculated, which characterizes the relative research effort of a country for a given subjects. AI is defined as
AI= given field’s share in the country’s publication outputgiven field’s share in the world’s publication output
Mathematically AI = nij/nio noj/noo *100
Where:
nij - Indian / South Korean output of papers in particular field
nio - Total Indian / South Korean output on all subjects
noj - World output of papers in particular field noo - Total world output on all subjects
4. RESULTS AND DISCUSSION
This section provides the results after application of scientometric tools to analyse the outcome.
4.1. Growth of Publications
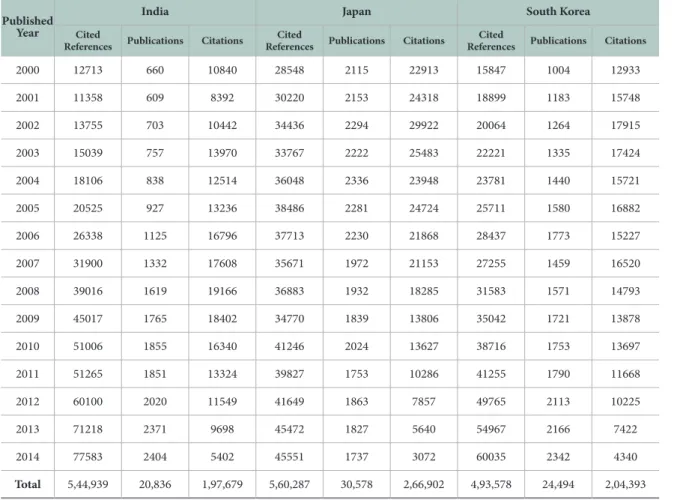
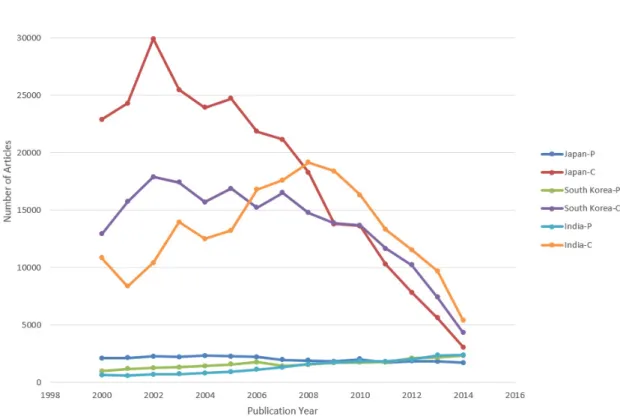
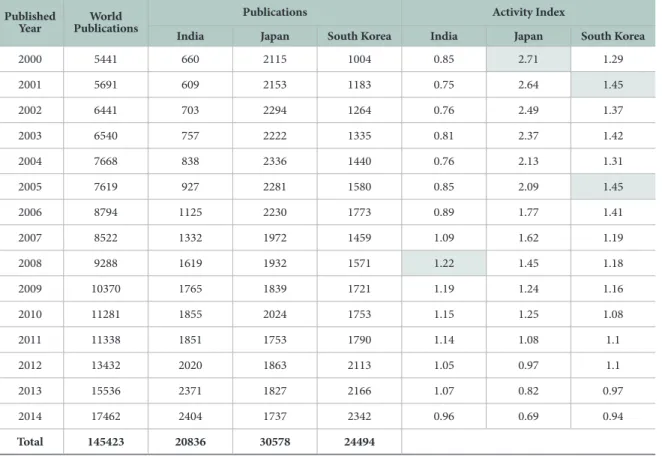
One of the obvious features of scientific literature in recent years has been its rate of growth. A number of growth models have been proposed regarding the rate of growth. Way back in 1963 Price (1963) proposed an exponential rate of growth of scientific literature. He predicted a regular exponential growth with a doubling period of ten to fifteen years. For testing the fitness of the Price model, it’s found that the articles doubled in the topic considered here from India in the span of seven years, from 660 articles in 2,000 to 1,332 articles in 2008. Similarly, for South Korea the doubling period is 12 years with 1,004 articles in 2000 to 2,113 articles in 2013. Table 1 provides the temporal development of research publications, and related references and cita-tions for the articles published in the time span studied. As far as Japan is considered, there was a thin change both upwards and downwards for the period studied. Figure 1 puts the data into a pictorial representation with the publications and citations data. Interestingly the research publications’ slope for Japan is downward from 2,115 articles in 2000 to 1,737 articles in 2014. Further analysis showed that out of the top 10 Japa-nese journals which were indexed in Web of Science in 2000, only one continues to be indexed in 2014, and nine of them were discontinued over the years. The number of journals indexed dropped to 137 in 2014 from 215 in 2000, accounting for a drop-percentage of 36.27; while for India, although there is a drop in the number of indexed journals between 2000 and 2014, the drop percentage is not as significant as in Japan’s case. 42 out of 50 (in 2000) Indian journals continue to be indexed in 2014 with a drop-percentage of 16.
Indi-an authors published their articles in 286 journals. The drop-percentage for South Korean journals is 21.08 with 131 out of 166 (2000) journals continuing to be indexed in 2014. South Korean authors published their articles in 268 journals in 2014.
India is slightly ahead in publications compared to South Korea and Japan in 2014, even though the re-search publications were less compared to both coun-tries. A total of 2,66,902 articles cited 30,578 articles published by Japan, likewise for South Korea 2,04,393 articles cite 24,494 articles, and 20,836 articles pub-lished by India received 1,97,679 citations. The citations per paper rate is highest for India with 9.5 followed by 8.7 for Japan and 8.3 for South Korea. Gross drop can be identified for South Korea beginning in 2005 when there was a drastic increase in publications in 2006, and
similarly for India during the same time frame. But in-terestingly there was a drop in publications beginning in 2006 in South Korea and it took five years to regain numbers.
4.2. Authorship Distribution
Due to the advent of technology in the last few decades, the collaboration between researchers has increased, and multiple-authorship has been a charac-teristic feature of modern science (Balog, 1980). The literature on any subject reflects not only the basic publishing pattern but also the characteristics of the authors themselves. Collaboration in research is said to have taken place when two or more scientists work together on a scientific problem or project and contrib-ute their physical and mental efforts. Price (1963) was
Table 1. Growth of Publications and Citations
Published Year
India Japan South Korea
Cited
References Publications Citations ReferencesCited Publications Citations ReferencesCited Publications Citations
2000 12713 660 10840 28548 2115 22913 15847 1004 12933 2001 11358 609 8392 30220 2153 24318 18899 1183 15748 2002 13755 703 10442 34436 2294 29922 20064 1264 17915 2003 15039 757 13970 33767 2222 25483 22221 1335 17424 2004 18106 838 12514 36048 2336 23948 23781 1440 15721 2005 20525 927 13236 38486 2281 24724 25711 1580 16882 2006 26338 1125 16796 37713 2230 21868 28437 1773 15227 2007 31900 1332 17608 35671 1972 21153 27255 1459 16520 2008 39016 1619 19166 36883 1932 18285 31583 1571 14793 2009 45017 1765 18402 34770 1839 13806 35042 1721 13878 2010 51006 1855 16340 41246 2024 13627 38716 1753 13697 2011 51265 1851 13324 39827 1753 10286 41255 1790 11668 2012 60100 2020 11549 41649 1863 7857 49765 2113 10225 2013 71218 2371 9698 45472 1827 5640 54967 2166 7422 2014 77583 2404 5402 45551 1737 3072 60035 2342 4340 Total 5,44,939 20,836 1,97,679 5,60,287 30,578 2,66,902 4,93,578 24,494 2,04,393
among the first to observe that multi-authored papers are steadily increasing with a simultaneous reduction in single authored papers. His observations were based on sampling of Chemical Abstracts for the period of 1910-1960.
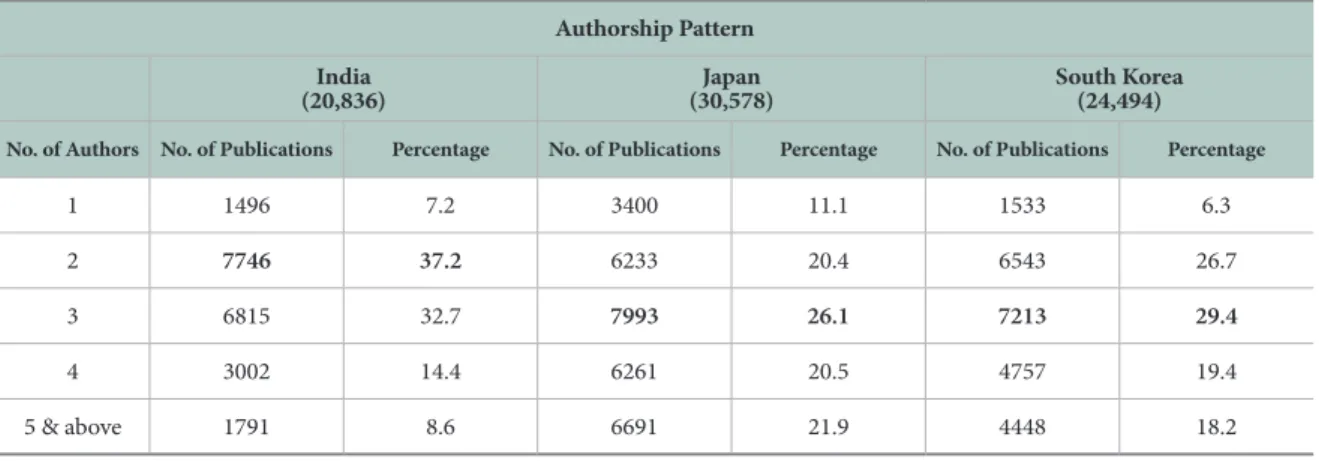
The pattern of co-authorship was studied by dis-tributing the output of publications with respect to number of authors. The distribution was done as single author, two authors, up to four authors, and the rest were clubbed into one group named five and above group. Table 2 clearly shows that articles with three au-thors in both Japan and South Korea are on top when compared to the other set of articles. Researchers pub-lishing articles in Japan and South Korea preferred to work in large groups. In India, researchers are becom-ing more and more aware of the importance of
collab-oration where articles with two authors are in higher numbers compared to the other sets of articles. Overall, 29% of the total number of articles (for all three coun-tries) have been authored by three authors, followed by 28% with two authors. Interestingly 18% of the total number of articles are authored by four authors, and only 8% of the articles are authored by a single author. This reveals that collaboration has gained momentum and the trend is towards two-authored and three-au-thored publications. It would be pertinent to mention here that single author does not necessarily mean no collaboration. The majority of single authors were found to have multiple addresses thereby meaning that they were utilizing the facilities of other institutions within the country and thus are considered as domes-tic collaboration. Collaboration between authors in
Japan and South Korea is slightly better than compared to India, as a larger percentage of articles in Japan and South Korea are authored by three authors.
4.3. Collaboration Indices
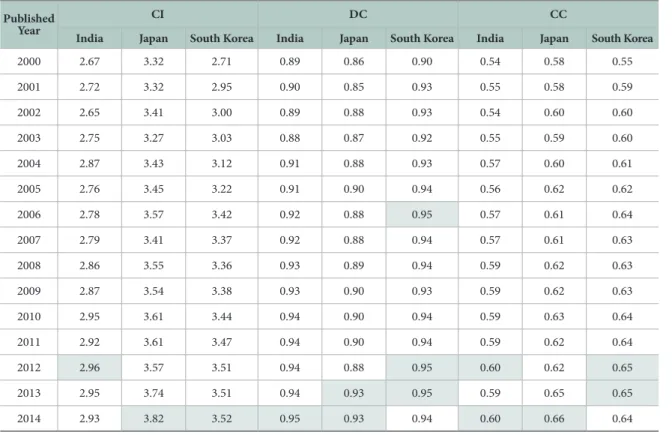
Collaboration is an intense form of interaction that allows for effective communication as well as the shar-ing of competence and other resources (Melin & Pers-son, 1996). To compare the extent of collaboration in two fields (or subfields) or to show the trend towards multiple authorships in a discipline, many studies have used either the mean number of authors per paper, termed the Collaborative Index (CI) by Lawani (1980), and/or the proportion of multiple-authored papers, called Degree of Collaboration (DC) by Subramanyam (1983) as a measure of the strength of collaboration in a discipline. These two measures are shown to be inad-equate by Ajiferuke, Burell, and Tague (1988) and they derived a single measure called Collaborative Coeffi-cient (CC) that incorporates some of the merits of both of the above. The Collaboration Coefficient as defined by Ajiferuke, Burell, and Tague lies between 0 and 1, with 0 corresponding to single authored papers. How-ever it is not 1 for the case where all papers are maxi-mally authored, i.e. every publication in the collection has all authors in the collection as co-authors. The research output indicators revealed the stable growth and increased cooperation in terms of the number of articles, the average number of references, and the
col-laboration index.
In the last section we discussed authorship patterns and saw that Japan and South Korea have published more articles with three authors when compared to India, where two authored publications are more nu-merous. After necessary computations, the indices data are published in Table 3. Japan scores high in terms of collaboration with the maximum CI being 3.82 and minimum being 3.27, followed by South Korea with a maximum of 3.52 CI. India has been a bit more consis-tent in terms of growth in CI compared with Japan and South Korea.
The degree of collaboration (DC) for India on the other hand indicates a steep curve beginning in 2003 with an indication of collaborative research being on the rise, compared to Japan and South Korea where at times in the middle the trend is downwards. All the three indices indicate that collaboration is on the up-ward trend, with yellow occupying the last part of the table. The collaboration coefficients for India, Japan, and South Korea are 0.6, 0.66, and 0.65 respectively which infers that the collaborative pattern is dominant over the single authored papers in this study. This trend, of course, is similar to the trends found in other disciplines as in laser science (Garg & Padhi, 2001), so-cial media (Coursaris & Van Osch, 2014), cloud com-puting (Heilig & Vob, 2014), computer science (Singhal, Sumit Kumar Banshal, Uddin, & Singh, 2015), etc.
Table 2. Authorship Pattern
Authorship Pattern India
(20,836) (30,578)Japan South Korea(24,494)
No. of Authors No. of Publications Percentage No. of Publications Percentage No. of Publications Percentage
1 1496 7.2 3400 11.1 1533 6.3
2 7746 37.2 6233 20.4 6543 26.7
3 6815 32.7 7993 26.1 7213 29.4
4 3002 14.4 6261 20.5 4757 19.4
4.4. Activity Index
In the present study, the Activity Index (AI) has been calculated for different years to see how India, Japan, and South Korea’s performance gradually changed during different years. Activity Index has been used to calcu-late the same. The Activity Index was first suggested by Frame (1977) and used among others by Schubert and Braun (1986), Nagpaul (1995), Karki and Garg (1997), Garg and Padhi (1999), Kumari (2006), Chetri, Saini, and Luthra (2009), and Sagar and Kademani (2011).
The activity index in Table 4 clearly shows that re-search in Japan was high in 2000 and decreased grad-ually, and it is a downward trend altogether. On the other hand South Korea’s research can be compared to a sine wave as in 2001 it was in peak and reached a high in 2005 and took a downward trend from then onwards. On the other hand, India’s research is on the upward trend beginning in 2000, with a minimal downtrend in the middle. Overall there is a significant
rise in terms of articles published by India when com-pared to Japan and South Korea. A graph (Figure 2) has been plotted to display the activity index of all the three countries.
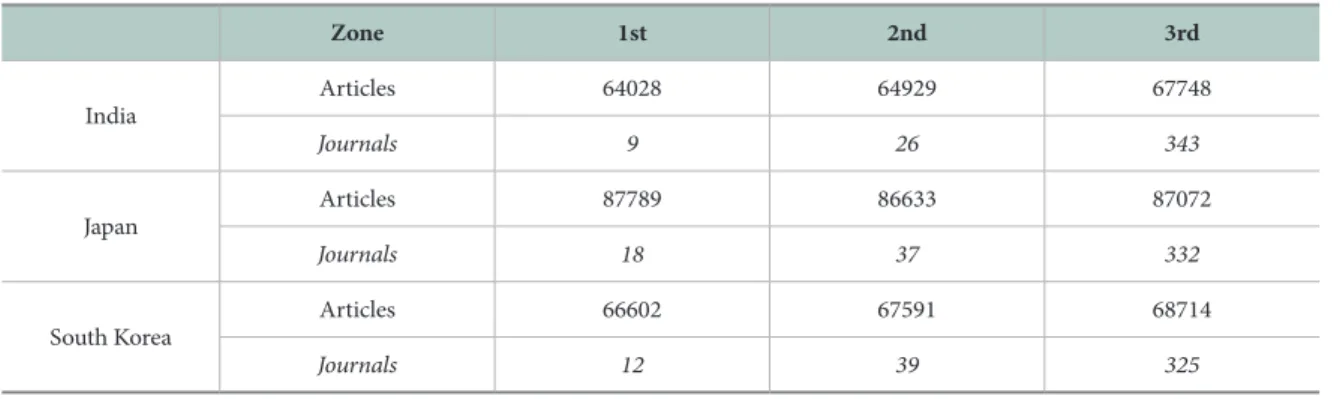
4.5. Bradford’s Law of Scattering
Bradford (1934), a British mathematician, librarian, and documenter at the Science Museum in London revealed a pattern of how literature in a subject is dis-tributed in journals.
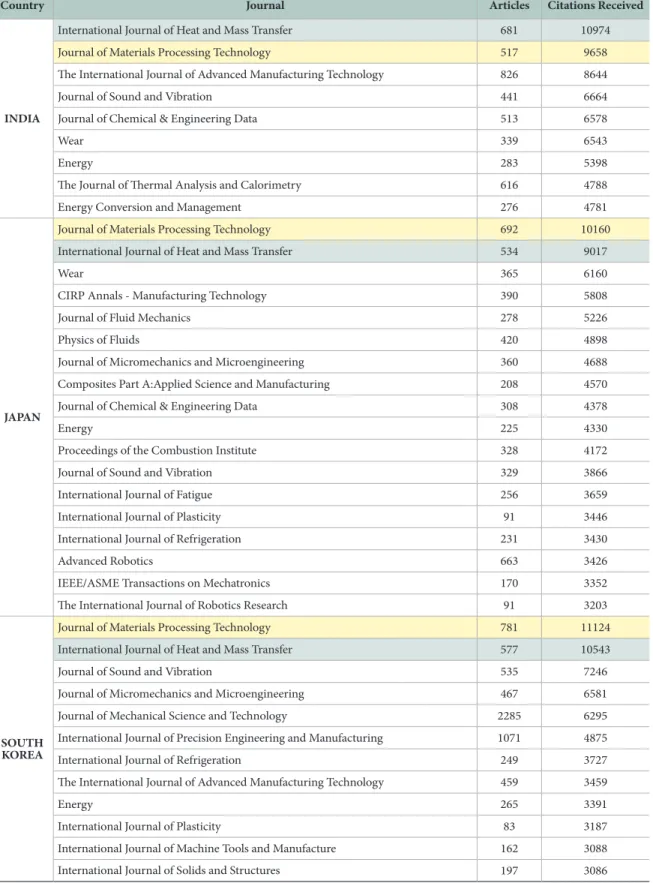
Table 5 provides the journal distribution during the study period, and each of the zones covers one third of the articles. The core journals in zone 1 for each coun-try are listed in Table 5a. The analysis of journals shall help scholars in getting an overview of prominent jour-nals. The Journal of Materials Processing Technology and International Journal of Heat and Mass Transfer top the list from all countries. They are the prominent journals in the mechanical engineering research community.
Table 3. Collaboration Indices Published
Year India JapanCI South Korea India JapanDC South Korea India JapanCC South Korea
2000 2.67 3.32 2.71 0.89 0.86 0.90 0.54 0.58 0.55 2001 2.72 3.32 2.95 0.90 0.85 0.93 0.55 0.58 0.59 2002 2.65 3.41 3.00 0.89 0.88 0.93 0.54 0.60 0.60 2003 2.75 3.27 3.03 0.88 0.87 0.92 0.55 0.59 0.60 2004 2.87 3.43 3.12 0.91 0.88 0.93 0.57 0.60 0.61 2005 2.76 3.45 3.22 0.91 0.90 0.94 0.56 0.62 0.62 2006 2.78 3.57 3.42 0.92 0.88 0.95 0.57 0.61 0.64 2007 2.79 3.41 3.37 0.92 0.88 0.94 0.57 0.61 0.63 2008 2.86 3.55 3.36 0.93 0.89 0.94 0.59 0.62 0.63 2009 2.87 3.54 3.38 0.93 0.90 0.93 0.59 0.62 0.63 2010 2.95 3.61 3.44 0.94 0.90 0.94 0.59 0.63 0.64 2011 2.92 3.61 3.47 0.94 0.90 0.94 0.59 0.62 0.64 2012 2.96 3.57 3.51 0.94 0.88 0.95 0.60 0.62 0.65 2013 2.95 3.74 3.51 0.94 0.93 0.95 0.59 0.65 0.65 2014 2.93 3.82 3.52 0.95 0.93 0.94 0.60 0.66 0.64
Table 4. Activity Index Published
Year PublicationsWorld India PublicationsJapan South Korea India Activity IndexJapan South Korea
2000 5441 660 2115 1004 0.85 2.71 1.29 2001 5691 609 2153 1183 0.75 2.64 1.45 2002 6441 703 2294 1264 0.76 2.49 1.37 2003 6540 757 2222 1335 0.81 2.37 1.42 2004 7668 838 2336 1440 0.76 2.13 1.31 2005 7619 927 2281 1580 0.85 2.09 1.45 2006 8794 1125 2230 1773 0.89 1.77 1.41 2007 8522 1332 1972 1459 1.09 1.62 1.19 2008 9288 1619 1932 1571 1.22 1.45 1.18 2009 10370 1765 1839 1721 1.19 1.24 1.16 2010 11281 1855 2024 1753 1.15 1.25 1.08 2011 11338 1851 1753 1790 1.14 1.08 1.1 2012 13432 2020 1863 2113 1.05 0.97 1.1 2013 15536 2371 1827 2166 1.07 0.82 0.97 2014 17462 2404 1737 2342 0.96 0.69 0.94 Total 145423 20836 30578 24494
5. CONCLUSION
The idea behind studying publication output is to understand the growth of mechanical engineering publications amongst the three countries which have a common footing. The publications in the field of mechanical engineering from India, Japan, and South Korea have been analysed. Price connected the size of science and time in terms of scientific growth. India and South Korea prove his model of doubling time, in fact with India being in the forefront, which has greatly increased its scientific activities in mechanical engineering. The study suggests the need to increase the pace of Japanese research in mechanical engineer-ing as there is a decline in the number of publications. This may indicate that India can earn significant competitive advantages in the area of mechanical en-gineering. Japan’s contributions were superior in the beginning, i.e., 2000, and there was a downtrend as the years passed by, with South Korea showing a rise and decline with the time. India’s research was on the up-ward trend, with a small downtrend in the middle. Ja-pan scores high in terms of collaborativeness amongst authors. Articles published by researchers in Japan and South Korea preferred to work in large groups. In India, researchers are becoming more and more aware of the importance of collaboration. The study did indi-cate that collaboration is on an upward trend with the time.
The analysis of most preferred publications may help, especially for new generations of scholars, to
get an overview of important publications in the area of mechanical engineering. This study demonstrates the strength of a scientometric analysis to investi-gate a field of interest. As demonstrated, the results of the study are valuable for discussing and defining future research agendas in the area of mechanical engineering. As a continuation of this research work, the authors intend to do further analyses to identify the important stakeholders in the field of mechanical engineering. In a nutshell, the study shows that Japan’s achievements are higher than the other two countries, i.e., India and South Korea, as far as mechanical engi-neering is concerned.
REFERENCES
Ajiferuke, I., Burell, Q., & Tague, J. (1988). Collaborative coefficient: A single measure of the degree of collab-oration in research. Scientometrics, 14(5-6), 421-433. https://doi.org/10.1007/BF02017100
Balog, C. (1980). Multiple authorship and author collab-oration in agricultural research publications. Journal of Research Communication Studies, 2(3), 159-169. Banshal, S. K., Muhuri, P. K., Singh, V. K., & Basu, A.
(2017). Research performance of Indian Institutes of Technology. Current Science, 112(5), 923-932. Barrot, J. S. (2017). Research impact and productivity of
Southeast Asian countries in language and linguis-tics. Scientometrics, 110(1), 1-15. Retrieved from http://link.springer.com/10.1007/s11192-016-2163-3
Table 5. Zone-Wise Distribution of Articles and Journals from all Three Countries
Zone 1st 2nd 3rd
India Articles 64028 64929 67748
Journals 9 26 343
Japan Articles 87789 86633 87072
Journals 18 37 332
South Korea Articles 66602 67591 68714
Table 5a. Core Journals for each Country Grouped in Zone 1
Country Journal Articles Citations Received
INDIA
International Journal of Heat and Mass Transfer 681 10974
Journal of Materials Processing Technology 517 9658
The International Journal of Advanced Manufacturing Technology 826 8644
Journal of Sound and Vibration 441 6664
Journal of Chemical & Engineering Data 513 6578
Wear 339 6543
Energy 283 5398
The Journal of Thermal Analysis and Calorimetry 616 4788
Energy Conversion and Management 276 4781
JAPAN
Journal of Materials Processing Technology 692 10160
International Journal of Heat and Mass Transfer 534 9017
Wear 365 6160
CIRP Annals - Manufacturing Technology 390 5808
Journal of Fluid Mechanics 278 5226
Physics of Fluids 420 4898
Journal of Micromechanics and Microengineering 360 4688
Composites Part A:Applied Science and Manufacturing 208 4570
Journal of Chemical & Engineering Data 308 4378
Energy 225 4330
Proceedings of the Combustion Institute 328 4172
Journal of Sound and Vibration 329 3866
International Journal of Fatigue 256 3659
International Journal of Plasticity 91 3446
International Journal of Refrigeration 231 3430
Advanced Robotics 663 3426
IEEE/ASME Transactions on Mechatronics 170 3352
The International Journal of Robotics Research 91 3203
SOUTH KOREA
Journal of Materials Processing Technology 781 11124
International Journal of Heat and Mass Transfer 577 10543
Journal of Sound and Vibration 535 7246
Journal of Micromechanics and Microengineering 467 6581
Journal of Mechanical Science and Technology 2285 6295
International Journal of Precision Engineering and Manufacturing 1071 4875
International Journal of Refrigeration 249 3727
The International Journal of Advanced Manufacturing Technology 459 3459
Energy 265 3391
International Journal of Plasticity 83 3187
International Journal of Machine Tools and Manufacture 162 3088
Bhattacharya, S., Shilpa, & Bhati, M. (2012). China and India: The two new players in the nanotechnology race. Scientometrics, 93(1), 59-87. Retrieved from http://link.springer.com/10.1007/s11192-012-0651-7
Borrego, M. (2007). Development of engineering educa-tion as a rigorous discipline: A study of the publica-tion patterns of four coalipublica-tions. Journal of Engineer-ing Education, 96(1), 5-18.
Borrego, M., Froyd, J. E., & Hall, S. T. (2010). Diffusion of engineering education innovations: A survey of awareness and adoption rates in U.S. engineering de-partments. Journal of Engineering Education, 99(3), 185-207.
Bradford, S. C. (1934). Sources of information on specific subjects. Engineering, 137(3550), 85-86.
Chetri, I. S., Saini, A. K., & Luthra, R. (2009). CSIR-UGC National Eligibility Test: A performance indicator of basic science education in Indian universities. Cur-rent Science, 97(4), 490-499.
Coursaris, C. K., & Van Osch, W. (2014). A scientometric analysis of social media research (2004-2011). Sci-entometrics, 101(1), 357-380. Retrieved from http:// link.springer.com/10.1007/s11192-014-1399-z Elango, B., & Rajendran, P. (2015). Global tribology
research output (1998 - 2012): A macro level scien-tometric study. Journal of Information Science Theory and Practice, 3(4), 35-48. https://doi.org/10.1633/ JISTaP.2015.3.4.3
Frame, J. D. (1977). Mainstream research in Latin Amer-ica and the Caribbean. Interciencia, 2(3), 143-148. Garg, K. C., & Padhi, P. (1999). Scientometrics of laser
research literature as viewed through the Journal of Current Laser Abstracts. Scientometrics, 45(2), 251-268. Retrieved from http://link.springer. com/10.1007/BF02458436
Garg, K. C., & Padhi, P. (2001). A study of collaboration in laser science and technology. Scientometrics, 51(2), 415-427. https://doi.org/10.1023/A:1012709919544 Gupta, B. M., & Gupta, P. (2004). Analysis of India’s S&T
research capabilities and international collaborative strength, particularly in context of Indo-German col-laboration. New Delhi: DFG India.
Gupta, B. M., Kshitij, A., & Verma, C. (2011). Mapping of Indian computer science research output, 1999-2008. Scientometrics, 86(2), 261-283. Retrieved from
http://link.springer.com/10.1007/s11192-010-0272-y
Hadagali, G. S., & Anandhalli, G. (2015). Modeling the growth of neurology literature. Journal of Informa-tion Science Theory and Practice, 3(3), 45-63. Re-trieved from http://koreascience.or.kr/journal/view. jsp?kj=E1JSCH&py=2015&vnc=v3n3&sp=45 Heilig, L., & Vob, S. (2014). A scientometric analysis of
cloud computing literature. IEEE Transactions on Cloud Computing, 2(3), 266-278.
Jesiek, B. K., Borrego, M., Beddoes, K., Hurtado, M., Rajendran, P., & Sangam, D. (2011). Mapping global trends in engineering education research, 2005-2008. International Journal of Engineering Education, 27(1), 77-90.
Karamourzov, R. (2012). The development trends of science in the CIS countries on the basis of some scientometric indicators. Scientometrics, 91(1), 1-14. Retrieved from http://link.springer.com/10.1007/ s11192-011-0592-6
Karki, M. M. S., & Garg, K. C. (1997). Alkaloid chemistry research in India. Journal of Chemical Information and Computer Science, 37(2), 157-161.
Kaur, H., & Gupta, B. (2009). Indian contribution in immunology and microbiology 1999-2008: A sci-entometric analysis. DESIDOC Journal of Library & Information, 29(5), 36-43.
Kim, M. J. (2002). Citation patterns of Korean physicists and mechanical engineers: Differences by type of publication source and type of authorship. Scien-tometrics, 55(3), 421-436. https://doi.org/10.1023/ A:1020418930669
Kumari, L. (2006). Trends in synthetic organic chemis-try research. Cross-counchemis-try comparison of Activity Index. Scientometrics, 67(3), 467-476. https://doi. org/10.1556/Scient.67.2006.3.8
Lawani, S. M. (1980). Quality, collaboration, and citations in cancer research: A bibliometric study (PhD thesis). Florida State University.
Liu, F., Lin, A., Wang, H., Peng, Y., & Hong, S. (2016). Global research trends of geographical information system from 1961 to 2010: A bibliometric analysis. Scientometrics, 106(2), 751-768. Retrieved from http://link.springer.com/10.1007/s11192-015-1789-x
Lyu, Q.-J., Pu, Q.-H., & Zhang, J. (2017). Bibliometric analysis of scientific publications in endocrinology and metabolism from China, Japan, and South
Ko-rea. Scientometrics, 110(1), 105-112. Retrieved from http://link.springer.com/10.1007/s11192-016-2179-8
Melin, G., & Persson, O. (1996). Studying research col-laboration using co-authorships. Scientometrics, 36(3), 363-377. https://doi.org/10.1007/BF02129600 Nagpaul, P. S. (1995). Contribution of Indian universities
to the mainstream scientific literature: A bibliomet-ric assessment. Scientometbibliomet-rics, 32(1), 11-36. https:// doi.org/10.1007/BF02020186
National Science Foundation. (2014). Research and de-velopment: National trends and international com-parisons. Science and Engineering Indicators 2014, 1-600.
Nobre, G. C., & Tavares, E. (2017). Scientific literature analysis on big data and internet of things applica-tions on circular economy: A bibliometric study. Sci-entometrics, 111(1), 463-492. Retrieved from http:// link.springer.com/10.1007/s11192-017-2281-6 Panat, R. (2014). On the data and analysis of the research
output of India and China: India has significantly fallen behind China. Scientometrics, 100(2), 471-481. Retrieved from http://link.springer.com/10.1007/ s11192-014-1236-4
Price, D. J. (1963). Little science, big science. New York: Columbia University Press.
Ravichandra Rao, I. K., & Suma, M. P. (1999). A quanti-tative study of Indian engineering literature. Sciento-metrics, 46(3), 605-619.
Sagar, A., & Kademani, B. S. (2011). Growth and impact of S & T in Madhya Pradesh during 2000-2009. DE-SIDOC Journal of Library and Information Technolo-gy, 31(1), 3-18.
Sangam, S. L., Keshava, & Agadi, A. B. (2010). Growth pattern of marine engineering literature. Information Studies, 16(2), 113-120.
Schoepflin, U., & Glanzel, W. (2001). Two decades of “Scientometrics.” An interdisciplinary field repre-sented by its leading journal. Scientometrics, 50(2), 301-312. https://doi.org/10.1023/A:1010577824449 Schubert, A., & Braun, T. (1986). Relative indicators and
relational charts for comparative assessment of pub-lication output and citation impact. Scientometrics, 9(5-6), 281-291.
Singh, V. K., Banshal, S. K., Singhal, K., & Uddin, A. (2015). Scientometric mapping of research on “Big Data.” Scientometrics, 105(2), 727-741.
Singhal, K., Banshal, S. K., Uddin, A., & Singh, V. K. (2015). A Scientometric analysis of computer sci-ence research in India. In 2015 Eighth International Conference on Contemporary Computing (IC3) (pp. 177-182).
Subramanyam, K. (1983). Bibliometric studies of re-search collaboration: A review. Journal of Informa-tion Science, 6(1), 33-38.
UNESCO. (2010). Engineering: Issues, challenges and op-portunities for development. UNESCO.
Wankat, P. C. (2012). Cross-fertilization of engineering education research and development. Journal of Pro-fessional Issues in Engineering Education and Practice, 138(2), 104-106.
Zou, Y., & Laubichler, M. D. (2017). Measuring the con-tributions of Chinese scholars to the research field of systems biology from 2005 to 2013. Scientometrics, 110(3), 1615-1631.