~~~2-f~At:i]fQfQJT'\I : 1\ll32:r! 1\1132, 292-299, 2000.
Surface EMG Spectral Parameters as a Fatigue Indicator After Electrically Induced Contraction of Vastus Medialis
Jin, Bok Hee., Lee, Jae Hyoung*., Onishi Hideaki**
DeJXDtment
of
Clinical Pathology, Physical Therapy*, Wonkuxmg Health Science College, Iksan, KoreaDeJXlrtment
of
Restorative Neurorru.JScular Surgery and Relrlbilitation Tohoku University Graduate Schoolof
Medicine, Sendai, japan**The estimation of electrically induced muscle contraction forces is important for the reduce of muscle fatigue during neuromuscular electrical stimulation. The electromyographic signal has potential as an indicator of muscle fatigue. The purpose of this study was to assess muscle fatigue using electromyographic spectral analysis with median power frequency and mean frequency during muscle contraction. Twelve healthy male subjects were divided into the neuromuscular electrical stimulation and control group. Fatigue was induced by having neuromuscular electrical stimulation subjects perform 50 second isometric contractions followed by 10 second rests for 10 minutes using Russian current electrical stimulation with 80 Hz. All subjects lies comfortably on a table to perform sustained contraction in the vastus medialis muscle for 30 seconds with maximal voluntary isometric contraction. The electromyogram was recorded using MP 100 System from vastus medialis muscle in both neuromuscular electrical stimulation and control group. The time serial data of the electromyographic signals were transformed into frequency serial data by Fast Fourier Transformation. The frequency changes ratio of median frequency was significantly lower in neuromuscular electrical stimulation group compared with control group (p<0.001) and the frequency changes ratio of mean frequency was significantly lesser in neuromuscular electrical stimulation group compared with control group (p<0.05). These results showed that the median frequency and mean frequency were declined by muscle fatigue. These results suggest that in neuromuscular electrical stimulation there is a trend for more fatigue to occur than in control group. This would seem to suggest that the analysis of median frequency and mean frequency of surface electromyographic spectra can use for indicator of muscle fatigue. Also, in treatment programs for muscle strengthen using neuromuscular electrical stimulation, some parameters such as on-off ratio, frequency should be considered.
Key Words: EMG, Fatigue, NMES
01
~~~ 1999~5:. .lll~~~~-TBl :Al~~l ~-6"}01 ~Ts:l~g.I. Introduction
Neuromuscular electrical stimulation(NMES) elicits muscle contraction by initiating action potentials in motor units. In recent years, NMES has been well established as an effective adjunct to increase in range of motion, augment of muscle strength, facilitation of neuromuscular movement and spasticity management in clinical practice (Snyder-Mackler et al, 1994: Draper and Ballard, 1991). The rate of fatigue during the NMES application of skeletal muscle is much greater than that seen during volitional contractions. Muscle fatigue can be defmed as a decrease in the force-generating ability of a muscle that resulted from recent activity(Binder-Macleod and Snyder- Mackler, 1993). Muscle fatigue is a major clinical concern during application of electrical stimulation of skeletal muscle and must be considered when selecting stimulation parameters.
The electromyogram(EMG) signal is manifesta- tion of the electrical activity produced by actively contracting motor units. EGM is widely used in clinical diagnosis and kinesiological study to the neuromuscular disorders. Also, it has been suggested that surlace electromyogram(sEMG) spectral analysis be used as an objective measure the muscle fatigue. The change in median frequency(MdF) and mean frequency(MF) of the sEMG power spectra to lower frequencies during an isometric
muscle fatigue. The most frequent parameters of the sEMG power spectrum for fatigue indices are MdF and MF. The change in MdF and MF to lower frequencies during an isometric muscle contraction is a common method to study muscle fatigue(Gerdle and Fugl-Meyer, 1992: Oberg, 1995).
It is attracting to use of sEMG as an detector of muscle fatigue because it can be obtained non- invasively and it reflects the electrical activity of the underlying muscle. Our interest has thus been in analysing the sEMG power spectra after electrical stimulation of muscle, and under- standing its utility as a predictor of muscle fatigue.
Despite the number of publications on electrically elicited muscle responses reported by many authors, there were few efforts to sEMG study the muscle fatigue caused by NMES in augment of muscle strength. Since clinicians work to restore the strength and endurance in muscles during the electrical stimulation program, reliable fatigue indicators are required for objective measurement and training effect assessment.
The purpose of this study was compare to the MdF and MF of vastus medialis before and after the electrically induced muscle fatigue for assess whether the sEMG spectral analysis can use an indicator of muscle fatigue.
IT.
Methods
muscle contraction is a common method to study 1. Subjects muscle fatigue(Gerdle and Fugl-Meyer, 1992:
Oberg, 1995: Chesler and Durfee, 1997). Twelve healthy male volunteers participated in Since Kogi and Hakamada(1960) described a this study. The subjects were between the ages of spectral shift towards lower frequencies in sustained 20 and 25 years(Table 1). The subjects were isometric contraction, the spectral parameters divided into control and electrical stimulated derived from the sEMG in the frequency domain groups(6 subject each). There was no statistically have been used as an objective measure the significant difference with in regard age, height
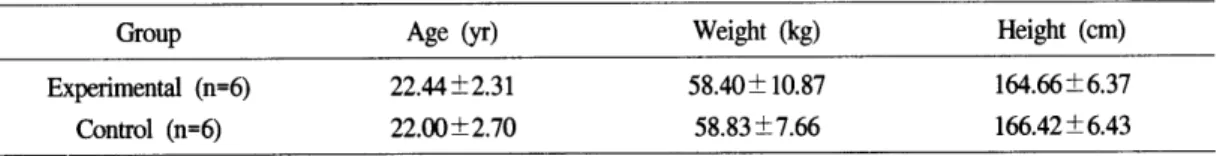
Table 1. Demographic data of subjects
Group Experimental (n=6)
Control (n=6)
Age (yr) 22.44±2.31 22.00±2.70
and weight between the two groups. These subjects were good physical condition, with no history of neuromusculoskeletal problems. All subjects read and signed the informed consent.
2. Electrical Stimulation
The fatigue trial consisted of an neuromuscular electrical stimulation using a Russian current (Endomed 982, Enraf-Nonius, P.O Box 810, 2600 A V Delft, Netherland). The subjects were asked to lie on a table. A monopolar stimulation technique was chosen. Sponge electrodes dampened with saline were used. A negative rectangular electrode ( 4 x 3 em) was placed on the motor point of the vastus medialis of dominant leg. The electrode was held in place by elastic straps with Velcro attachments. These straps were tightened just enough to hold the electrodes in place and did not hinder blood flow. A larger positive electrode(9.5 x 8.5 em) was placed on the low back The stimulation frequency of 80 Hz was selected because it inducible fatigue and a tetanic contractions. The amplitude of the stimulus ranged from 30-35 rnA, depending on the subject. The on-off time was 50: 1 Os with 10 repetitions, thus inducing fatigue.
Weight (kg) 58.40± 10.87 58.83±7.66
Height (em) 164.66±6.37 166.42±6.43
for maximal voluntary isometric contraction (MVCs). Electrode sites were prepared by cleaning the skin isopropanol alcohol. Pairs of disposable self-adherent Ag-AgCl disc electrodes(EL 503, Biopac Systems, Inc., 42 Aero Camino, Santa Barbara, CA 39117, USA) with a diameter of 10 mm were applied to the skin, a center-to-center distance 20 mm over the muscle belly running parallel with the muscle fibers at the vastus medialis. The electrode placement and orientation were marked on the skin to facilitate reapplication of electrodes. Subjects were instructed no to bent his knee and maintain the straight of the knee and each subject performed three MVCs of the dominant vastus medialis for 30 seconds. The raw sEMG signals were amplified with gain 500 and at sampling ratio 1000/s, and bypass filtered at 5 and 500 Hz. The samples were digitized by a 12-bit A{D converter and stored on the disk of IBM 586 computer. The EMG was recorded using a Polygraph(MP 100 System, Biopac Systems, Inc., 42 Aero Camino, Santa Barbara, CA 39117, USA) from vastus medialis muscle in both NMES and control group.
4. EMG Spectral Analysis
The raw sEMG signal was visually examined 3. EMG Signal Record for signal quality and any signal contaminated with motion artifact. The time serial data of the Subjects lies comfortably on a table to perform sEMG signals were transformed into frequency sustained contraction in the vastus medialis muscle serial data by Fast Fourier Transformation(FFT). A
FFT was calculated every 10 seconds using Hamming window with no zero padding points.
This windowed FFT was then used to calculate the MdF and MF of sEMG power spectra. We selected the MdF and MF of initial 10 seconds on pretreated and posttreated trials. The sEMG power spectra were analyzed using MP 100 Acqknowledge software(MP 100 Workstation Ver 3.5, Biopac Systems, Inc., 42 Aero Camino, Santa Barbara, CA 39117, USA).
5. Statistical Analysis
Statistical analysis was perform using Student t -test for the purpose of determine statistically significant differences of pretreated MdF and MF between the two groups. The delta MdF and delta
MF were calculated by the MdF and MF of pretreated trial subtracting by the MdF and MF of posttreated trial. Student group t -te~t were used to determine statistically significant differences of delta MdF and delta MF between the two groups.
The statistical interpretation was based on a 0.05 significance test level. SPSS WIN(ver7.5) software was used for the analysis.
ill.
Results
The MdF and MF of pretreated and posttreated trials were Table 2. Student's t -test showed a no significantly difference MdF of pretreated trial between the two group. There was, also no statistically significant difference with MF of pretreated trial between the two group(Table 3).
Table 2. Mean and standard deviation of MdF and MF (Hz) of vastus medialis in the electrical stimulated and control subjects (Mean± SD)
Group n
Control ES
6 6
Pretreat 147.93 ±26.91 149.78±26.04
MdF
Posttreat 141.97 ± 25.38 124.82 ± 18.56
Pretreat 133.62 ± 22.09 140.66±25.61
MF
Posttreat 127.86±22.52 124.42 ±21.94
Table 3. Group t-test of MdF and MF of pretreated trial between the control and electrical stimulated vastus medialis.
MdF MF
df
10 10
MD
-1.8700 -7.0400
SE 15.2873 13.8054
-0.122 -0.510
p
0.905 0.621
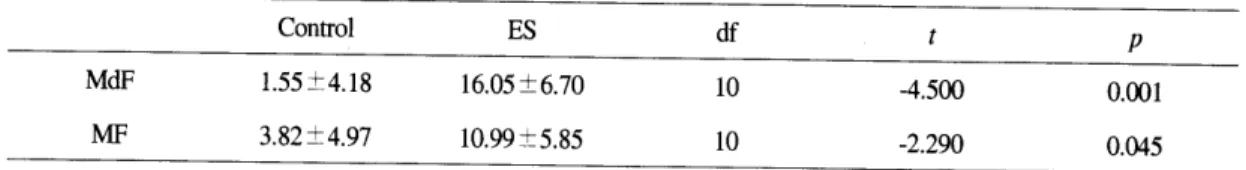
Table 4. Group t-test of mean diffemece of pretreated and posttreated trial of delta MdF and delta MF (Hz) in control and electrical stimulated vastus medialis
MdF MF
Control 1.55 ±4.18 3.82±4.97
ES 16.05±6.70 10.99±5.85
df 10 10
-4.500 -2.290
p 0.001 0.045
The results of group t-test of delta MdF and delta MF were Table 4. Student's t-test showed a significantly difference delta MdF between the two group(p<0.001). There was, also statistically significant difference delta MF between the two group(p<0.05).
N. Discussion
The results of our study showed that the MdF and MF of the sEMG power spectra were shift toward low frequencies after electrically elicited contractions of the vastus lateralis muscle in healthy subjects. We propose that the MdF and MF were shift ·toward low frequencies after electrically elicited contractions may be due to the muscle fatigue. This interpretation is supported by the previous reports. Zwarts et al(1987) reported that the shift in MdF and MF of the sEMG power spectrum during and after prolonged efforts.
Merletti et al(1995) reported that the MdF and MF have equivalent repeatability during electrically elicited contractions of the tibialis anterior muscle in healthy subjects. Oberg( 1995) reported that the spectral parameters was significantly decline at higher load level and its due to muscle fatigue during isometric contraction.
The decline in MdF and MF during muscle fatigue caused by the motor units recruitment, synchronization of motor units activity, and lowering of motor unit firing frequencies(Krogh- Lund and Jorgrnsen, 1991). The shift in MdF and MF of the sEMG power spectrum during and after muscle fatigue may be due to synchronization of the motor units, recruitment of different motor units and motor unit ftring rates(Lago and Jones, 1977). This shift is, also the result of changes in the motor unit action potential shape which is be
primary due to changes in conduction velocity(De Luca, 1993).
Henneman et al(1965) ~ a size principle that the recruitment order within a motomeuron pool progresses from the smallest to the largest motomeuron. The electrical stimulation of nerve or muscle can change the recruitment order and population of motor units that is activated by a stimulus(Trimble and Enoka, 1991: Enoka, 1995).
The electrical stimulation activates the nerve fiber at or near the motor end-plate, and recruits more large motor unit than small motor units as inverse Henneman's size principle(Delitto and Snyder Mackler, 1990).
The increase in the force and ftring rate is due to increase of the recruitment of motor units. The muscle fatigue depends on the force and stimulus frequency. The greater the elicited force, induce more rapidly the muscle fatigue. High frequency stimulation can induce more rapidly muscle fatigue (Garland et al, 1988). The frequency dependent change in the fatigue mechanism, such as a defect in action potential propagation and a defect in excitation-contraction coupling with high frequency stimulation. This is of particular importance because muscle fatigue far more rapidly when contract by electrical stimulation than with voluntarily contracted. The mechanisms for rapidly fatigue are not well understood, but they are believed to be caused by the inverse size-order recruitment of motor units resulting from activation with electrical stimulation, and the unnaturally high rate of motor unit activation and accompanying rapid transition to ischemic conditions that result from synchronous activation of motor units with electrical stimulation as contrasted with the slower, asynchronous activation that occurs when a motor unit is excited by the central
nervous system(Gonnan and Mortimer, 1983).
In our study, the decline in MdF has a slightly greater significance than MF after electrically elicited muscle fatigue. We could be propose that the MdF has more sensitive to the muscle fatigue.
Merletti et al(1995) reported that the MdF and MF are repeatable variables in fatigue indicies. They appear to have equivalent repeatability while MdF has a slightly greater significance to fatigue than MF. The conduction velocity probably caused the striking changes in fatigue EMG, notably motor unit recruitment, synchronization of motor unit activity, and lowering of motor unit firing frequencies. It is commonly accepted that changes in conduction velocity are chiefly responsible for the MdF shift. Solomonow et al(1990) reported the EMG signals of an electrically stimulated cat muscle with different firing rates and recruitment when represented by it median frequency.
The decline of MdF and MF in muscle fatigue may reflect a loss of efficiency in the production of mechanical force. The resufts of our study lend support the general consensus in that the MdF and MF declined in muscle fatigue. The median and mean frequency of the EMG power spectrum can use an indicator of muscle fatigue.
V. Conclusion
The objective of this study was to determine if sEMG spectral analysis could be used as an indicator of fatigue after electrically stimulated muscle. The results of this study revealed a statistically significant lower the MdF and MF in the electrical stimulated subjects compared to that in control subjects. These results suggest that the sEMG spectral analysis could be use as an indicator of muscle fatigue after electrically
stimulation. It is concluded that the MdF and MF are the recommended variables of sEMG parameters to be used for detecting myoelectric signals of muscle fatigue after electrical stimulation of nerves and muscles. Clinicians must be considered how stimulation parameters can be selected to minimize muscle fatigue in therapeutic uses of NMES.
REFERENCES
1. Binder-Macleod SA Snyder-Madder L. Muscle fatigue: clinical implications for fatigue assess- ment and neuromuscular electrical stimulation.
Phys Ther 73(12):902-910, 1993
2. Chesler NC, Durfee WK. Surface EMG as a fatigue indicator during PES-induced isometric muscle contraction. J Electromyogr Kinesiol 7(1):27-37, 1997
3. De Luca CJ. Use of the surface EMG signal for performance evaluation for back muscle.
Muscle Nerve 16(2):210-216, 1993
4. Delitto A, Snyder-Mackler L. Two theories of muscle strength augmentation using percutaneous electrical stimulation. Phys Ther 70(3): 158-164, 1990
5. Draper V, Ballard L. Electrical stimulation versus electromyographic biofeedback in the recovery of quadriceps femoris muscle function following anterior cruciate ligament surgery.
Phys Ther 71(6):455-461, 1991
6. Enoka RM. Mechanisms of muscle fatigue:
central factors and task dependency. J Electromyogr Kinesiol 5(3):141-149, 1995 7. Garland SJ, Gamer SH, McComas AJ.
Relationship between numbers and frequencies of stimuli in human muscle fatigue. J Appl Physiol 65(1):89-93, 1988
8. Gerdle B, Fugl-Meyer AR. Is the mean power
frequency shift of the EMG a selective indicator of fatigue of the fast twitch motor units? Acta Physiol Scand 145(2):129-138, 1992
9. Gorman PH, Mortimer IT. The effect of stimulus parameters on the recruitment charac- teristics of direct nerve stimulation. IEEE Trans Biomed Eng 30(7):407-414, 1983
10. Henneman E, Somjen G, Carpenter DO. Func- tional significance of cell-size .in spinal motor- neurons. J Neurophysiol 28:560-580, 1965 11. Kogi K, Hakamada T. Frequency analysis of
the smface electromyogram in muscle fatigue. J Sci Labour 38:519-528, 1962
12. Krogh-Lund C, Jorgensen K. Changes in con- duction velocity, median frequency, and root mean square-amplitude of the electromyogram during 25% maximal voluntary contraction of the triceps brachii muscle, to limit of endurance.
Eur J Appl Physiol Occup Physiol 63(1):60-69, 1991
13. Lago P, Jones NB. Effect of motor unit firing statistics on e.m.g. spectra. Med Bioi Eng Comp
15:648-655, 1977
14. :Merletti R, LoConte l.R, Sathyan D. Repeatability of electrically-evoked myoelectric signals in the human tibialis anterior muscle. J Electromyogr
Kinesiol 5(2):67-80, 1995
15. Oberg T. Muscle fatigue and calibration of EMG measurement. J Electromyogr Kinesiol 5( 4):239- 243, 1995
16. Snyder-Mackler L, Delitto A, Stralka SW, Bailey SL. Use of electrical stimulation to enhance recovery of quadriceps femoris muscle force production in patients following anterior cruciate ligament reconstruction. Phys Ther 74(10):901-907, 1994
17. SolOIIKJilow M, Baratta R, Shoji H, D'Ambra;ia R. The EMG-force relationships of skeletal muscle; dependence on contraction rate, and motor units control strategy. Electromyogr Clin Neurophysiol 30(3):141-152, 1990
18. Trimble MH, Enoka RM. Mechanisms underlying the training effects associated with neuromuscular electrical stimulation. Phys Ther 71(4):273-280, 1991
19. Zwarts MJ, Van Weerden TW, Haenen HT.
Relaticnship retween average muscle filre cooduction velocity and EMG power spectra during isometric contraction, recovery and applied ischemia. Eur J Appl Physiol Occup Physiol 56(2):212-216, 1987
전기자극으로 유발된 내측광근 근피로의
근전도 스펙트럼 분석원광보건대학 임상병리과 • 물리치료과* 일본 동북대학교 의과대학 대학원**
진복흐1. 이재형 오니시 히데아키**
본 연구는 근전도 스펙트럼의 중앙중파수와 평균주파수 분석이 전기자극으로 유발된 근피로를 평가할 수 있는지를 규명하기 위하여 시행하였다. 연구는 12 명의 건강한 남자 지원자를 대상으로 하였다. 전기자극군 대상자의 우측 내측 광근을 80 Hz의 러시아전류 를 사용하여 on:off time 50: 10s으로 10회 최대 근수축을 시켜 근피로를 유발시켰다. 근피 로유발 전, 후 내측 광근을 등척성 수축하여 표면근전도를 측정한 후 중앙주파수와 평균 주파수를 산출하여 비교하였다. 근피로유발 전 대조군과 전기자극군의 중앙주파수와 평 균주파수를 t-검정한 결과 유의한 차이가 없었으나 근피로유발 후 중앙주파수와 평균주 파수를 t-검정한 결과 전기자극군의 중앙주파수가 유의하게 감소하였으며 (p<O.OOI), 전 기자극군의 평균주파수도 유의하게 감소하였다 (p<0,05). 이러한 결과는 근피로유발 후 근전도 스펙트럼의 중앙주파수와 평균주파수가 저주파로 감소하였음을 보여주고 있고,
이와 같은 주파수 감소는 근피로가 유발되었음을 시사하고 있다. 본 연구 결과는 근전도 스펙트럼의 중앙주파수와 평균주파수 분석이 전기자극으로 유발된 근피로의 평가방법 으로 사용할 수 있음을 보여 주었다.