© 2015 The Korean Academy of Medical Sciences.
This is an Open Access article distributed under the terms of the Creative Commons Attribution Non-Commercial License (http://creativecommons.org/licenses/by-nc/4.0) which permits unrestricted non-commercial use, distribution, and reproduction in any medium, provided the original work is properly cited.
pISSN 1011-8934 eISSN 1598-6357 http://dx.doi.org/10.3346/jkms.2015.30.12.1924 • J Korean Med Sci 2015; 30: 1924
CORRESPONDENCE
Erratum: Correction of Table
To the Editor:
We found a mistake in our recently published article:
An YY, Kim SH, Kang BJ, Lee AW.
Treatment Response Evaluation of Breast Cancer after Neoadjuvant Chemotherapy and Usefulness of the Imaging Parameters of MRI and PET/CT
J Korean Med Sci. 2015 Jun;30(6):808-815
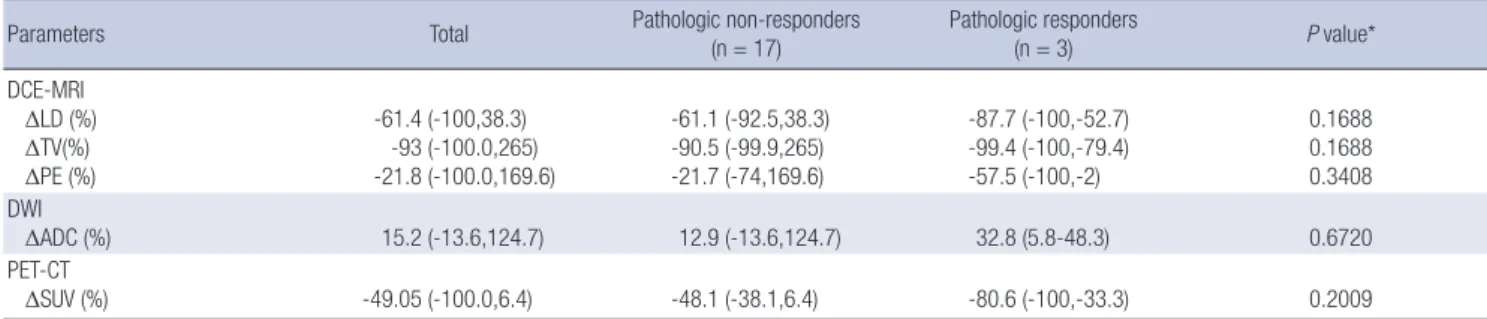
In the first row of Table 4, the number of pathologic responders and non-responders was reported incorrectly.
We have attached a corrected version of Table 4.
Thank you.
Sincerely yours, AW Lee
Table 4. Comparison between percent changes of the parameters in DCE-MRI using CAD analysis, DWI and PET/CT and pathological response status
Parameters Total Pathologic non-responders
(n = 17)
Pathologic responders
(n = 3) P value*
DCE-MRI ΔLD (%) ΔTV(%) ΔPE (%)
-61.4 (-100,38.3) -93 (-100.0,265) -21.8 (-100.0,169.6)
-61.1 (-92.5,38.3) -90.5 (-99.9,265) -21.7 (-74,169.6)
-87.7 (-100,-52.7) -99.4 (-100,-79.4) -57.5 (-100,-2)
0.1688 0.1688 0.3408
DWI ΔADC (%) 15.2 (-13.6,124.7) 12.9 (-13.6,124.7) 32.8 (5.8-48.3) 0.6720
PET-CT
ΔSUV (%) -49.05 (-100.0,6.4) -48.1 (-38.1,6.4) -80.6 (-100,-33.3) 0.2009
Data are presented as median (min, max). *P values of difference between non-response vs. response, by Wilcoxon Rank Sum test (two-tailed) with statistical significance set at α = 0.05.