서 론
골다공증은 골량의 감소로 인해 발생되는 골대사 질환 의 하나로써 이는 골흡수 증가나 골형성 부족과 같은 골 량의 불균형에 의해 발생하며 이로 인해 골의 변형 또는 골절 등의 합병증이 수반된다. 골량의 감소는 연령이 증가 함에 따른 생리적인 현상이지만 같은 연령층에서도 평균 이하로 골질이 현저히 감소된 경우에는 급속화된 골다공 증 (accelerated osteoporosis)이라 정의하며1이는 생리적인 골다공증과 구별되어야 한다.
WHO의 기준에 의하면 골밀도 (bone mineral density, BMD)가 정상인의 골밀도와 비교하여 T 값이 1.0 이상 차 이가 나면 골감소증 (osteopenia), 2.5 이상 차이가 나면 골
다공증으로 정의한다.2
골다공증을 진단하기 위하여 여러 가지 방법이 이용되 고 있으며 이러한 방법에는 단일광자흡수계측법 (single- photon absorptiometry; SPA), 이중광자흡수계측법 (dual- photon absorptiometry; DPA), 이중에너지방사선흡수계측 법 (dual-energy X-ray absorptiometry; DXA), 정량적 초음파 법 (quantitative ultrasound), 정량적 전산화단층촬영법 (quan- titative computed tomography; QCT) 등이 있다.3
일반적으로 요추와 대퇴골 부위의 골밀도를 측정하는 DXA법이 이용되고 있으나 악골 부위는 DXA법을 이용한 촬영이 어려워 거의 이용되고 있지 않다. 또한, QCT법을 이 용한 방법은 한정된 장비로 이의 이용 빈도가 매우 낮다.2
Kim 등4은 파노라마방사선사진을 이용하여 하악골의 골
의 변화를 평가함으로써 골격적인 골감소증과 골다공증을 인지할 수 있다고 보고한 바 있다. 파노라마방사선사진에 서 골다공증의 예측지표로 사용될 수 있는 것으로는 개별 하악 크기를 고려한 피질골 두께 (panoramic mandibular
접수일 (2010년 4월 23일), 수정일 (2010년 5월 24일), 채택일 (2010년 5월 28일) Correspondence to : Prof. Kwang-Joon Koh
Department of Oral and Maxillofacial Radiology, School of Dentistry, 634-18, Keumam-dong, Duckjin-gu, Jeonju, Jeonbuk 561-712, Korea
Tel) 82-63-250-2023, Fax) 82-63-250-2081, E-mail) [email protected]
파노라마방사선사진을 이용한 연령별 하악 피질골 두께에 관한 연구
전북대학교 치의학전문대학원 구강악안면방사선학교실 및 구강생체과학연구소
김윤숙∙김경아∙고광준
The relationship between age and the mandibular cortical bone thickness by using panoramic radiograph
Yun-Suk Kim, Kyoung-A Kim, Kwang-Joon Koh
Department of Oral and Maxillofacial Radiology, School of Dentistry, and Institute of Oral Bio Science, Chonbuk National University ABSTRACT
Purpose : This study was to determine the relationship between age and the mandibular cortical bone thickness on panoramic radiograph.
Materials and Methods : Panoramic radiographs of 360 patients (180 men and 180 women) over 20 years old, who visited the Chonbuk National University Hospital from January to December in 2007, were assessed. The subjects were divided into 5 age groups. Five indices such as cortical bone thickness at the gonion (GI), antegonion (AI), and below the mental foramen (MI), the panoramic mandibular index (PMI), the mandibular cortical index (MCI) were measured on panoramic radiographs.
Results : All five indices including GI, AI, MI, PMI, and MCI showed significant differences between third decade and over 8 decade groups (p⁄0.05). PMI, MI and GI showed significant differences with gender statistically (p⁄
0.05).
Conclusion : The mandibular cortical bone thickness showed negative correlation with age, and the value of the thick- ness (PMI, MI, and GI) was greater in men than in women. (Korean J Oral Maxillofac Radiol 2010; 40 : 83-87)
KEY WORDS : Mandible; Bone Density; Panoramic Radiography
index; PMI), 이공 하방의 하악 하연의 피질골 두께 (Mental index; MI), antegonial의 피질골 두께 (Antegonial index; AI), Gonion에서의 하악 하연의 피질골 두께 (Gonial index; GI), 이공 후방 및 하악 하연의 피질골지수 (Mandibular cortical index; MCI) 및 프랙탈 차원 등이 있다.5
Ledgerton 등6은 이공과 하악 하연과의 거리가 비교적
일정하다는 것에 착안하여 이 거리와 하악 하연의 피질골 두께와의 비를 PMI로 표현하여 연구하였다. 그러나 이 지 수가 골다공증의 지표로 유용한지의 여부에 대해서는 논 란이 되고 있다.5또한 AI, GI, MCI는 각각 Ledgerton 등,6 Bras 등,7Klemetti 등8이 제안한 지수로서, 하악 하연 피질 골의 평가에 많이 이용되고 있는 지수이다.
지금까지 파노라마방사선사진을 이용한 연구에서 MI, AI 및 GI의 유용성에 관하여는 많은 논란이 있으나 많은 연구에서 MCI가 유용한 지표라고 보고되고 있다.5
Horner 등,9Devlin 등10은 3 mm 이하의 얇은 하악 하연의 피질골을 가진 환자는 향후 골다공증의 위험이 높기 때문 에 추가적인 골다공증 검사가 필요하다고 보고한 바 있다.
국내에서 Kim 등4은 파노라마방사선사진을 이용한 연구 에서 PMI, MI, AI, GI, MCI가 정상군, 골감소군, 골다공증군 간에 통계학적으로 유의할 만한 차이를 나타내었다고 보 고하였다.
이 연구의 목적은 파노라마방사선사진을 이용하여 연령 증가에 따른 하악 하연의 피질골 두께를 평가함으로써 향 후 골다공증 환자의 조기진단에 도움이 되는 기초자료로 사용하고자 하였다.
대상 및 방법 1. 연구대상
전북대학교 치과병원에 2007년 1월부터 12월까지 내원 한 20세에서 70세 이상까지의 환자 중 무작위로 선택하여 총 360명의 파노라마방사선사진을 관찰하였다. 성별, 연령 층별 분포는 다음과 같다 (Table 1).
2. 연구방법
1) 파노라마방사선사진의 분석
촬영된 파노라마방사선사진을 M-View (Infinitt Healthcare Co., Ltd., Seoul, Korea) 프로그램을 사용하여 각 부위를 소 수점 둘째자리까지 측정하였다.
2) 측정항목
각 파노라마방사선사진에서 PMI, MI, AI, GI, MCI를 2주 간격으로 2회 측정하였다. 통계분석을 위하여 SPSS (ver- sion 12.0, SPSS Inc., Chicago, USA)통계프로그램을 이용하 였다.
(1) Panoramic mandibular index (PMI)
PMI는 이공 부위에서 하악 하연의 피질골의 두께를 하 악 하연에서 이공 하연 또는 상연까지의 거리로 나눈 값으 로 정의하였다.11
Ledgerton 등11의 방법에 따라 파노라마방사선사진에서 이공을 결정한 뒤 하악 하연의 접선 (a)에 수직으로 이공의 중앙을 통과하는 선 (b)을 긋고 이 선을 따라 피질골 두께 (C), 이공의 하연에서 하악 하연까지의 거리 (I), 이공의 상 연에서 하악 하연까지의 거리 (S)를 측정하였다 (Fig. 1).
(2) 피질골 두께
i) Mental index (MI)
MI는 이공 하방의 하악 하연의 피질골 두께로 Fig. 1의 C에 해당한다(Fig. 1 and 2).
ii) Antegonial index (AI)
Ledgerton 등6의 방법에 따라 상행지의 전연을 따라 가 Table 1.Numbers of subjects according to age and gender
Group Age (years) Men Women Subtotal
I 20-29 30 30 60
II 30-39 30 30 60
III 40-49 30 30 60
IV 50-59 30 30 60
V 60-69 30 30 60
VI 70- 30 30 60
Total 180 180 360
Fig. 1.Diagram showing the derivation of the measurements used in calculation of the panoramic mandibular index (PMI). A line (b) was drawn perpendicular to the tangent (a) to the lower border of the mandible and through the center of the mental foramen. Mea- surements were made along this line of cortical width (C) and the distances between the lower border of the mandible and the inferior (I) and superior (S) margins of the mental foramen.
b
C I S
PMI(I)=C/I PMI(S)=C/S a
장 적합한 직선(b)을 하악 하연과 만나게 그은 뒤, 하악 하 연의 접선(a)에 수직인 선(c)을 긋고 이 수직선(c)이 하악 피질골의 상연과 하연에서 만나는 점을 따라 antegonial cortical thickness를 측정하였다(Fig. 2).
iii) Gonial index (GI)
GI는 Bras 등7의 방법에 따라 하악 상행지 후연의 접선
과 하연의 접선이 만나 형성되는 각을 이등분하여 결정된 지수로서 gonion 부위에서 관찰되는 피질골의 두께를 측정 하였다(Fig. 2).
(3) Mandibular cortical index (MCI)
Klemetti 등8의 분류에 따라 이공 후방 하악 하연의 피질 골 형태에 근거하여 C1-C3의 세 군으로 분류하였다. 즉, C1은 피질골의 골내막 경계(endosteal margin)가 좌우측 모두에서 균일하며 예리한 경우를, C2는 피질골 골내막 경 계가 편측 또는 좌우측 모두에서 반월형 결손 (semilunar defects)을 보이거나 1-3층의 골내막 피질골 층 (endosteal cortical layer)을 형성하는 경우를, C3는 피질골 층이 심한 골내막 잔사 (endosteal residues)를 형성하거나 명확하게 다 공성을 보이는 경우로 하였다 (Fig. 3).
결 과
1. 연령과 하악 피질골 두께와의 상관관계
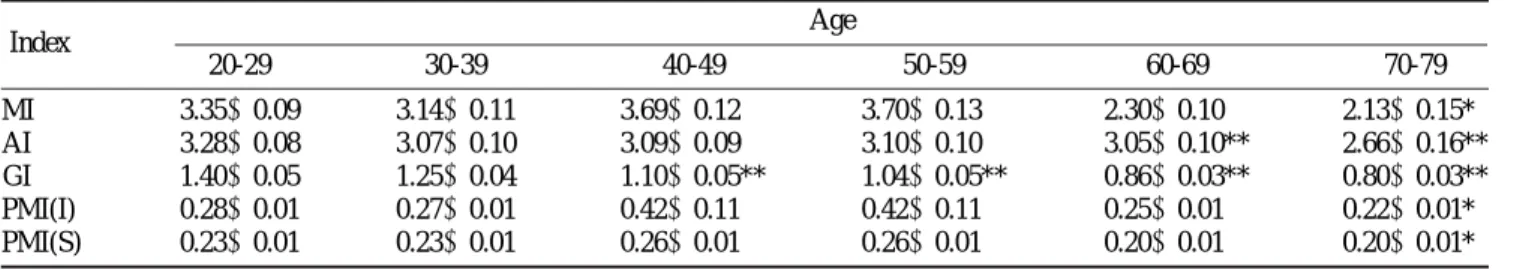
군별, 성별에 따른 측정 지표들의 평균과 표준편차는 Table 2와 3과 같다. MI는 VI군, AI는 V, VI군, GI는 III, IV, V, VI군, PMI(I)와 PMI(S)는 VI군에서 I군과 비교하여 하악 피질골의 두께가 감소하였다. 70대 연령군에서는 모 든 항목에서 20대 연령군과 차이를 나타내었다.
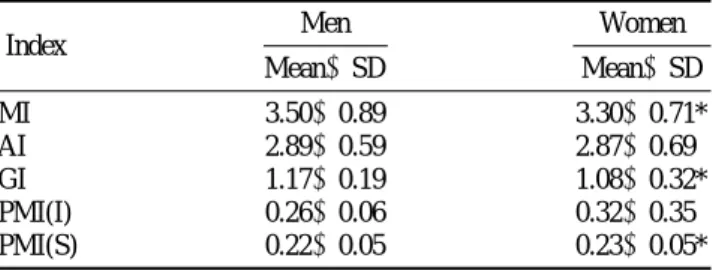
성별에 따른 측정지표들의 값은 PMI(S), MI, GI가 통계 학적으로 남녀 간에 유의한 차이를 보였다 (p⁄0.05).
연령과 하악 피질골의 두께 사이의 상관관계를 분석한 결과 음의 상관관계를 가지고 있는 것으로 나타났다. 연령 이 증가할수록 하악 피질골의 두께는 감소하는 경향을 보 였다. 특히 3가지 측정값 중에서 GI가 연령과 가장 상관관 계가 높은 것으로 나타났다 (Table 4).
Fig. 2.Diagram showing the measurements of mental index (MI), antegonial index (AI) and gonial index (GI). MI is the cortical thick- ness below the mental foramen and GI is at gonion. AI is the mea- surement of cortical thickness in the region at a point identified by extending a line (b) of ‘best fit’ on the anterior border of the ascend- ing ramus down to the lower border of the mandible. The line (a) is the tangent to the lower border of mandible and the line (c) is perpendicular to the line (a). The measurement of AI is made along this perpendicular line (c).
Fig. 3.Classification of mandibular cortex (C1-3) based on changes in inferior cortex on panoramic images. C1: The endosteal margin of the cortex is even and sharp on both sides. C2: The endosteal margin show semilunar defects (lacunar resorption) and/or seems to form endosteal cortical residues on one or both sides. C3: The cortical layer forms heavy endosteal cortical residues and is clearly porous.
Table 2.Mean values of the index according to age group (Mean±SD, mm)
Index Age
20-29 30-39 40-49 50-59 60-69 70-79
MI 3.35±0.09 3.14±0.11 3.69±0.12 3.70±0.13 2.30±0.10 2.13±0.15*
AI 3.28±0.08 3.07±0.10 3.09±0.09 3.10±0.10 3.05±0.10** 2.66±0.16**
GI 1.40±0.05 1.25±0.04 1.10±0.05** 1.04±0.05** 0.86±0.03** 0.80±0.03**
PMI(I) 0.28±0.01 0.27±0.01 0.42±0.11 0.42±0.11 0.25±0.01 0.22±0.01*
PMI(S) 0.23±0.01 0.23±0.01 0.26±0.01 0.26±0.01 0.20±0.01 0.20±0.01*
MI==mental index, AI==antegonial index, GI==gonial index, PMI==panoramic mandibular index, *p⁄0.05, **p⁄0.001 b
c AI a MI
GI
C1
C2
C3
2. MCI의 분석
MCI의 분포는 C2가 62.8%로 가장 높은 빈도를 나타냈 고 C1이 8.5%, C3가 28.7% 순으로 관찰 되었다. 하악 하연 피질골의 형태변화 정도 (MCI: C1-C3)는 남녀 간에 유의할 만한 차이를 보이지 않았다 (Fig. 4).
고 찰
White12는 골량은 일차적으로 유전적인 요인에 의해 결
정되며 이 중 가장 중요한 요인이 성별인 것으로 보고하 였다. 남성과 여성에 있어서 주된 골 성장은 30세까지 이 루어지며 남성의 최대 골량은 여성에 비해 많다. 여성의 경우, 폐경 이후 5-10년 동안의 골감소 시기가 있으며 이 때의 골 감소율은 폐경 이전 감소율의 2-4배가 된다. 한편 남성의 골량 감소는 여성보다 늦게 시작되어 서서히 진행
된다고 하였다.
선학들의 연구6,7,11,13-23
에서는 파노라마방사선사진을 이 용하여 형태학적 지표들을 측정, 비교하고 그 유효성에 대 해 논의하였다.
이 연구에서 연구대상의 선정은 일반적으로 성장이 완료 되는 20세 이상의 성인을 대상으로 하였으며 각 연령층별 및 성별에 따른 하악 하연의 피질골 두께의 비교가 가능하 도록 무작위로 선정하였다.
파노라마방사선사진에서 PMI 및 MI를 측정하는 과정에 서 이공의 위치를 판별하는 것이 어려운 경우가 있었으며, 특히 설골의 상과 하악 하연의 상이 중첩되어 하악 하연의 피질골 두께를 결정하기 어려운 경우에는 확실히 구분되는 가장 가까운 피질골의 외형을 따라 추적하여 결정하였다.
또한 하악 피질골의 경계가 불명확한 경우에는 하악 하연 피질골의 상연을 결정하기가 어려웠으며, 이러한 경우에는 Ledgerton 등11의 연구에서와 같이 치밀한 피질골의 가장 얇은 두께를 측정하였다. 또한, Klemetti 등18의 분류에 따라 MCI를 결정하는 과정에서 그 기준을 분명하게 적용하기 어려운 경우에는 C1과 C2의 결정이 어려운 경우 C1으로, C2와 C3의 결정이 어려운 경우 C3로 분류하였다.
Kim 등4의 연구에서는 PMI(I), PMI(S), MI, AI, GI 모두 정상군, 골감소증군, 골다공증군 간에 통계학적으로 유의할 만한 차이를 보인다고 하였다.
이 연구의 결과 파노라마방사선사진의 모든 측정 지표 에서 70세 이상의 연령군에서 20세군보다 하악 피질골의 두께가 감소하였으며, 측정 지표 중에서 PMI(S), MI, GI가 통계학적으로 남녀 간에 유의할 만한 차이를 보였다. 한편 PMI(I)와 AI는 남녀 간에 유의할 만한 차이를 보이지 않 았다. 이는 PMI(I)와 PMI(S)를 비교해볼 때 연령 증가에 따라 하악골의 흡수가 진행되므로 이공의 상방연보다는 하 방연을 판단하기 쉽기 때문인 것으로 사료된다. Ledgerton 등6은 가장 일관된 결과를 보이는 지표가 AI라고 보고하 였다. 이 연구에서도 MI, GI보다는 AI가 남녀 간에 차이가 없는 것으로 나타나 이는 Ledgerton의 보고에서와 유사한 결과를 보였다. 또한 Ledgerton 등6의 연구에서 MI, GI, AI 는 연령이 증가함에 따라 감소하고 60대 이상부터는 급격 히 감소하며, PMI 역시 연령이 증가함에 따라 감소한다고 하였다. 이 연구에서도 연령이 증가함에 따라 MI, AI, GI, PMI가 감소하는 경향을 보였고, 특히 60대 이상의 연령군 에서 측정값의 급격한 감소를 보였다.
MCI의 분포는 C2가 62.8%로 가장 높은 빈도를 나타내 었고 C1이 8.5%, C3가 28.7% 순으로 관찰되었다. 하악 하 연 피질골의 형태변화 정도는 남녀 간에 유의할 만한 차 이를 보이지 않았다. MCI의 분포는 그 비율에서는 미약한 차이가 있었지만 기존의 연구13에서와 유사하게 C2의 비 율이 가장 높았다. 또한, MCI의 변화정도는 남녀 간에 유 의할 만한 차이를 보이지 않았으므로 이는 일관된 측정방 Table 3.Mean values of index according to gender
Index Men Women
Mean±SD Mean±SD
MI 3.50±0.89 3.30±0.71*
AI 2.89±0.59 2.87±0.69
GI 1.17±0.19 1.08±0.32*
PMI(I) 0.26±0.06 0.32±0.35
PMI(S) 0.22±0.05 0.23±0.05*
MI==mental index, AI==antegonial index, GI==gonial index, PMI==panora- mic mandibular index, *p⁄0.05
Table 4.The correlation between age and the mandibular cortical bone thickness
Index Correlation value
Mental index -0.203**
Antegonial index -0.535**
Gonial index -0.688**
**Correlation is significant at the 0.01 level (2-tailed).
Fig. 4.The distribution of mandibular cortical bone index (χ2test, p¤0.05).
Frequency(%)
70 60 50 40 30 20 10 0
C1 C2 C3
MCI 8.5
62.8
28.7
법으로 사료된다.
연령과 하악 피질골의 두께 사이의 상관관계를 분석한 결과 음의 상관관계를 가지고 있는 것으로 나타났다. 기존 의 연구결과와 유사하게 연령이 증가할수록 하악 피질골 의 두께는 감소하는 경향이 관찰되었다. 여러 부위에서의 하악 피질골의 두께 중에서 GI 값이 가장 큰 상관관계를 보였다. 그러나 상대적으로 GI의 측정은 방법적으로 다른 계측치를 측정하는 방법보다 어려운 것으로 사료된다.
정상인이나 골다공증을 가진 여성을 대상으로 한 기존 연구와 비교하여 이번 연구에서는 성별이나 골다공증 유 무에 관계없이 통계학적 분석을 시행하였다. 기존 연구에 서 논의되었던 여러 가지 방사선학적 계측치들은 성별이 나 골다공증 유무와 관계없이 무작위로 선정한 이번 연구 에서도 유사한 결과를 보여주었다. 기존 연구들의 정상군 의 평균측정값을 이번 연구에서 얻은 값과 비교해 볼 때 그 값은 미약하게 작은 수치를 나타내었다. 이는 무작위로 선정된 군과 정상군을 비교함에 있어서 발생한 차이로 생 각된다. 또한, 외국인을 대상으로 측정한 값과 한국인을 대 상으로 측정한 값은 미약한 차이를 보였는데 이는 인종에 따른 차이로 사료되며 이번 연구에서 얻어진 값은 한국인 을 대상으로 한 기존 연구의 값과 유사하였다.4,14따라서 파노라마방사선사진을 이용하여 여러 계측치를 측정함으 로써 치과의사는 환자의 골상태를 어느 정도 파악할 수 있 으며, 이를 통해 임플란트 시술 계획을 세우거나 전신적인 골다공증 여부에 대한 추가적인 검사를 환자에게 권유할 수 있을 것으로 사료된다.
참 고 문 헌
1. Nordin BE. The definition and diagnosis of osteoporosis. Calcif Tis- sue Int 1987; 40 : 57-8.
2. Kim TS, Lee DK, Lee BD, Jung SK. Comparison of jaw bone density in young adults and postmenopausal women. J Korean Assoc Maxil- lofac Plast Reconstr Surg 2001; 23 : 107-14.
3. Cakur B, Sahin A, Dagistan S, Altun O, Caglayan F, Miloglu O, et al.
Dental panoramic radiography in the diagnosis of osteoporosis. J Int Med Res 2008; 36 : 792-9.
4. Kim JY, Nah KS, Jung YH. Comparison of panorama radiomorphome- tric indices of the mandible in normal and osteoporotic women. Korean J Oral Maxillofac Radiol 2004; 34 : 69-74.
5. Kim JY, Nah KS. Prediction of osteoporosis using fractal analysis et cetera on panoramic radiographs. Korean J Oral Maxillofac Radiol 2007; 37 : 79-82.
6. Ledgerton D, Horner K, Devlin H, Worthington H. Radiomorphometric indices of the mandible in a British female population. Dentomaxillo- fac Radiol 1999; 28 : 173-81.
7. Bras J, van Ooij CP, Abraham-Inpijn L, Kusen GJ, Wilmink JM. Ra- diographic interpretation of the mandibular angular cortex: a diagno- stic tool in metabolic bone loss. Part I. Normal state. Oral Surg Oral Med Oral Pathol 1982; 53 : 541-5.
8. Klemetti E, Kolmakov S, Kroger H. Pantomography in assessment of the osteoporosis risk group. Scand J Dent Res 1994; 102 : 68-72.
9. Horner K, Devlin H, Harvey L. Detecting patients with low skeletal bone mass. J Dent 2002; 30 : 171-5.
10. Devlin H, Karayianni K, Mitsea A, Jacobs R, Lindh C, van der Stelt P, et al. Diagnosing osteoporosis by using dental panoramic radiogra- phs: the OSTEODENT projects. Oral Surg Oral Med Oral Pathol Oral Radiol Endod 2007; 104 : 821-8.
11. Ledgerton D, Horner K, Devlin H, Worthington H. Panoramic mandi- bular index as a radiomorphometric tool: an assessment of precision.
Dentomaxillofac Radiol 1997; 26 : 95-100.
12. White SC. Oral radiographic predictors of osteoporosis. Dentomaxil- lofac Radiol 2002; 31 : 84-92.
13. Gulsahi A, Yuzugullu B, Imirzalioglu P, Genc Y. Assessment of pano- ramic radiomorphometric indices in Turkish patients of different age groups, gender and dental status. Dentomaxillofac Radiol 2008; 37 : 288-92.
14. Mahl CRW, Licks R, Fontanella VRC. Comparison of morphometric indices obtained from dental panoramic radiography for identifying individuals with osteoporosis/osteopenia. Radiol Bras 2008; 41 : 183- 7.
15. Cho HJ, Yi WJ, Heo MS, An CH, Lee JK, Lee SS, et al. The relation- ships between panoramic indices and dental implant failure. Korean J Oral Maxillofac Radiol 2004; 34 : 25-30.
16. Lee YG. The study about the diagnostic parameters of osteoporosis on panoramic radiograph. J Korean Assoc Maxillofac Plast Reconstr Surg 1998; 20 : 279-83.
17. Klemetti E, Kolmakov S, Heiskanen P, Vainio P, Lassila V. Panoramic mandibular index and bone mineral densities in postmenopausal women. Oral Surg Med Pathol 1993; 75 : 774-9.
18. Klemetti E, Kolmakow S. Morphology of the mandibular cortex on panoramic radiographs as an indicator of bone quality. Dentomaxillo- fac Radiol 1997; 26 : 22-5.
19. Taguchi A, Suei Y, Ohtsuka M, Otani K, Tanimoto K, Ohtaki M. Use- fulness of panoramic radiography in the diagnosis of postmenopausal osteoporosis in women: width and morphology of inferior cortex of the mandible. Dentomaxillofac Radiol 1996; 25 : 263-7.
20. Ha SY, Song NK, Koh KJ. A computerized tomographic study on the location of the mandibular canal and the cortical thickness of the mandible. J Korean Acad Oral Maxillofac Radiol 1997; 27 : 217-30.
21. Lee BD. An experimental study of radiographic density of alveolar bone and cortical thickness of mandible by osteoporosis. Korean J Oral Maxillofac Radiol 2000; 30 : 235-42.
22. Horner K, Devlin H. The relationships between two indices of mandi- bular bone quality and bone mineral density measured by dual energy X-ray absorptiometry. Dentomaxillofac Radiol 1998; 27 : 17-21.
23. Benson BW, Prihoda TJ, Glass BJ. Variations in adult cortical bone mass as measured by a panoramic mandibular index. Oral Surg Oral Med Oral Pathol 1991; 71 : 349-56.