I. Introduction
Fabric properties influence the appearance, aesthetics, and performance of garment. Drape property is one of the important properties offabrics and garment. Drape is the ability of a
†Corresponding author: Jongjun Kim, Tel: +82-2-3277-3102, Fax: +82-2-3277-3079 E-mail: [email protected]
fabric to hang in folds when suspended under its own weight as shown in the skirt folds (Sanad, Cassidy, Cheung, & Evans, 2013).
Drape characteristics of a fabric is closely related to the physical and mechanical properties including bending rigidity, weight, and
A Study on the Fabric Drape Evaluation
Using a 3D Scanning System Based on Depth Camera with Elevating Device
Jongjun Kim†
Dept. of Clothing and Textiles, Ewha Womans University
Abstract
Properties of textile fabrics influence the appearance, aesthetics, and performance of garment. Drape and related properties of fabrics affect profoundly the static and dynamic appearance during wearer’s movement. The three dimensional shape of the folded structure often deforms with time or with subtle vibration around the fabric specimen during the drape measurement. Due to the uneven and complex nature of fabrics, the overall shape of the fabric specimen on the drape tester often becomes unstable. There is a need to understand the fundamental mechanisms of how draping may generate pleasing forms. Two drape test methods, conventional Cusick drape test, and in-built drape tester, based on a depth camera, are compared. Fabric specimens including cotton, linen, silk, wool, polyester, and rayon are investigated for the fabric drape and other physical/mechanical parameters. Drape coefficient values of fabric specimens are compared based on the final drape images, together with the intermediate 3D drape images of the specimens during elevation process of the drape tester equipped with a stepper motor system. The correlation coefficient between the data based on the two methods is reasonably high.
Another advantage from the depth camera system is that it allows further analysis of three-dimensional information regarding the fabric drape shape, including the shape of nodes or crest and trough.
Keywords : fabric, drape, 3D scanning, depth camera, elevating device
shear rigidity of the fabric. Fiber type, yarn structure, fabric weave structure, and finishing methods also affect the fabric drape. Generally accepted test methods have enabled researchers determine the fabric drape with improved reproducibility to mostly acceptable degrees (Cusick, 1968). Drape coefficient is expressed as the ratio of the shadow of a draped fabric specimen on a small supporting disc to the specimen’s flat area.
However, the three dimensional shape of the folded structure often deforms with time or with subtle vibration around the fabric specimen during the drape measurement. Due to the uneven and complex nature of fabrics, the overall shape of the fabric specimen on the drape tester often becomes unstable.
Since the fabric drape coefficient is more or less unstable due to the structural, or physical factors of fabric specimens, such as bending and shear hysteresis, it is also important to consider the instabilities during the drape measurement procedure. Niwa and Morooka (1976) reported mechanical values contributing to the stability of the drape coefficient, and found that the larger the hysteresis per unit weight in bending deformation of fabric is, the larger the instability of the drape coefficient becomes for the fabric specimens used for men’s suit in the study. Sidabraite and Masteikaite (2003) studied bending rigidity in different directions of woven fabric and drape profile diagrams, and found that the anisotropy level depends on the bending rigidity ratio of light weight woven fabrics.
There is a need to understand the fundamental mechanisms of how draping may generate pleasing forms. Mizutani, Amano, and Sakaguchi (2005) devised a new apparatus for measuring the changes during the whole
process of drape formation, using a type of drape elevator. They proposed an ‘R value’, which is a measure of expressing the simplicity or evenness of the fabric drape projection. The drape shape can be differentiated for samples with the same drape coefficient readings based on the ‘R value’ calculation. They considered the generation of nodes and the developing process in relation to the mechanical properties of the fabric specimens. Mah and Song(2010) investigated fabric drape employing three -dimensional body scanning system. Laser scanners, in the system, project a horizontal line of light on the object, moving vertically along the length of the draped specimen. The scanned image can be rotated, resized and sliced.
In this study, a depth camera system, coupled with a 3D scanning software, is employed for three-dimensional scanning of fabric drape with drape elevator method proposed by Mizutani et al. (2005) or Al-Gaadi, Göktepe, and Halász (2012). The drape measurement data are compared with the conventional drape test (Kim, 2015).
. Theoretical Backgrounds
Ⅱ
Drape property of fabrics can be evaluated objectively. Drape coefficient and the number of folds or nodes and the depth of folds along with their distribution are measured by using a number of objective testing methods. When a specimen of a round fabric is drooping down from a cylindrical pedestal, the drape coefficient can be defined as Eqn. 1:
D. C. (Drape Coefficient, %)
×
(Eqn. 1)
where S0 is the area of the specimen table, S1 is the area of the fabric specimen, and S2 is the area of the vertical projection of the fabric specimen.
The drape coefficient may be calculated using area units measured by cut-and-weigh method, image processing method, or photosensitive cells (Collier, 1991). Jeong (1998) proposed an alternative drape coefficient method to give good correlation with the conventional cut-and-weigh method with high measurement repeatability.
This calculation method is regarded as a standard method to use the fabric drape coefficient of fabric to evaluate the fabric drape properties. The conventional studies for drape coefficient have often focused on its accurate calculation methods or on its relationship with the mechanical properties (Sanad, Cassidy, &
Cheung, 2012).
Lo, Hu, and Li (2002) proposed a model for predicting fabric drape profiles based on polar coordinate fitting. The fitting method was used to calculate the constants in their profile model, derived from measurement parameters by Cusick drape tester. They also found that fabric bending and shear hysteresis have high correlation with the determined constants of p, q, and k through stepwise regression analysis.
Based on the image of fabric shadow of the Cusick drape tester, an automatic evaluation software system was developed (Park, Kim, &
Ryu, 2004). Fast Fourier Transformation (FFT) was adopted to determine the variance of the fabric shadow image and a fitness factor derived from the dominant component of FFT result. The fitness factor from the system is the ratio of the area below the two curves of the graph of the amplitude and the FFT dominant component. Al-Gaadi et al. (2012) suggested a
drape measurement and analysis method during the drape formation process. They presented the Sylvie 3-D drape tester enabling dynamic impact on fabric specimen during the draping process.
The tester includes a 3D laser scanning equipment employing four line laser emitters with four cameras to record the laser lines on the draped fabric specimen. ‘Drape unevenness’ was also introduced, along with the drape coefficient, to delve into the structure and property differences among cotton fabric specimens, prepared with open-end rotor warp and filling yarns differing only in the twist direction.
Current development in 3D scanning and reconstruction systems has introduced a slew of scanning hardwares, including Microsoft Kinect sensors (versions 1 and 2), laser or white light scanning devices, and contact probe devices.
Since most of the textile materials for apparels are flexible and soft, the 3D scanning method may opt for non-contact methods. The resolution of scanning, processing speed, or the distance between the sensor and object prime factors for selecting the proper devices. Image capturing speed of the current Kinect sensors, or equivalent ones, ranges from 20 to 60 frames per second, which allows recording of dynamic movement of fabric specimens in a close range of 0.5 to a few meters. However, the processing of the supporting softwares may impose burden on the capturing speed during the acquisition, aligning, or subsequent processes. The complicated shape of the fabric drape, or garment drape, may also further reduce the capturing and processing speed by the 3D scanning equipment.
The 3D scanning techniques have been developed to collect three-dimensional point cloud data from the object of interest. From the point cloud data, mesh surface may be
constructed through the reconstruction software algorithms. There are a host of 3D reconstruction softwares, including Reconstruct Me (PROFACTOR GmbH, Austria), KScan3D, and Skanect, that enable real time 3D reconstruction process coupled with the 3D scanning sensors, such as Kinect, or Carmine products. Obtained 3D objects, written in the file formats of PYL, STL, or OBJ, may further be analyzed to extract information on polylines on the surface of fabric drape nodes, crests, or trough, by using Rhino3D (McNeel Assoc., U.S.A.) or MeshLab.
Reconstructed 3D scanned objects may further be analyzed to obtain specific contour lines along the crest and trough of the drape ‘nodes’
in fabric specimen. ‘PolylineOnMesh’ function of the Rhino3D software allows drawing of
‘polylines’ on the mesh surface of the reconstructed objects. ‘PolylinePoints’ function of the Rhino3D allows extracting ‘x, y, and z’
cartesian values of the points along the
‘polylines’ drawn on the mesh surface of the 3D object. The ‘z’ value represent the height of points along the ‘polylines’ on the fabric drape 3D object. By analyzing the ‘x, y, and z’ values, the contours of the crest or trough of fabric nodes may be plotted on a two-dimensional chart for simplified comparison of the characteristics of fabric drape shapes of fabric specimens of different weave, fiber composition, or yarn structure.
. Experiments
Ⅲ
Fabric specimens including cotton, linen, silk, wool, polyester, and rayon are investigated for the fabric drape and other physical/mechanical parameters (Table 1). The diameter of fabric specimen is 25.4cm. The diameter of fabric
specimen plate for the drape tester is 12.7cm.
Two drape test methods, conventional Cusick drape test, and in-built drape tester based on a commercial depth camera system (Carmine 1.08, PrimeSense Co., Ltd.) with an elevator mechanism are compared.
Fabric drape image is captured for conventional Cusick drape test using a digital camera on top of the tester. The image is then processed to calculate the area of the draped fabric specimen on the tester.
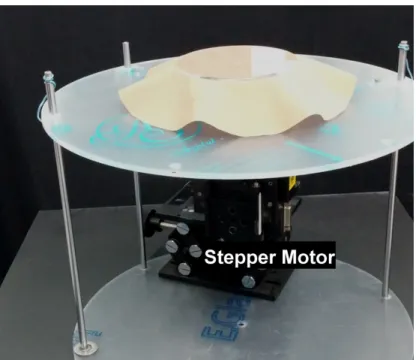
Figure 1 shows the drape tester with an elevator mechanism controlled by an electronic driver unit coupled with stepper motor unit. The mechanical driver unit comprises a unipolar stepper motor and two precision linear rails with the center ball screw, in order to move the fabric specimen at a constant speed without disturbances that might incur unwanted fabric deformation during the drape test. The total vertical distance of movement of the elevator mechanism is 6.35cm. The total distance is divided by 5 steps in order to allow for the 3D scanning of the shape of the draped fabric at each step. Each step distance is 1.27cm.
The drape specimen is laid flat on top of the specimen plate and supporting plate maintaining the same height. As the ‘start’ tab on the monitor of the PC is pressed, the stepper motor of the elevator mechanism starts to move upward until vertical displacement reaches 1.27cm. At this step, a rotating system starts to move the depth camera around the drape tester completing a full circle. Each step requires around two minutes to complete the 3D scanning and reconstruction. After saving the 3D scanned object as file format of OBJ in the PC, the next step continues until the final step. The number of steps may further be increased to 10 or 15, instead of the current 5 steps. For a five
step procedure, it takes a total of 10 minutes or so. It would give a better description of the drape formation process, if the scanning process is divided by more steps, e.g., 10 or 15. Further in-depth study would fill the gap between the steps to depict clearer pictures of the drape formation process in the near future.
Table 1. Specifications of Fabric Specimens Fabric specimen
code
Fiber composition, %
Thread count, threads/in
Weight, g/m2
Thickness, mm
C Cotton, 100 102x86 70.5 0.185
L Linen, 100 70x58 136.0 0.259
S Silk, 100 126x106 50.2 0.103
W Wool, 100 60x48 143.0 0.295
P Polyester, 100 102x84 61.6 0.081
R Rayon, 100 134x84 56.5 0.076
Figure 1. Drape Tester coupled with an Elevator Device comprising a Linear Rail Drive with a Stepper Motor Unit
Drape coefficient values of fabric specimens are compared based on the final drape images, together with the intermediate 3D drape images of the specimens during the elevation process of the drape tester equipped with a stepper motor system.
A 3D reconstruction software, ReconstructMe (PROFACTOR GmbH, Austria) is employed for the reconstruction of the 3D data acquired by using the depth camera. The analysis of
‘Polyline’ on the 3D mesh object of the fabric drape shape is implemented utilizing the
‘PolylineOnMesh’ and ‘PolylinePoints’ functions of Rhino3D software. After obtaining ‘x, y, and z’ values of the corresponding ‘polylines’ of along the crest and trough of fabric drape node, the values are exported to MS Excel spreadsheet in order to plot the height values(‘z’) against the distance from the center of drape shape.
The distance from the center of fabric drape object is calculated as follow:
Distance , (Eqn. 2) (unit of distance = mm).
Scatter plot by using the MS Excel shows the cross-sectional shape of the crest and trough of the fabric drape node.
Drape coefficient is calculated according to Eqn. 1.
. Results and Discussion
Ⅳ
One of the advantages from the 3D scanning system based on depth camera system is that it allows not only the drape coefficient calculation but also further analysis of three-dimensional information regarding the fabric drape shape, including the shape of nodes and slope, based on the 3D mesh object of the total shape of fabric drape.
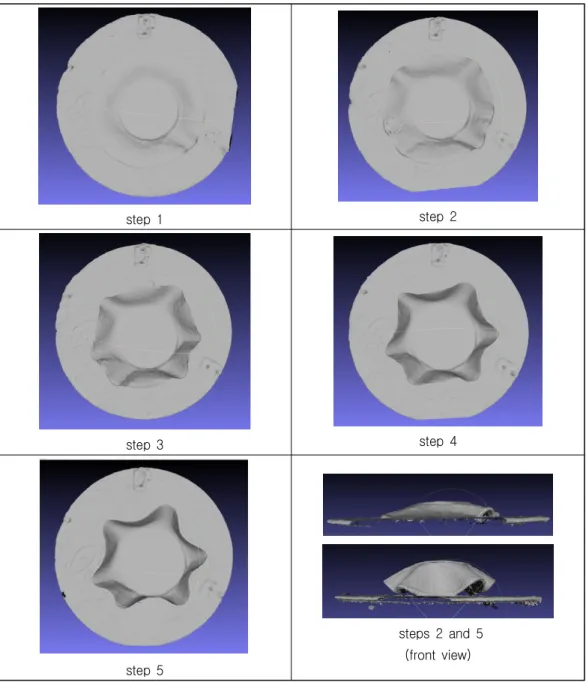
Figure 2 shows the 3D reconstruction images of silk fabric specimen by using the depth camera at each elevation step, from one through five.
In the case of silk fabric specimen, the number of nodes is six at the final step. Even at the earlier elevation step of 2, it seems evident that the number of nodes is also six, while it is not highly distinctive at the first step image, showing one node or two at the most. As the elevation step increases, the shape of fabric drape reaches to a completed one. Based on the observation of the stepwise development in 3D fabric drape, it is postulated that even if the drape formation process is vulnerable to the external disturbances, once the earlier stage nodes emerge, those tendency will consistently develop to the final ones. This may be attributable to the various factors related to the fabric structure, e.g., weave, thread counts of warp and filling, crossing status between warp and filling, friction between yarns; yarn structure and physical properties, such as yarn count, number of twist, twist direction; and fiber itself.
Considering the report by Al-Gaadi et al.
(2012) on ‘Drape Unevenness’ parameter to comapre with the drape coefficient in order to examine the structure and property differences among cotton fabric specimens, prepared with open-end rotor warp and filling yarns differing only in the twist directions, Z/Z, Z/S, and Z/(Z+S), the silk fabric drape nodes positions in the silk fabric images look balanced, as the yarns comprising the silk fabric specimen are filamentous yarns with the low level of twist both in warp and filling directions.
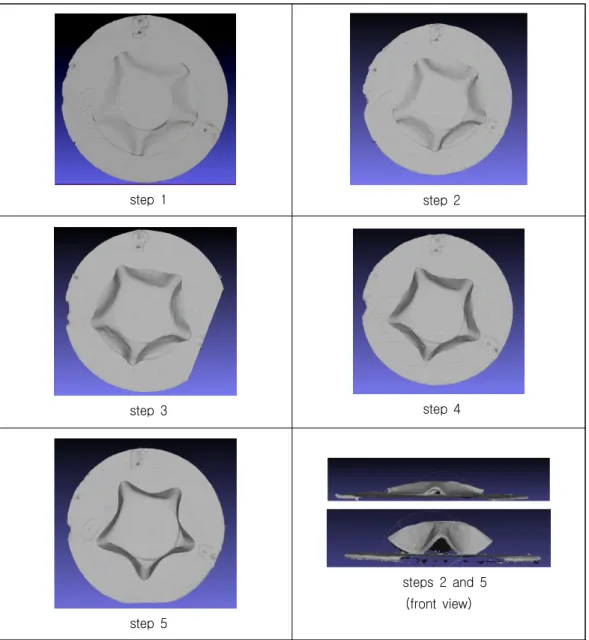
In the case of wool fabric specimen, as shown in Figure 3, the number of nodes is five at the final step. In this case of wool, even at the earliest elevation step of 1, it seems evident that the number of nodes is also five. It is shown that the position of the node crest and trough remains almost the same throughout the elevation steps.
step 1 step 2
step 3 step 4
step 5
steps 2 and 5 (front view)
Figure 2. Reconstructed 3D Scanned Object of Fabric Specimen by using a Depth Camera at each Elevation Step, Silk Specimen ( 5 Top views, and 2 front views)
Figure 4 shows the contour line extracted from the 3D reconstruction object image to calculate the drape coefficient. The area of the contour
line is calculated and the drape coefficient is obtained through the same calculation process as the conventional drape test.
step 1 step 2
step 3 step 4
step 5
steps 2 and 5 (front view)
Figure 3. Reconstructed 3D Scanned Object of Fabric Specimen by using a Depth Camera at each Elevation Step, Wool Specimen (5 Top Views, and 2 Front Views)
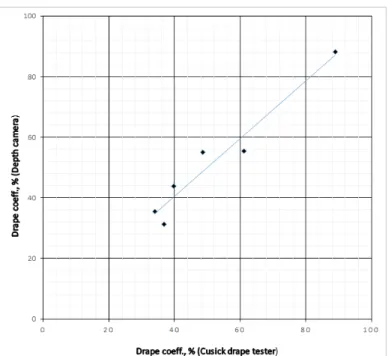
Figure 5 shows the correlation between the two drape test methods. The correlation coefficient between the drape coefficient(depth camera test) and the drape coefficient(Cusick drape test) is 0.97, which is reasonably high.
While the conventional drape test method gives simple results of drape coefficient(%), drape test based on the proposed depth camera would provide detailed information regarding the three-dimensional structure, comprising the
trough and crest shapes, or contour map, if needed by the user, and the changes of the 3D shapes during the elevation process. Even though Figure 5 does not convey all the information described above, further analysis on the 3D object file, as shown in Figure 6, such
Figure 4. Contour Line extracted from the 3D Reconstruction Image to calculate the Drape Coefficient
Figure 5. Correlation between the Two Drape Measurement Methods, Depth Camera Test vs. Cusick Drape Test
as contour representation of the trough and crest, would possibly provide the necessary information. In order to improve the accuracy improvement, however, the current depth camera may be replaced with better 3D scanner system.
Figure 6. Contour Representation of the 3D scanned Fabric Specimen showing Crest and Trough Details
Figure 7. Polylines drawn on the Mesh Surface of Reconstructed 3D Drape Object by using
‘PolylinesOnMesh’ Function of Rhino3D Software, Cotton Specimen(Step 5)
Figure 7 shows the image of polylines, by using the function, ‘PolylineOnMesh’, of Rhino3D software, on the mesh surface of reconstructed 3D cotton fabric drape object. Corresponding (x, y, z) values in Cartesian coordinates are extracted by using the function, ‘PolylinePoints’.
The number of nodes is 6, where the drape node positions seem rather less balanced.
Further investigation into the 3D drape shape, based on the previous studies, may possibly
yield interesting outcome in light of ‘Drape Unevenness’ parameter.
The amount of information contained in a 3D scanned image is vastly greater than the 2D information of the conventional drape test. The interpretation of the 3D scanned image, however, needs careful scheme for converting to 2D graphical presentation for easier comparison along the troughs or crest contour lines.
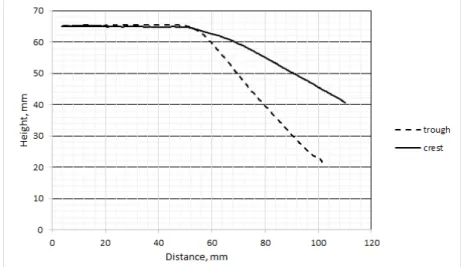
In Figure 8, therefore, the extracted points of
(x, y, z) are two dimensionally plotted in order to compare the height values of ‘z’ of node crest and trough lines. The distance, d, from the center of fabric drape object is d . The differences in the height values do not seem high compared to those of silk or linen fabric drapes shown in Figures 10 and 12.
Figure 9 shows the image of polylines, by
Figure 8. Height Profile of selected Crest and Trough of 3D Drape Object by using
‘PolylineOnMesh-PolylinePoints’, Cotton Specimen
Figure 9. Polylines drawn on the Mesh Surface of Reconstructed 3D Drape Object by using
‘PolylinesOnMesh’ Function of Rhino3D Software, Silk Specimen(Step 5)
using the function, ‘PolylineOnMesh’, of Rhino3D software, on the mesh surface of reconstructed 3D silk fabric drape object. Corresponding (x, y, z) values in cartesian coordinates are extracted by using the function, ‘PolylinePoints’.
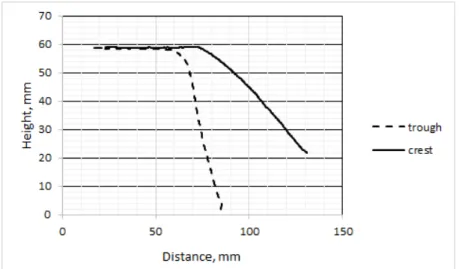
In Figure 10, the extracted points of (x, y, z) are two dimensionally plotted in order to compare the height values of ‘z’ of node crest and trough lines.
Since the drape coefficient of the silk is lower than that of cotton specimen, the overall contour lines of the silk specimen are closer to the imaginary vertical cylinder comprising the small round plate supporting the drooped fabric specimen, the trough and crest differences are large. The differences in the height values of trough and crest seem higher compared to those of the cotton fabric drape in Figure 7.
Figure 10. Height Profile of selected Crest and Trough of 3D Drape Object by using
‘PolylineOnMesh-PolylinePoints’, Silk Specimen
Figure 11. Polylines drawn on the Mesh Surface of Reconstructed 3D Drape Object by using
‘PolylinesOnMesh’ Function of Rhino3D Software, Linen Specimen(Step 5)
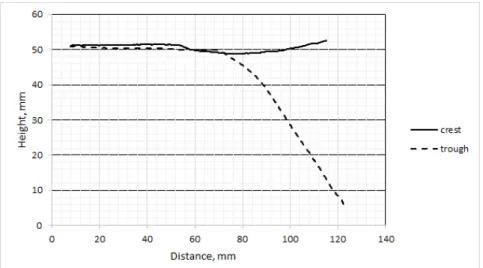
Figure 11 shows the image of polylines, by using the function, ‘PolylineOnMesh’, of Rhino3D software, on the mesh surface of reconstructed 3D linen fabric drape object. The linen specimen used in this study exhibits the highest stiffness to the touch. The drape image of the linen specimen shows only two nodes.
In Figure 12, the crest curve profile is almost horizontally linear without much curvature, while
Figure 12. Height Profile of selected Crest and Trough of 3D Drape Object by using
‘PolylineOnMesh-PolylinePoints’, Linen Specimen.
the trough curve profile shows downward curvature. This is attributable to the properties and structure of the comprising linen yarn, both in warp and filling directions.
. Conclusions
Ⅴ
In this study, a depth camera system, coupled with a 3D scanning software, is employed for three dimensional scanning of fabric drape with drape elevator method proposed in previous studies by several authors, and the drape measurement data are compared with those of the conventional Cusick drape test.
The results from the study suggest that the drape measurement method using the depth camera coupled with an elevating device for the fabric specimen allows relatively rapid acquisition of three dimensional drape information during the formation of fabric drape in the course of measurement process. The correlation between the results by conventional drape test and the
depth camera test methods are relatively good.
It is suggested, however, that further in-depth study would be necessary due to the instability of the depth measurement around the sharp edges of the fabric folds. Future application of improved depth camera system in terms of the depth sensitivity is also suggested for the comparative study of the drape properties of fabrics employing both the depth camera system and the conventional drape tester.
References
Al-Gaadi, B., Göktepe, F., & Halász, M. (2012).
A new method in fabric drape measurement and analysis of the drape formation process.
Textile Research Journal, 82(5), 502-512.
Chu, C., Cummings, C., & Teixeira, N. (1950).
Mechanics of elastic performance of textile materials: Part V. A study of the factors affecting the drape of fabrics -The development of a drape-meter. Textile
Research Journal, 20(8), 539-548.
Collier, B. (1991). Measurement of fabric drape and its relation to fabric mechanical properties and subjective evaluation, Clothing and Textile Research J., 10(1), 46-52.
Cusick, G. E. (1968). The measurement of fabric drape. Journal of the Textile Institute, 59(6), 253-260.
Henry, P., Krainin, M., Herbst, E., Ren, X., &
Fox, D. (2012). RGB-D mapping: Using Kinect-style depth cameras for dense 3D modeling of indoor environments. The International Journal of Robotics Research.
31(5), 647 663.–
Jeong, Y. (1998). A study of fabric drape behaviour with image analysis, Part I., J.
Textile Institute, 89(1), 70-79.
Kim, J. (2015). Evaluation of fabric drape based on rgb-d sensor system, 2015 SFTI_GAMMA Joint Symposium, Florence University, Italy, held on June 24-27, 2015.
Mah, T., & Song, G. (2010). An investigation of the assessment of fabric drape using three-dimensional body scanning. Journal of the Textile Institute, 101(4), 324-335.
Mizutani, C., Amano, T., & Sakaguchi, Y. (2005).
A new apparatus for the study of fabric drape. Textile Research Journal, 75(1), 81-87.
Park, C., Kim, S., & Ryu, W. (2004). Quantitative fabric drape evaluation system using image processing technology (Part 1: Measurement system and geometric model), Journal of Testing and Evaluation, 32(2), 131-137.
Peirce, F. (1930). The handle of cloth as a measurable quantity. Journal of the Textile Institute, 21(9), T377-416.
Sanad, R., Cassidy, T., Cheung, V., & Cheung, V. (2012). Fabric and garment drape measurement - Part 1, Journal of Fiber Bioengineering and Informatics, 5(4), 341-358.
doi:10.3993/jfbi12201201
Sanad, R., Cassidy, T., Cheung, V., & Evans, E.
(2013). Fabric and garment drape measurement - Part 2, Journal of Fiber Bioengineering and Informatics, 6(1), 1-22.
doi:10.3993/jfbi03201301
Schwarz, E. R. (1939). Technical evaluation of textile finishing treatments. Textile Research Journal, 9(6), 216-223.
Sidabraite, V., & Masteikaite, V. (2003). Effect of woven fabric anisotropy on drape behaviour, Materials Science, 9(1), 111-115.
Received (October 13, 2015) Revised (December 2, 2015) Accepted(December 16, 2015)