한국정보통신학회논문지(J. Korea Inst. Inf. Commun. Eng.) Vol. 21, No. 11 : 2089~2094 Nov. 2017
소셜네트워크 분석과 Co-word 분석을 사용한 Altmetric 연구 개발동향
이현창1 · 이가배2 · 신성윤3*
Development Tendency of Altmetrics Research: Using Social Network Analysis and Co-word Analysis
Hyun-Chang Lee
1· Jiapei Li
2· Seong-Yoon Shin
3*1
Department of Digital Content Engineering, Wonkwang University, Iksan 54538, Korea
2
Department of Library Information Consulting, Hebei Geology University, China
3*
School of Computer Inf. & Comm., Kunsan National University, Kunsan, Korea
요 약
알트메트릭스는 인용을 기반으로 한 전통적인 지표를 보완하기 위한 측정 지표이면서 정략적 데이터이다. 이러한 알트메트릭스 에 관한 연구는 지난 몇 년간 전통적인 계량 정보학의 보완에 힘입어 중요한 비중을 차지해오고 있다.
본 논문은 알트메트릭스 연구 현황과 동향을 파악하는 것을 목적으로 한다. 총 187건의 논문을 분석하였으며, 이를 통해 2005년이후로 알트메트릭스 연구에 지속적인 상승이 있음을 알 수 있다. 소셜 네트워크 분석과 co-word 분석을 사용하여 저자 협동 네트워크와 키워드 공존 네트워크를 구축한다. 계층적 클러스터링으로 4개의 알트메트릭스 연 구가 발견되었으며, 그 결과는 알트메트릭스의 추후 연구에 매우 유용할 수 있다.
ABSTRACT
Altmetrics is the measurement index and quantitative data to complement the traditional indicators based on the citation. Altmetrics research has acquired greater importance in the past few years, partly due to the complement to the traditional bibliometrics. This paper aims to reveal the research status and trends in altmetrics research. A total of 187 articles from 2005 to 2017 are obtained and analyzed, illustrating a steady rise (S-mode) in altmetrics research since 2005. Using social network analysis and co-word analysis, the author cooperation network and keyword co-occurrence network are developed. The core scientists and eight international research groups are discovered, reflecting that researchers in this field have a low degree of cooperation. Four topics of altmetrics research are discovered by hierarchical clustering. The results can be useful for the advanced research of altmetrics.
키워드: 알트메트릭스, 소셜네트워크 분석, 공통어분석, 공발생 네트워크
Key word: Altmetrics, Social Network Analysis, Co-word Analysis, Co-occurrence Network
Received 25 October 2017, Revised 01 November 2017, Accepted 05 November 2017
* Corresponding Author Seong-yoon Shin (E-mail:[email protected]. Tel:+82-63-469-4860) School of Computer Information & Communicarion Engineering, Kunsan National University, Kunsan, Korea
Open Access
https://doi.org/10.6109/jkiice.2017.21.11.2089
print ISSN: 2234-4772 online ISSN: 2288-4165Ⅰ. Introduction
Preim presented the concept of Altmetrics for the first time in the 2010 Altmetrics Manifesto [1]. Altmetrics is the measurement index and quantitative data to complement the traditional indicators based on the citation. It may include but are not limited to the following sources, peer review, references and public policy documents of Wikipedia, research blog, the mainstream media reports, document management software, social media mention etc.. On January 14, 2013, NSF (National Science Foundation U.S) asked a principal investigator to list his or her "research products" including, but not limited to, publications, data sets, software, patents, and copyrights [2]. The accepted research product must be citable and accessible. This means that a scientist’s worth is not dependent solely on publications. Data sets, software and other non- traditional research products will count too.
Scholarly impact assessment using altmetrics is a new development of informetrics. The related research can be traced back to the idea of Distributed Scientific Evaluation based on social software. As an evaluation mechanism of webometrics, altmetrics has aroused the attention of a wide range of scholars while enriching and broadening the content and methodology of informetrics disciplines. This paper took Web of Science database as the data source, investigates the current situation of research in the field of altmetrics by social network analysis and co-word analysis, predicts its development trend, and provides reference and consideration for the further study of altmetrics.
Ⅱ. Relative works and Datasets
2.1. Data Collection
The first step consisted in identifying publication from a robust and reliable database. Web of Science was the chosen database as it is considered one of the largest abstract and citation database with all parts of the scope
of the study. The research chose "altmetric*",
"alternative metric*", "social media metric*" and
"alternative indicator *" as keywords to retrieve in the subject field and time spanning from 2005 to 2017, unlimited language and documentation. After final filtration, 187 articles were obtained totally as Table. 1 shown. The results were exported in the bibliography as text format.
Table. 1 Data Collection Result
Database Record
Web of Science Core Collection 179
SciELO Citation Index 5
KCI - Korean Journal Database 3
Secondly, based on the text data set, data processing.
In sequence, file conversion, field extraction, frequency statistics, co-occurrence matrix generation were done and ultimately saved as the data to be analyzed.
2.2. Methodology
Co-word analysis generally refers to the method of extracting the words from the articles in the relevant subject areas and calculating the frequency of occurrence of each word in order to obtain the correlation between words. That is, if two keywords simultaneously appear in the same paper, the two subjects mentioned in this paper are correlated with each other. The research patterns and trends in specific areas can be examined by calculating the intensity of correlation between words. Co-word analysis is widely used to explain a research field, to explore the relationship among subjects within the field, to examine the historical context and evolution trend of the research topic development [3].
Social network analysis (SNA) is the process of
investigating social structures through the use of
networks and graph theory [4]. It characterizes
networked structures in terms of nodes (individual actors,
people, or things within the network) and the ties, edges,
or links (relationships or interactions) that connect them.
Social network analysis has emerged as a key technique in modern sociology. It has also gained a significant following in anthropology, biology, geography, history, information science, organizational studies, political science, social psychology, development studies, sociolinguistics, and computer science [5].
2.3. Research Method
Firstly, we used the SPSS23 to fit the annual growth curve distribution of the papers in the field of
"Altmetrics" to reveal the degree of interest of the researchers in the subject and the trend of future development of this subject.
Secondly, the "co-occurrence matrix of authors" was used to analyze the author cooperation and find the cooperation between the national research teams and countries in the topic of altmetrics. Using various indicators of the social network, core teams and authors were discovered. Thirdly, the keywords co-occurrence matrix was imported into the software UCINET6 to build keywords co-occurrence network. The clustering diagram was constructed using high-frequency keywords hierarchical clustering analysis. And altmetrics research sub-fields were derived.
Ⅲ. Analysis and Results
3.1. Literature distribution and trend analysis
In the bibliometrics, the number of published papers not only represents the research capacity of institutions and individuals but also is an important symbol of the research progress in the relative field. As it can be obtained that only a few papers were published from 2005 to 2011. From 2012 to the present, as on the growth stage, the number of papers published has been increased sharply from 3 in 2012 to 55 in 2016.
In the 12 year development of altmetrics subject from 2005 to 2017, what is the law of literature growth? In this paper, regression analysis was used to establish a regression model to explore the relationship between the
papers number and time serial and established the forecasting model. This paper used regression analysis of curve estimation method, found fitting cumulative dispatch S-model is the most suitable for the subject growth rate of change over time. R2 = 0.950, significance less than 0.001. Moreover, the test of regression coefficients of the model is less than 0.5, which shows that the regression coefficient of S-model is significant. From this, we developed the forecasting model as follows.
As shown in Fig. 1, the number of publication on altmetrics has been steadily growing at a fast pace. It can be presumed that the publication number will also show an increasing trend in the coming years, and the period of inflection has not come yet.
Fig. 1 Overview of publication on altmetrics
3.2. Author cooperation network
The author's co-occurrence matrix was transformed into the social network analysis software Ucinet, and the author's cooperation network diagram was generated with Netdraw, one of the software integrated visualization tools. After removing the isolated author on the web, node size was adjusted according to nodes’
centrality degree. Fig. 2 gives an overall view of author
cooperation network. There are 8 major national network
subgroups in the altmetrics research. They are American
Canadian British cooperative subgroups, American
Canadian medical cooperation subgroups, American
subgroups, China subgroups, Singapore subgroups,
Canadian subgroups, Spanish subgroups, and Italy subgroups. And each subgroup has a ring structure which is more efficient and smooth in information communi- cation than the star-structure and Y-structure. In addition, the current research is still based on small group studies.
International cooperation has not yet emerged except in the cooperation between the United States, Canada, and the United Kingdom.
Thelwall, Mike
Haustein, Stefanie Kousha, Kayvan
Lariviere, Vincent
Holmberg, Kim Owen, Kate
Costas, Rodrigo
Wang, Xianwen
Gorraiz, Juan
Peters, Isabella Mohammadi, Ehsan
Griner, Erin
Bowman, Timothy D.
Sugimoto, Cassidy R.
Gumpenberger, Christian Zahedi, Zohreh
Xu, Shenmeng
Fang, Zhichao
Wouters, Paul
Theng, Yin-Leng
Scotti, Valeria Erdt, Mojisola
Young, Lisa
Priem, Jason
Dinsmore, Adam Kerwin, John
Maherali, Nimet
De Silvestri, Annalisa Mao, Wenli
Dolby, Kevin
Thoma, Brent Bar-Ilan, Judit Glanzel, Wolfgang
Sharma, Vidhu Bhargava, Ajay
Mas-Bleda, Amalia
Miro, Oscar
Curti, Moreno
Yu, Houqiang Fernandez-Guerrero, Ines M.
Rapple, Charlie Aung, Htet Htet
Ramnanan, Christopher J.
Allison, Anne B.
Trueger, N. Seth Amath, Aysah
Xiao, Tingting Repass, John
de las Mercedes Leal-Lobato, Maria Wood, Timothy J.
Lin, Michelle
Fig. 2 Overview of author cooperation network
3.2.1. Network density
The network density refers to the closeness between the various members of the network, by comparing the number of existing relations in the network with the theoretically possible number of relationships, the more the members are connected, the greater the density of the network. The greater the density of the overall network, the network may have more influence on the attitudes and behavior of the actors involved. The author's density of cooperation network is 0.0333, indicating that researchers in this field have a low degree of cooperation, limited communication and weak exchange of information on altmetrics researches.
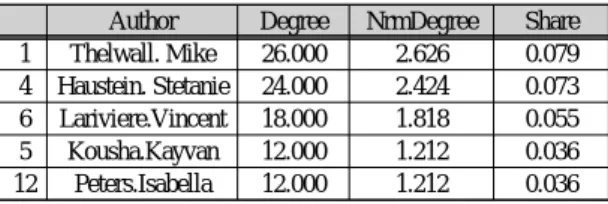
3.2.2. Author degree centrality
The degree centrality is used to measure the importance of the author in the network [6]. The author’s higher degree centrality indicates that he or she has a central role in working with more authors in the network and higher influence in the network. Thought degree centrality analysis, we calculated the degree centrality of the top five authors, as Table. 2 shown. The degree
centrality of Thelwall.Mike is the largest, followed by Haustein.S, Lariviere.V and so on. It shows that these authors have frequent communication with other authors in the network and play a central role in the cooperation network in the field of altmetrics subject.
Table. 2 Author degree centrality top five
Author Degree NrmDegree Share
1 Thelwall. Mike 26.000 2.626 0.079
4 Haustein. Stetanie 24.000 2.424 0.073 6 Lariviere.Vincent 18.000 1.818 0.055
5 Kousha.Kayvan 12.000 1.212 0.036
12 Peters.Isabella 12.000 1.212 0.036
3.2.3. Author betweenness centrality
In graph theory, betweenness centrality is a measure of centrality in a graph based on shortest paths. It represents the degree of which nodes stand between each other. A node with higher betweenness centrality would have more control over the network because more information will pass through that node. The higher the author betweenness centrality is, the more academic resources he or she has, the more academic creativity he or she has.
Moreover, he could use the academic resources to improve his academic status. As shown in Table. 3, the betweenness centrality of authors Thelwall.M, Haustein.
S, Peters.I, Lariviere.V and Costas.R is in the forefront, and they are the core scientists linking other authors, and they can influence research groups by controlling the transmission of information. They have had an advanced impact on the research of altmetrics.
Table. 3 Author betweenness centrality top five
Author Betweenness nBetweenness1 Thelwall. Mike 92.733 1.912
4 Haustein. Stetanie 65.100 1.342
12 Peters. Isabella 57.000 1.175
6 Lariviere.Vincent 38.100 0.785
9 Costas.Rodrigo 38.000 0.783
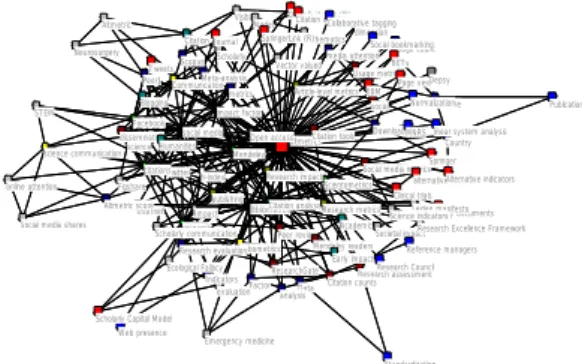
3.3. Co-occurrence network analysis of high-frequency keywords
The high-frequency keyword co-occurrence matrix
was imported into Netdraw software and the nodes were displayed according to the centrality as shown in Fig. 3.
It can be seen from the figure that the largest square node of the network is in the central core of the network, it indicates that altmetrics, social media, bibliometrics, twitter, and impactor are the core keywords in the field of altmetrics and also the research hotspots in this field at present. Other related studies are around these core keywords. However, from the perspective of the overall network structure, in the past 10 years, the research on the index of substitution still presents an inward concentration pattern which indicates that the representative branches of research have not appeared.
altmetrics social media
Bibliometrics Twitter
impact factor
Scientometrics Mendeley
citations
Citation analysis research
webometrics Open access
Peer review Facebook
Research evaluation Research impact
Article-level metrics
science
evaluation Scholarly communication
Communication Citation
h-index
Impact Altmetric
metrics
Research metrics dissemination
Research assessment Citation counts Indicators
science communication
Data Scholarly
Social media metrics
Societal impact Medicine Mathematics
analysis Academic Mendeley readers STEM
ResearchGate Download Meta-analysis
Early impact Factor
Neurosurgery
Internet publishing Blogging
Policy documents Usage metrics
Humanities Visibility
Emergency medicine
alternative metrics
Ecological Fallacy
social Scopus
Country
Altmetric score Leiden manifesto
Citation tools Model
Normalization Publication
social media shares
MNRS OrthoEvidence (R)
Alternative indicators Citation databases
Research Excellence Framework dimension
Usage count
Page view BETs
Web presence
Springer SpringerLink (R)
media attention
online attention Figshare
Science indicators Tweets
Social bookmarking Journal
linear system analysis Depsy
Standardization EBM Collaborative tagging
Reference managers PeerJ
Vector valued
Research Council Clinical trials
Scholarly Capital Model
Fig. 3 High-frequency keywords co-occurrence network
3.4. High-frequency keywords co-word cluster analysis The hierarchical group analysis was performed. As a result of performing cluster using the Ward method and distance measure with the Euclidean distance, a high- frequency keywords clustering dendrogram was drawn as shown in Fig. 4.
Fig. 4 High-frequency keywords clustering dendrogram
The dendrogram can be divided into four clusters.
Group 1, which is the first cluster, forms a large group including 10 keywords from ‘open access’ to
‘webometrics’. Group 2 includes 10 keywords from
‘h-index’ to ‘research evaluation’ and Group 3 includes three keywords from ‘social media’ to ‘bibliometrics’.
Group 4 includes keyword ‘altmetrics’. Examining the internal attributes of each group, the following four topics:
Group 1: Source of altmetrics and their relationships From the perspectives of scientometrics and webometrics, the data sets obtained from open access, peer review and Mendeley were analyzed. And it was found that there was a positive weak correlation between the altmetrics.
Group 2: Scholarly communication and research evaluation
The spread of academic literature in social media has a long history. Social media can facilitate the rapid exchange and dissemination of science. Acting as a complement rather than a substitute to traditional metrics, altmetrics can be used to evaluate scholarly impact in social media.
Group 3: Bibliometrics in Social Media.
In order to explore the correlation between traditional metrics and altmetrics, the researchers used data from social networking sites such as Twitter and Facebook to verify the positive correlation between the number of citations and alternative measures through empirical analysis.
Group 4: The connotation of altmetrics
Adie.E proposed that altmetrics was an indicator of publication evaluation by accessing and enabling a large amount of data that could be quickly accumulated [7].
Some scholars have argued the validity and reliability of
altmetrics. It can be inferred that scholars' understanding
of the word "Altmetrics" is not unified enough, and the
discussion of its deep meaning will continue.
Ⅳ. Conclusions
The attractiveness of altmetrics is growing globally and playing an active role in information science.
Therefore, it is fundamentally important for researchers interested in this subject to understand the status quo of studies being undertaken worldwide and to have the overall picture of it. We conducted a bibliometrics literature review from the Web of Science Database over the period of 2005-2017 focusing on the altmetrics subject. Bibliometrics findings indicated that the gentle growth from 2005 to 2011 and the rapid growth of S-modes from 2012 till now. The growth trend will continue without inflection point. Moreover, we developed the social network analysis for altmetrics literature for the author cooperation and national cooperation. As a result, eight major partner subgroups emerged. Additionally, as a result of hierarchical group analysis, the altmetrics research area could be categorized into four subgroups while “altmetrics” was actively studied as closely related with the subject concepts “bibliometrics” and “social media”.
REFERENCES
[1] J. Priem, D. Taraborelli, P. Groth, C. Neylon. (2010, October). Altmetrics: A Manifesto [Internet]. Avalable : http://altmetrics.org/manifesto.
[2] H Piwowar, “Altmetrics: Value all research products,”
Nature, vol. 493, no. 7432, pp. 159, Jan. 2013.
[3] Y Ding, G G Chowdhury, S Foo, “Bibliometric cartography of information retrieval research by using co-word analysis,”
Information Processing & Management, vol. 6, no. 37, pp.
817-842, Nov. 2001.
[4] E Otte, R Rousseau, “Social network analysis: a powerful strategy, also for the information sciences,” Journal of
Information Science, vol. 6, no. 28, pp. 441-453, Dec. 2002.
[5] J. Y. Lee, Y. H. Park , “Social Network Analysis of author`s interest area in Journals about Computer,” Journal of the
Korea Institute of Information and Communication Engineering, vol. 20, no. 1, pp. 193-199, Jan. 2016.
[6] Y. H. Kim, J. S. Hong, H. J. Cha, K. H. Kook, “A Study of Personal Information Handler Based on Social Network Analysis,” Journal of Security Engineering, vol.13, no.2 , pp.
143-154, Apr. 2016.
[7] E Adie, W Roe , “Altmetrics: enriching scholarly content with article-level discussion and metrics,” Learned Publishing ,vol.
1, no. 26, pp. 11-17, Jan. 2013.
이현창(Hyun-Chang Lee)
Dean of Digital Content Engineering Department at Wonkwang University in Korea. He obtained his Ph.D. and M.S.
from the University of Hongik, Seoul in Korea, in 2001 and 1996, respectively. Since 2008, he has been a professor in Wonkwang University. His major interests include business intelligence, IoT, AR&VR and data science fields.
이가베(Li jiapei)
Received her M.S. degree from information department in Tianjin normal university in China. From 2008 to the present, she has been an assistant professor in the Library of Hebei geology university in China. Her research interests include data science and text mining
신성윤(Seong-Yoon Shin)
Received his M.S. and Ph.D. degrees from the Dept. of Computer Information Engineering of Kunsan National University, Gunsan, Korea, in 1997 and 2003, respectively. From 2006 to the present, he has been a professor in the same department. His research interests include image processing, computer vision, and virtual reality