Print ISSN: 1738-3110 / Online ISSN 2093-7717 http://dx.doi.org/10.15722/jds.17.01.201901.11
Dynamic Spillover for the Economic Risk in Korea on Global Uncertainty
Ji-Hong Jeon
*Received: November 14, 2018. Revised: November 20, 2018. Accepted: January 05, 2019.
Abstract
Purpose – We document the impact of economic policy uncertainty (EPU) in the US and China on the dynamic spillover effect of macroeconomics such as stock price, housing price in Korea.
Research design, data, and methodology – We use the nine variables to analyze the effect which produces a result among the EPU indexes of the US and China on economic variables which is the consumer price index (CPI), housing purchase price composite index, housing lease price, the stock price index in banking industry, construction industry and distribution industry, and composite leading indicator from January 1995 to December 2016 with the Vector Error Correction Model.
Result – The US EPU index has significantly a negative relation on the CPI, housing purchase price index, housing lease price index, the stock price index in banking industry, construction industry, and distribution industry in Korea.
Conclusions – We find the dynamic effect of the EPU indexes in the US and China on the macroeconomics returns in Korea. This study has an empirical evidence that the economy market in Korea is influenced by the EPU index of the US rather than it of China. The higher EPU, the more risky the economy of in Korea.
Keywords: Spillover, Macroeconomics, Economic Policy Uncertainty, Distribution.
JEL Classifications: C32, D80, E60, E66.
1. Introduction
We consider economic policy uncertainty (EPU) of the US and China, greatly affect the financial economy in Korea.
What country's EPU will have more impact if it affects Korea's economy? We estimate the impact of EPU of the US and China on the financial market returns in Korea.
Today, the impact of the US and China on the world economy is huge. Especially, the effects of developed countries' economic crisis like 2007 global financial crisis on the economic market of the developing countries in the past, were incomprehensible. For example, in the outcome of 2007 subprime mortgage crisis from US, many Asian and European countries, including Korea, have adversely affected the macroeconomics such as the housing and stock market.
We can find out through previous studies that the uncertainties in national economic policy and the relationship with the housing market are very close.
According to Baffoe-Bonnie (1998), housing prices and
* First Author and Corresponding Author, Adjunct Professor, School of Business, Hanyang University, Korea.
Tel: +82-2-2220-2435, E-mail: [email protected]
housing stock are directly related to US economic cycles. In this connection, the government says that the overall economy drives by the policies on the financial market. If financial policies are actively pursued, they can lead the economy steadily. Then housing is an important factor in the economy. Meen (2002) finds that differences in the time-series of house prices for the US and the UK are related to the policy concern and the institutional structure.
Benjamin et al. (2004) analyze real estate and financial wealth, pensions and insurance, as an example of US consumption. Tax policy also focuses on debt and assets on housing, deducting mortgage rates and lowering interest rates at the national level to boost household consumption and increase debt. Leung (2004) documents the importance of the macroeconomics through more than 200 previous studies.
2. Literature Review
We have a literature review about the EPU and economy for US and China after the global financial crisis.
while the increase in volatility in the stock market increases uncertainty. In other words, the policy uncertainty and the stock market move steadily negative over time. Wang and Kim (2014) document the reverse mortgage loans in China to deal with the aging population issue. Mian and Sufi (2014) study that it is be larger in countries experiencing a massive decline in housing net worth as business uncertainty increases, while housing booms are likely to encourage increase in pre-recession employment patterns, such as Great Recession. and the effect on the employment pattern. A study of the US find that the greater the impact of uncertainty, the worse the economy could be. Liu and Zhang (2015) study the predictability of US EPU and stock market volatility, and found that the higher the EPU, the more significant the market volatility increases.
Muellbauer (2015) examines the US consumer price index (CPI) associated with Rents rents. Rents are slowly increasing compared to home sales prices, but highly correlated. Home prices are an important predictor of US consumer prices one year ahead. Antonakakis et al. (2015) study stocks, housing, and economic variables due to economic fluctuations in the United States, focusing on EPU.
Baker et al. (2016) make the EPU indexes of many countries including the US, China through the frequency of newspaper articles, and analyze the dynamic relation between EPU and financial economy. Zhang et al. (2016) document the urban housing demand in West area of China using the macro-data. Zheng et al. (2016) study that the housing market in China is an important aid to economic revitalization and the government's budget expansion. Jeong (2017) examines to predict for credit loans and loan collateralized with housing. Ngene et al. (2017) study the conditions of the US housing market, uncertainties in financial markets, economic downturn and uncertainty in economic policy. The uncertainty of economic policy and the housing market are inversely related, and as the uncertainty increases, the housing market growth and investment are adversely affected. Jeon (2018) finds out the spillover effect for market in Korea on the impact for Asian countries with macroeconomic data such as producer price index (PPI), CPI. In the study, the housing market in Korea can predict with the EPU trend of the Asian countries.
including the US, Japan, and Korea through the frequency of newspaper articles, and study the relationship between the EPU index and economic policy. The EPU Index is based on E (Economy), P (Policy), and U (Uncertainty) in newspaper articles. For example, US EPU index is made from 10 leading newspapers which are USA Toady, LA Times, NY Times and so on. The EPU index is mainly used to study the relationship between the EPU of the country and economic indicators. The CPI, housing purchase price index (HPPI), housing lease price index (HLPI), construction stock index (CSI), and banking stock index (BSI), distribution stock index (DSI) and composite leading indicator (CLI). The data sources for EPU indexes of the United States and China come from Baker et al. (2016). As a macroeconomic index, the CPI and CLI are data from the Statistics Korea (KOSTAT). The HPPI and HLPI are data from Kookmin Bank (KB). And the CSI, BSI, DSI are supplied by FnGuide.
Previous studies show that CPI is an index closely related to EPU. (Sung et al., 2014; Jeon et al., 2017).
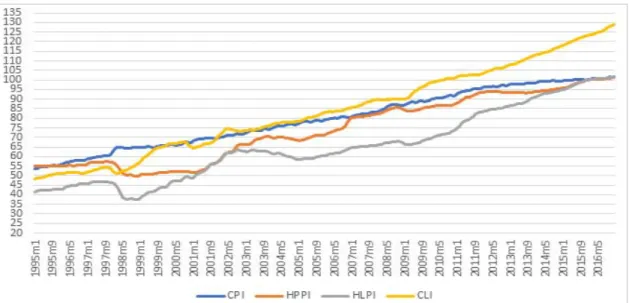
Figure 1 illustrates the relationship among CPI, HPPI, and HLPI. Korea's CPI has risen 89% over the last 22 years, with HPPI and HLPI rising 84% and 145%, respectively. Yu and Lee (2010) investigate that Korea's CPI is closely related to HPPI and HLPI. As for the CLI, Atabek et al.
(2005) show that Turkey's leading economic index responded to economic changes in advance. In addition, the CLI predict changes in economic growth and contraction through long-term trends.
As for the stock price index, Figure 2 shows that CSI, BSI, and DSI move in the same direction. Baffoe-Bonnie (1998) investigates that economic theory shows to forecast that the housing price and the stock of houses have a co-movement cycle. Then we can select CSI, BSI, and DSI as the indexes closely referred the housing market. When the housing market improves, the construction, banking, and distribution stock indexes are also rising. On the other hand, as the EPU index rises, it can be predicted that the stock index will fall.
The summary statistics for EPU indexes and economic variables using this study show in Table 1 as follows.
Figure 1: The cycles of consumer price index (CPI), housing purchase price index (HPPI) and housing lease price index (HLPI), and composite leading indicator (CLI). (1995:01-2016:12).
Figure 2: The cycles of the Construction Stock Index (CSI), Banking Stock Index (BSI) and Distribution Stock Index (DSI). (1995:01-2016:12).
Table 1: Summary Statistics
US EPUI China EPUI CPI HPPI HLPI BSI CPI DSI CLI
Mean 4.644 4.610 4.361 4.278 4.141 5.485 4.969 5.878 4.391
Median 4.612 4.607 4.371 4.268 4.139 5.483 5.003 6.052 4.418
Min. 3.8012.204 3.9813.905 3.624 4.288 3.644 4.729 3.879
Max. 5.647 6.372 4.6214.619 4.6216.452 6.275 6.498 4.858
S.D. 0.369 0.656 0.188 0.235 0.280 0.434 0.657 0.433 0.282
Note:
1. EPUI, CPI, HPPI, HLPI, BSI, CPI, DSI, and CLI indicate separately Economy Policy Uncertainty Index, Consumer Price Index, Housing Purchase Price Index, Housing Lease Price Index, Banking Stock Index, Construction Stock Index, Distribution Stock Index, and Composite Leading Indicator.
2. Observations are 264 for each variables.
∆
∆ ′ (1)where
is a vector of ( × ) matrix when the endogenous variables are I (1), that is, is Economy Policy Uncertainty Index in the US and China, Consumer Price Index, Housing Purchase Price Index, Housing Lease Price Index, Construction Stock Index, Banking Stock Index, Distribution Stock Index, and Composite Leading Indicator); is lag order (1, 2, ..., N);
is maximum of lag order; is period (1, 2, ..., T); is × matrix coefficient; ′ is lagged error correction term, where
is adjustment parameters, and ′ is cointegration vectors; is vector of deterministic components;
is × vector of disturbances.4. Statistical Results 4.1. Unit Root Tests
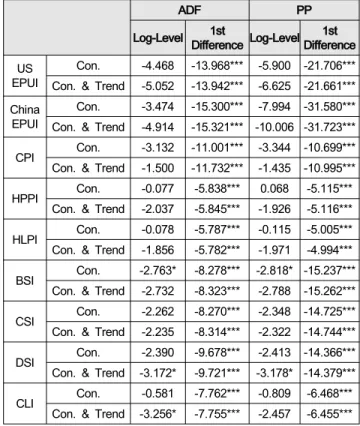
We find that the unit root tests with ADF and PP tests is examined to measure if there is strong autocorrelation between monthly time series by Granger and Newbold (1974). In Table 2, the level variable that take log data in raw data has a unit root, but the result of the first difference shows that it has no unit root. We find that the first subordinate time series has stability because there is no unit root.
4.2. Cointegration Test
We conclude that the cointegration relation of time series exists through the cointegration test developed by Johansen (1988) as shown in Table 3. Johansen test is divided into Trace statistic and Maximum eigen value (λmax). Ho is a hypothesis that it has no cointegration. Because the cointegration exists, the VECM, rather than the VAR, is used for the empirical analysis.
CPI Con. -3.132 -11.001*** -3.344 -10.699***
Con. & Trend -1.500 -11.732*** -1.435 -10.995***
HPPI Con. -0.077 -5.838*** 0.068 -5.115***
Con. & Trend -2.037 -5.845*** -1.926 -5.116***
HLPI Con. -0.078 -5.787*** -0.115 -5.005***
Con. & Trend -1.856 -5.782*** -1.971 -4.994***
BSI Con. -2.763* -8.278*** -2.818* -15.237***
Con. & Trend -2.732 -8.323*** -2.788 -15.262***
CSI Con. -2.262 -8.270*** -2.348 -14.725***
Con. & Trend -2.235 -8.314*** -2.322 -14.744***
DSI Con. -2.390 -9.678*** -2.413 -14.366***
Con. & Trend -3.172* -9.721*** -3.178* -14.379***
CLI Con. -0.581-7.762*** -0.809 -6.468***
Con. & Trend -3.256* -7.755*** -2.457 -6.455***
Note:
1. ADF and PP denote Augmented Dicky-Fuller and Phillips- Perron separately.
2. EPUI, CPI, HPPI, HLPI, BSI, CPI, DSI, and CLI indicate separately Economy Policy Uncertainty Index, Consumer Price Index, Housing Purchase Price Index, Housing Lease Price Index, Banking Stock Index, Construction Stock Index, Distribution Stock Index, and Composite Leading Indicator.
3. Con, Con. & Trend denote constant, and constant and trend.
4. ***, **, * mean 1%, 5%, 10% levels.
Table 3: Cointegration Test Ho Trace 5% Critical
Value λmax 5% Critical Value
r=0 304.52 192.89 100.86 57.12
r≤1203.66 156.00 55.20 51.42
r≤2 148.46 124.24 40.99 45.28
r≤3 107.47 94.15 33.45 39.37
r≤4 74.02 68.52 26.68 33.46
r≤5 47.34 47.2121.78 27.07
r≤6 25.56* 29.68 14.76 20.97
Note: * means 5% levels.
4.3. Granger Causality Test
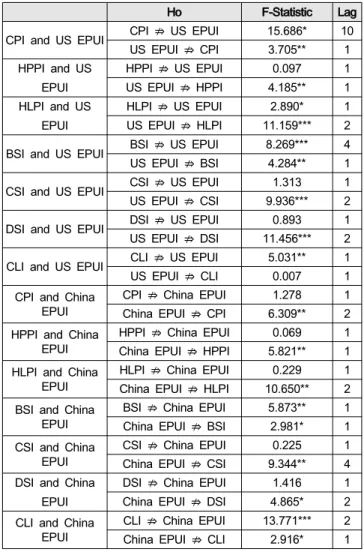
We measured the Granger causality test by Granger
(1980) to examine the relationship between US and China EPU indexes on the Korean economic indexes in Table 4, and Granger causality test in the specific lag shows only past values of X can “does Granger cause” Y when the null hypothesis (Ho) is significant and then it is rejected.
The US EPU index had a causal relationship to all Korean economic index variables except CLI. China EPU index had a causal relationship to all Korean economic index variables. The Granger causality test showed that the EPU indexes of the US and China had a significant causal relationship to the Korean economy.
Table 4: Granger Causality Tests
Ho F-Statistic Lag
CPI and US EPUI CPI ⇏ US EPUI 15.686* 10 US EPUI ⇏ CPI 3.705** 1 HPPI and US
EPUI
HPPI ⇏ US EPUI 0.097 1
US EPUI ⇏ HPPI 4.185** 1 HLPI and US
EPUI
HLPI ⇏ US EPUI 2.890* 1
US EPUI ⇏ HLPI 11.159*** 2 BSI and US EPUI BSI ⇏ US EPUI 8.269*** 4 US EPUI ⇏ BSI 4.284** 1 CSI and US EPUI CSI ⇏ US EPUI 1 .31 3 1
US EPUI ⇏ CSI 9.936*** 2 DSI and US EPUI DSI ⇏ US EPUI 0.893 1 US EPUI ⇏ DSI 11.456*** 2 CLI and US EPUI CLI ⇏ US EPUI 5.031** 1
US EPUI ⇏ CLI 0.007 1
CPI and China EPUI
CPI ⇏ China EPUI 1.278 1
China EPUI ⇏ CPI 6.309** 2 HPPI and China
EPUI HPPI ⇏ China EPUI 0.069 1
China EPUI ⇏ HPPI 5.821** 1 HLPI and China
EPUI
HLPI ⇏ China EPUI 0.229 1 China EPUI ⇏ HLPI 10.650** 2 BSI and China
EPUI BSI ⇏ China EPUI 5.873** 1
China EPUI ⇏ BSI 2.981* 1 CSI and China
EPUI
CSI ⇏ China EPUI 0.225 1
China EPUI ⇏ CSI 9.344** 4 DSI and China
EPUI
DSI ⇏ China EPUI 1.416 1
China EPUI ⇏ DSI 4.865* 2 CLI and China
EPUI CLI ⇏ China EPUI 13.771*** 2
China EPUI ⇏ CLI 2.916* 1 Notes:
1. ⇏ means “does not Granger Cause”.
2. ***, **, * mean 1%, 5%, and 10% levels.
3. EPUI, CPI, HPPI, HLPI, BSI, CPI, DSI, and CLI indicate separately Economy Policy Uncertainty Index, Consumer Price Index, Housing Purchase Price Index, Housing Lease Price Index, Banking Stock Index, Construction Stock Index, Distribution Stock Index, and Composite Leading Indicator.
4.4. VECM Analysis
Optimal lags for VECM are set to lag 2 through the Schwarz-Bayesian Information Criterion (SBIC) as shown in Table 5.
Table 5: Lag Order Selection
lag SBIC HQIC AIC
0 -8.880 -8.954 -9.003
1 -35.060 -35.797 -36.293
2 -36.125* -37.526 -38.467 3 -35.604 -37.668 -39.055 4 -34.610 -37.337 -39.171 Note: * means the lag selected.
The results for VECM show in Table 6. The US EPU index has a significant negative relationship to all Korean economic indices except CLI. On the other hand, in China EPU index, only the CLI of all Korean economic indexes has a significant negative relationship.
Table 6: Estimation Results of VECM
US EPUI China EPUI
CPI -0.002** (0.001) -0.001 (0.001) HPPI -0.002** (0.001) 0.001 (0.001) HLPI -0.003** (0.001) 0.001 (0.001)
BSI -0.052* (0.029) 0.014 (0.014)
CSI -0.065** (0.032) 0.0148 (0.016) DSI -0.072*** (0.026) -0.003 (0.013) CLI -0.001 (0.001) -0.001** (0.001) Notes:
1. ***, **, * mean 1%, 5%, and 10% levels.
2. ( ) means standard errors.
3. EPUI, CPI, HPPI, HLPI, BSI, CPI, DSI, and CLI indicate separately Economy Policy Uncertainty Index, Consumer Price Index, Housing Purchase Price Index, Housing Lease Price Index, Banking Stock Index, Construction Stock Index, Distribution Stock Index, and Composite Leading Indicator.
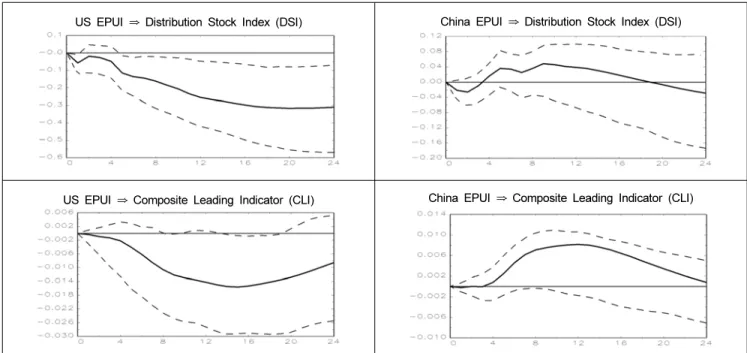
4.5. Impulse Response Function
The impulse response functions to EPU Index Shocks of the US and the China are shown in Figure 3. Kilian and Murphy (2014) estimate that impulse response functions
are used to support the result of VAR model. We can know that the result of impulse response function is similar to the it of VECM.
US EPUI ⇒ Housing Purchase Price Index (HPPI) China EPUI ⇒ Housing Purchase Price Index (HPPI)
US EPUI ⇒ Housing Lease Price Index (HLPI) China EPUI ⇒ Housing Lease Price Index (HLPI)
US EPUI ⇒ Banking Stock Index (BSI) China EPUI ⇒ Banking Stock Index (BSI)
US EPUI ⇒ Construction Stock Index (CSI) China EPUI ⇒ Construction Stock Index (CSI)
US EPUI ⇒ Distribution Stock Index (DSI) China EPUI ⇒ Distribution Stock Index (DSI)
US EPUI ⇒ Composite Leading Indicator (CLI) China EPUI ⇒ Composite Leading Indicator (CLI)
Note: The dotted line means 95% confidential interval and the thick line means the impulse response.
Figure 3: Impulse Response Functions to EPU Index Shocks of the US and the China.
4.5.1. Impulse response for US EPU index
In detail, the CPI drops after impact on the US EPU index, reaching the lowest point in the 2nd month. The decline in US EPU index stimulates CPI's demand. The reaction from the 2nd month reaches the peak in the 10th period. Bloom (2009) analyzes the CPI as an impact response function. As a result, US EPU shock indicates that the consumer price declines to 5% due to the rapid economic downturn, economic instability, and decreased consumer demand. The HPPI declined after the impact of US EPU index, but it went up to the 4th month, shifted to the positive, climbed to the peak of the 6th month, then dropped again, and turned negative to the 12th month. The HLPI also moves to the same type of trend as HPPI. The BSI began to decline to negative from the beginning of the US EPU shock and continued to decline over time. CSI and DSI have a trend like BSI. The CLI began to decline to negative from the beginning to the US EPU shock and was raised to the lowest point in the 14th month.
4.5.2. Impulse response for China EPU index
In detail, the CPI drops to the 2nd month after the shock to the China EPU index and rises to the 4th month again.
And then down again to reach the lowest point by the 8th month. The HPPI rose in the early stage after the impact of the China EPU index, then fell to the negative as it entered the 3rd month, reached the lowest point in the 5th month, and then rose again. HLPI also moves to the same type of
trend as HPPI. BSI and CSI rose in volume at the beginning and then repeatedly rising and falling from the 2nd month, eventually dropping to negative. The DSI declined in the early period, then rose from the 2nd month, changed into positive period in the 4th month, and repeatedly ascending and descending, but eventually declined to negative level in the 19th month. The CLI initially fell to negative, then switched to positive at the 4th period, and then dropped to its peak at the 12th month.
4.5.3. Comparison of Impulse response for EPU indexes in the US and China
To measure the responses of the shocks proposed by Sims (1980), we find that the US EPU index proceeds in negative direction for all economic variables in Korea initially through the impact response coefficient. On the other hand, China EPU index is initially positive in the direction of HPPI, BSI, and CSI, and CPI, HLPI, DSI and CLI are initially positive.
5. Conclusions 5.1. Summary
We document the effect of EPU in the US and China on the macroeconomics such as stock price, housing price in Korea with monthly data from January 1995 to December
all Korean economic index variables except CLI. China EPU index had a causal relationship to all Korean economic index variables. In the result of VECM, the distribution stock index of all variables in Korea is the most influential variable by the EPU index of the US as Jeon et al. (2017) examine the distribution industry is strongly affected by the national economic policy.
The Granger causality test showed that the EPU indexes of the US and China had a significant causal relationship to the Korean economy. Also, through the VECM, the US EPU index has a significant negative relationship to all Korean economic indices except CLI. On the other hand, in China EPU index, only the CLI of all Korean economic indices has a significant negative relationship. We also used impact response coefficients to analyze the impact of the shocks proposed by Sims (1980) through EPU in the US and China. The US EPU index is initially negative for all economic variables in Korea. On the other hand, China EPU index is initially positive in the direction of HPPI, BSI, and CSI, and CPI, HLPI, DSI, and CLI are initially positive.
5.2. Implications
We investigate the spillover of EPU in the US and China on the Korean economy using the EPU index. First, the housing and stock market in Korea is more affected by the US than China. One reason is related to the EPU of the US government. For example, in 2008 the Korean housing market to deteriorate due to the global financial crisis. We find that the EPU of the world is reflected in the housing and stock market of the country. This study differs from the existing research as follows.
First, this study shows whether the EPU indexes of the US and China has the relationships on the housing and stock market economy in Korea through the empirical analysis. Second, this study has an empirical evidence that the housing and stock market in Korea is influenced by the EPU index of the US rather than it of China. If we study the trend of the global EPU indexes carefully, it may be used to make a strategy and set up on economic policy of corporate and government as the important source.
120(1), 87–92.
Antonakakis, N., Gupta, R., & Andre, C. (2015). Dynamic co-movements between economic policy uncertainty and housing market returns. Journal of Real Estate Portfolio Management, 21(1), 53-60.
Baffoe-Bonnie, J. (1998). The Dynamic impact of macroeconomic aggregates on housing prices and stock of houses: A national and regional analysis.
Journal of Real Estate Finance and Economics, 17(2), 179-197.
Baker, S. R., Bloom, N., & Davis, S. J. (2016).
Measuring economic policy uncertainty, Quarterly Journal of Economics, 131(4), 1593-1636.
Benjamin, J., Chinloy, P., & Jud, G.D. (2004). Real estate versus financial wealth in consumption. Journal of Real Estate Finance and Economics, 29(3), 341–354.
Bloom, N. (2009). The impact of uncertainty shocks.
Econometrica, 77(3), 623-685.
Canes-Wrone, B., & Park, J. K. (2012). Elections, uncertainty and irreversible investment. British Journal of Political Science, 44(1), 83-106.
Granger, C. W. J. (1980). Testing for causality: A personal viewpoint. Journal of Economic Dynamics and Control, 2(4), 329-352.
Granger, C. W. J. (1981). Some properties of time series data and their use in econometric model specification.
Journal of Econometrics, 16(1), 121-130.
Granger, C. W. J., & Newbold, P. (1974). Spurious regression in econometrics. Journal of Econometrics, 2(1), 111-120.
Jeon, J., Lee, H., & Lee, C. (2017). Economic policy uncertainty and Korean economy: Focusing on distribution industry stock market. Journal of Distribution Science, 15(12), 41-51.
Jeon, J. (2018). The impact of Asian economic policy uncertainty: Evidence from Korean housing market.
Journal of Asian Finance, Economics and Business, 5(2), 43-51.
Jeong, D. (2017). Forecasting for a credit loan from households in South Korea. International Journal of Industrial Distribution & Business, 8(4), 15-21.
Johansen, S. (1988). Statistical analysis of cointegration vectors. Journal of Economic Dynamics and Control, 12(1), 231–254.
Kilian, L., & Murphy, D. P. (2014). The role of inventories
and speculative trading in the global market for crude oil. Journal of Applied Econometrics, 29(3), 454-478.
Leung, C. (2004). Macroeconomics and housing: A review of the literature. Journal of Housing Economics, 13(4), 249-267.
Liu, L., & Zhang, T. (2015). Economic policy uncertainty and stock market volatility. Finance Research Letters, 15(1), 99-105.
Meen, G. (2002). The time-series behavior of house prices: A transatlantic divide?. Journal of Housing Economics, 11(1), 1-23.
Mian, A., & Sufi, A. (2014). What explains the 2007–2009 drop in employment?. Econometrica, 82(6), 3197-2223.
Muellbauer, J. (2015). Housing and the macroeconomy:
inflation and the financial accelerator. Journal of Money, Credit and Banking, 47(1), 51-58.
Ngene, G. M., Sohn, D. P., & Hassan, M. K. (2017).
Time-varying and spatial herding behavior in the US housing market: Evidence from direct housing prices.
Journal of Real Estate Finance and Economics, 54(4), 482-514.
Sims, C. (1980). Macroeconomics and reality, Econometrica,
48(1), 1-48.
Sung, Y. A., Choe, H., & Kim, S. Y. (2014). Changes in consumption expenditure pattern during 1990-2010: A look through CPI. Journal of Consumption Culture, 17(4), 223-252.
Wang, P & Kim, J. (2014). The value of reverse mortgage loans: Case study of the Chinese market.
Journal of Asian Finance, Economics and Business, 1(4), 5-13.
Yu, H., Lee, S. (2010). Government housing policies and housing market instability in Korea. Habitat International, 34(2), 145-153.
Zhang, H., Li, S., & Kong, Y. (2016). Elasticity of demand for urban housing in western China based on micro-data – A case study of kunming. International Journal of Industrial Distribution & Business, 7(3), 27-36.
Zheng, S., Sun, W., & Kahn, M. E. (2016). Investor confidence as a determinant of China’s urban housing market dynamics. Real Estate Economics, 44(4), 814-845.