가뭄사상 및 농업수리시설물이 쌀 생산량에 미치는 영향에 대한 상관 분석
On the Linkage Between Irrigation Facilities and Rice Production Under Drought Events
우승범
aㆍ남원호
b,†ㆍ전민기
cㆍ윤동현
dㆍ김태곤
eㆍ성재훈
fㆍ김한중
gWoo, Seung-BeomㆍNam, Won-HoㆍJeon, Min-GiㆍYoon, Dong-HyunㆍKim, TaegonㆍSung, Jae-HoonㆍKim, Han-Joong
ABSTRACT
Drought is a disaster that causes prolonged and wide scale damage. Recently, the severity and frequency of drought occurrences, and drought damage have been increased significantly due to climate change. As a result, a quantitative study of drought factors is needed to better understand and prevent future droughts. In the case of agricultural drought, several existing studies examine the economic damage caused by droughts and their causes, but these studies are not well suited to estimating crop-oriented agricultural drought damage and the factors that absolutely affect agricultural drought. This study determines which factors most affect agricultural drought. It examines meteorological factors and those related to agricultural water supplied by irrigation facilities. Rice paddy production per unit area is lower than the average from the last two years where agricultural drought occurred. We compare the relative frequency of agricultural drought impacts with irrigation facilities, effective reservoir storage, the number of water supply facilities, and the meteorological drought index such as Standardized Precipitation Index (SPI). To identify factors that affect agricultural drought, we correlate rice paddy production anomalies with irrigation water supply for the past two years. There was a high positive correlation between rice paddy production and irrigation water usage, and there was a low or moderate negative correlation between rice paddy production anomalies compared to the average of the past two years and SPI. As a result, agricultural water supply by irrigation facilities was judged to be more influential than meteorological factors in rice paddy production. This study is expected to help local governments establish policies related to agricultural drought response.
Keywords: Irrigation facilities; drought damage; drought index; agricultural water supply; rice production; SPI (Standardized Precipitation Index)
Ⅰ. 서 론
최근 기후변화로 인해 가뭄의 규모 및 발생 빈도가 증가하
고 있으며, 1994∼1995년, 2000∼2001년 전국적으로 발생했 던 가뭄 상황과 달리 2010년 이후의 가뭄은 지역별로 편중되 어 내리는 강수 때문에 국소적으로 발생하고 있다 (Bae et al., 2015). 특히, 2011년부터 2018년까지 연속적으로 국지적인 가 뭄이 발생하였고, 2017년에는 경기, 충남, 전남지역을 중심으 로 극심한 가뭄이 발생하였다 (Bang et al., 2018). 가뭄은 재해 특성상 장기적이고 광역적인 피해를 입히며 시작 시기 및 발 생 지역 판단의 기준이 명확하지 않기 때문에 가뭄에 따른 피 해 지역 및 가뭄의 정량적 피해산정이 어렵다 (Kim et al., 2013).
일반적으로 가뭄의 영향 및 심도 분석에는 다양한 가뭄지 수들을 사용하며, 강수량 기반의 표준강수지수 (Standardized Precipitation Index, SPI), 강수량과 증발산을 기반으로 한 표 준강수증발산지수 (Standardized Precipitation Evapotranspiration Index, SPEI), 유효토양수분량과 강수량에 근거한 파머가뭄심 도지수 (Parmer Drought Severity Index, PDSI), 강수평년비 (Percent of Normal precipitation, PN), 토양수분지수 (Soil Moisture Index, SMI) 등이 있으며 (Yoon et al., 2018; Lee et al., 2020), 저수지 가뭄지수 (Reservoir Drought Index, RDI) 등의 가뭄지수가 사용되고 있다 (Nam et al., 2015). 이러한 가뭄지수들은 일정한 수치로 정량화되어 가뭄의 심도에 대해 파악할 수 있다는 장점이 있다.
과거 가뭄지수를 적용한 가뭄 모니터링 및 전망을 위한 연
aGraduate Student, School of Social Safety and Systems Engineering, Hankyong National University, Anseong, Republic of Korea
b Associate Professor, School of Social Safety and Systems Engineering, Institute of Agricultural Environmental Science, National Agricultural Water Research Center, Hankyong National University, Anseong, Republic of Korea
c Ph.D. Student, Department of Convergence of Information and Communication Engineering, Hankyong National University, Anseong, Republic of Korea
d Ph.D. Student, Department of Convergence of Information and Communication Engineering, Hankyong National University, Anseong, Republic of Korea
e Assistant Professor, Department of Smart Farm, Jeonbuk National University, Jeonju, Republic of Korea
f Research Fellow, Korea Rural Economic Institute, Naju, Republic of Korea
g Professor, School of Social Safety and Systems Engineering, Hankyong National University, Anseong, Republic of Korea
† Corresponding author
Tel.: +82-31-670-5137, Fax: +82-31-670-5139 E-mail: [email protected]
Received: June 25, 2021 Revised: September 23, 2021 Accepted: September 27, 2021
구는 많이 수행되었지만, 가뭄피해 평가의 기준이나 피해 평 가 사례연구는 부족한 실정이다. 농업가뭄의 피해 분석 연구 의 경우 가뭄 피해 통계자료를 기반으로 가뭄피해액을 산정 하여 농업가뭄의 경제적 피해를 분석하였다 (Seo et al., 2009;
Ryu et al., 2011; KREI, 2016; Sung and Chae, 2018). 또한 가뭄특성인자를 기반으로 가뭄피해추정 기법을 개발하였으 며 (So et al., 2015), 배추의 연도별 단위면적당 생산량 자료를 활용하여 가뭄 리질리언스 평가 연구 (Kang et al., 2015), 기상 학적 인자, 농업용수공급, 사회⋅환경 영향 및 가뭄대응능력 기반 농업가뭄 취약성 지표를 개발하여 농업가뭄을 판단하는 연구 (Mun et al., 2020) 등 가뭄과 관련된 인자 및 가뭄지수를 활용하여 가뭄 피해를 정량화하려는 연구가 수행된 바 있다.
또한 가뭄 효과를 추정하기 위해서 기상요소 및 수리답 비율 등이 식량작물 생산성에 미치는 효과를 회귀분석 모형을 통 해 추정하였다 (Lee et al., 2013; Jang et al., 2015; Sung et al., 2017; Myeong, 2018).
농업가뭄은 토양수분의 감소 및 농업용 저수지의 저수량 저 하로 인해 수확량 및 농작물 생육이 영향을 받는 것으로 기상⋅
수문학적 가뭄에 의한 영향도 고려하여 정의된다 (Nam et al., 2018; Lee et al., 2019). 우리나라의 경우 과거 가뭄의 피해를 최소 화하고 안정적인 농업 생산을 유지하기 위하여 경지정리사업, 농촌용수개발사업 등 농업생산기반정비사업을 추진해왔다. 하 지만, 강수부족으로 기상, 수문학적 가뭄이 발생한다고 하더 라도 주수원공인 농업용 저수지, 농업수리시설물에 의한 농업
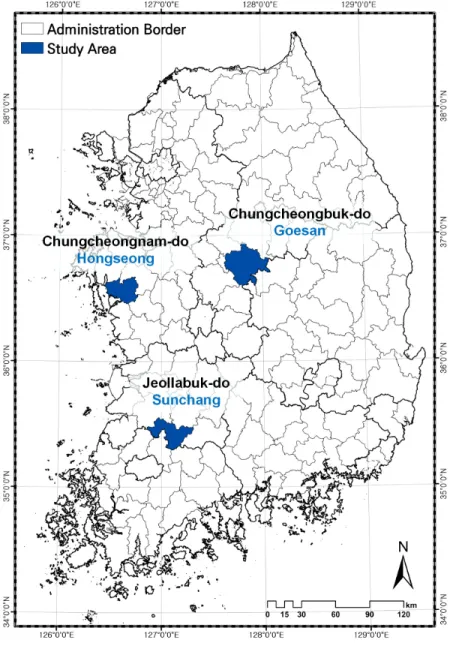
Fig. 1 Location of three study areas and reservoirs
용수 공급이 가능하고, 양수장, 관정 등 보조수원공에 의한 농 업용수 공급의 형태가 다양하기 때문에, 실제로 농업현장에 서 체감하는 농업가뭄피해는 시공간적으로 상이하다 (Nam et al., 2013). 따라서, 강수 부족으로 인한 가뭄사상의 발생에 따 른 수문기상학적 특성 및 시공간적인 분포 특성과 농업가뭄피 해의 발생 현황, 농업용 저수지의 저수율 변화 및 농업용수 이 용과의 관계는 향후 가뭄의 취약지역 분석, 가뭄의 지역별 가 뭄대책 수립에 중요한 기초자료로 활용할 수 있다.
본 연구에서는 농업가뭄에 대하여 농업수리시설물이 논 가뭄 피해에 미치는 영향을 분석하기 위하여, 쌀 생산량 및 농업용 저수지와 보조수원공, 유효저수량 등의 영향인자를 활용한 가 뭄사상의 수문기상학적 특성간의 상관성을 분석하고자 한다.
Ⅱ. 연구 재료 및 방법
1. 연구 대상 지역 및 자료 구축
본 연구에서는 쌀 생산량을 기준으로 농업가뭄 관련 인자 들을 비교 및 분석하였다. 단위면적당 쌀 생산량 자료는 Fig.
1, Table 1에 도시한 바와 같이 통계청 산하 국가통계포털 (KOrean Statistical Information Service, KOSIS)에서 제공하는 8개 시도 및 3개 시범지구 (순창, 홍성, 괴산) 자료를 수집하였 다. 농업가뭄 관련인자로 농업용 저수지의 농업용수 이용량, 기상학적 가뭄지수인 SPI, 농업수리시설물 자료를 선정하였 다. 농업용 저수지의 농업용수 이용량은 수자원장기종합계획 에서 제공하는 자료를 활용하였으며, SPI는 기상청 종관기상 관측장비 (Automated Surface Observing Service, ASOS)의 일
강수량 자료를 수집하여 구축하였으며, 농업수리시설물은 수 혜면적, 저수지, 양수장 및 배수장 개소수 자료를 수집하였다.
농업수리시설물 제원의 경우 KOSIS 통계자료와 한국농어촌 공사 농촌용수종합정보시스템 (Rural Agricultural Water Resource Information System, RAWRIS)에서 제공하는 농업생 산기반정비통계연보에서 수집하였다.
2. 연구방법
가. 쌀 생산량과 농업가뭄과의 상관성 분석
본 연구에서는 쌀 생산량을 기준으로 농업가뭄을 평가하기 위해 연도별 단위면적당 쌀 생산량 자료를 활용하였다. 농업 기술의 발달로 2000년에서 2016년 사이 단위면적당 쌀 생산 량이 과거 대비 크게 증가하여, 전체 연구기간의 평균 단위면 적당 쌀 생산량을 기준으로 아노말리를 측정할 경우, 많은 과 거 연도에서 아노말리가 음수로 산출되는 한계가 있다. 따라 서 과거 2년간 평균 단위면적당 쌀 생산량을 기준으로 활용하 여 오차를 줄이고자 하였으며, 과거 2년간의 단위면적당 쌀 생산량 평균과 당해연도의 단위면적당 쌀 생산량의 차를 아 노말리로 정의하였다. 아노말리가 음수인 경우를 농업가뭄이 발생한 해로 정의하였다. 전국 총 쌀 생산량 및 쌀 재배면적의 경우 1987년 이후로 지속적으로 감소하고 있으나, 전국 단위 면적당 쌀 생산량의 경우 Fig. 2에서 보는 바와 같이 증감을 반복하는 추세를 보였다. 농업수리시설물 중 주수원공인 농
Region City Effective reservoir storage (104m3) Irrigated area (ha) Number of pumping stations
Chungcheongbuk-do Goesan 1,465 2,123 22
Chungcheongnam-do Hongseong 1,036 3,879 30
Jeollabuk-do Sunchang 1,240 3,230 44
Table 2 Irrigation facilities in the three study areas
Material type Materials
Agricultural factor Paddy rice production per 10a
Agricultural and hydrological facilities
Irrigation water usage Irrigated area Number of reservoirs Number of pumping stations Meteorological factor Daily precipitation
Table 1 Input variables associated with agricultural drought damage
Fig. 2 Annual rice paddy production per irrigated area during 2000-2017
업용 저수지의 경우 Fig. 3과 같이 저수지 갯수와 유효저수량 모두 전라남도 지역이 가장 높았으며, 강원도 지역에서 가장 낮은 경향을 보였다.
2000년에서 2017년까지 18년간 단위면적당 쌀 생산량과 논용수 이용량을 상관분석하였으며, 농업수리시설물에 의해
제공되는 논용수 이용량과 기상학적 인자의 가뭄 영향성을 분석하였다. 농업용 저수지 유효저수량, 농업수리시설물 수 혜면적, 양수장 개소수 등 시범지구별 농업수리시설물 제원 에 따른 농업가뭄의 발생빈도를 비교하여 농업수리시설물 제 원에 따른 농업가뭄 영향성을 파악하고자 한다. 연구흐름도 는 Fig. 4와 같다.
나. 표준강수지수 (Standardized Precipitation Index, SPI) SPI는 강수량의 변동만으로 가뭄사상을 평가하기 때문에 기상학적 가뭄을 판단할 때 대표적으로 사용되는 가뭄지수이 다 (Mckee et al., 1993). SPI는 측정 기간에 대한 누가강수시계 열을 구성 후 누가된 월수로 나누어 이동 평균 강수 계열을 표현한다. 적정확률분포형을 산출하여 각 변량의 누가확률을 계산 후 표준정규분포에 적용하여 심도를 표현한다. 시간척 도의 경우 3, 6, 9, 12개월을 일반적으로 사용하며 시간단위별 강수 부족량을 산출하여 용수공급원이 가뭄에 미치는 영향을 산출한다 (Edwards and Mckee, 1997). SPI의 산정 방법은 식 (1)∼(4)와 같으며, SPI 값에 따른 가뭄 심도는 Table 3과 같이 양의 방향으로 절댓값이 클수록 습윤상태, 음의 방향으로 절 댓값이 클수록 가뭄상태를 나타낸다. 본 연구에서는 농업가 뭄에 활용할 수 있는 단기 SPI (6개월 SPI, 이하 SPI6)를 사용
Fig. 4 Flow chart of correlation analysis between agricultural drought factors and meteorological and hydrological factors
Fig. 3 Relationship between total effective reservoir storage and the number of reservoirs (GG : Gyeonggi-do, GW : Gangwon-do, CB : Chungcheongbuk-do, CN : Chungcheongnam-do, JB : Jeollabuk- do, JN : Jeollanam-do, GB : Gyeongsangbuk-do, GN : Gyeongsangnam-do)
하였으며, 관개기 (4∼9월) 강수량에 대한 SPI를 산정하기 위 해 4∼9월의 강수량을 반영하는 10월 SPI를 활용하였다.
for ≤ (1)
for ≤ (2)
ln for ≤ (3)
ln for ≤ (4)
여기서, H(x)는 누가확률, G(x)는 Gamma 함수, m은 무강우 일수, n은 강수관측일수를 의미한다.
SPI value Class
Greater than 2.0 Extremely wet
1.5 to 2.0 Severely wet
1.0 to 1.5 Moderately wet
-1.0 to 1.0 Near normal
-1 to –1.5 Moderately dry
-1.5 to –2.0 Severely dry
Less than –2.0 Extremely dry
Table 3 Classification of drought index of SPI (Mckee et al., 1993)
다. 피어슨 상관분석
쌀 생산량 기반 농업가뭄 평가 시기와 농업가뭄 관련인자 의 상관성 분석을 위하여 피어슨 상관계수를 활용하였다. 피 어슨 상관분석 (Pearson’s correlation analysis)은 연속 변수로 측정된 두 변수간의 선형 관계를 분석하는 기법으로, Table 4에 도시한 바 같이 상관분석 결과로 나타난 상관계수에 따라 두 변수 사이의 상관성을 파악할 수 있다 (Jung et al., 2019).
본 연구에서는 농업가뭄과 수문학적 인자, 그리고 기상학적 인자와의 관계를 분석하기 위해, 농업가뭄과 농업수리시설물, 그리고 기상학적 가뭄지수와의 상관성 분석을 실시하였다.
앞서 언급하였듯이 본 연구에서는 농업가뭄으로 당해 쌀 생
산량과 과거 2년 평균대비 당해 연도의 단위면적당 쌀 생산량 아노말리를 이용하였으며, 기상학적 가뭄 지수는 10월 SPI6 을 이용하였다.
Ⅲ. 연구결과
1. 지역 단위 농업가뭄 영향 및 피해 분석
가. 농업수리시설물과 기상학적 가뭄인자에 따른 농업가뭄 영향 및 피해 분석
극심한 가뭄이 발생했었던 2010년, 2017년의 가뭄사상을 기준으로 농업수리시설물과 기상학적 요소의 상관성을 분석 하기 위하여 2010년, 2017년에 대한 과거 2년 평균대비 단위 면적당 쌀 생산량 아노말리, 2017년의 농어촌공사 관리 저수 지 수, 10월 SPI6를 시도 단위로 산정하였다.
Fig. 5, Fig. 6은 2010년, 2017년 가뭄사상을 기준으로 지역
Correlation interval (absolute value) Correlation strength
0 to 0.2 Very low
0.2 to 0.4 Low
0.4 to 0.6 Middle
0.6 to 0.8 Strong
0.8 to 1.0 Very strong
Table 4 Linear relationship of the Pearson’s correlation coefficient ranges
Fig. 5 Regional rice paddy production anomalies in (a) 2010 and (b) 2017
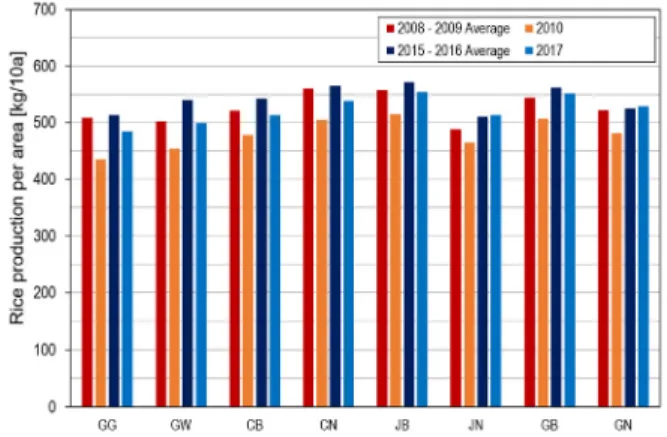
Fig. 6 Comparison of regional rice paddy production in 2010, 2017, and past 2years average
별 단위면적당 쌀 생산량의 과거 2년 평균대비 감소율을 나타 낸 것으로 2010년의 경우 경기도에서 16.90%, 강원도에서 10.68%, 충청북도에서 10.89%, 충청남도에서 9.00%, 전라북 도에서 8.25%, 전라남도에서 4.95%, 경상북도에서 7.20%, 경 상남도에서 8.52%로 나타나 경기도의 감소율이 가장 크게 나 타났다. 2017년의 경우 전라남도에서 0.49%, 경상남도에서 0.76%의 미세한 증가율을 보였으나 경기도에서 5.99%, 강원 도에서 8.22%, 충청북도에서 5.65%, 충청남도에서 5.02%, 전 라북도에서 3.16%, 경상북도에서 1.72%의 감소율을 보여 강 원도에서 가장 큰 감소율을 보였으며, 2010년은 모든 시도에 서, 2017년은 6개 시도에서 과거 대비 쌀 생산량의 감소가 나타났다.
극심한 가뭄이 발생하였던 2017년을 기준으로 전국 8개 시 도의 쌀 생산량 아노말리에 따른 10월 SPI6와 저수지 수의 경향성을 분석하였으며 수집한 자료를 Table 5에 도시하였고, 분석결과는 Fig. 7과 같다. Fig. 7에 도시한 바와 같이, 과거 2년 대비 2017년 단위면적당 쌀 생산량 아노말리와 2017년 10월 SPI6의 결정계수는 0.683, 농어촌공사 관리 저수지 개수 의 결정계수는 0.812를 보였다. 단위면적당 쌀 생산량 아노말
리와 10월 SPI6 사이에는 음의 상관관계가 나타났으며, 단위 면적당 쌀 생산량과 저수지 수 사이에는 양의 상관관계가 나 타났다. 따라서, 농업가뭄 및 농업가뭄피해에 대하여 기상학 적 인자보다 농업수리시설물이 밀접한 인자로 판단된다.
나. 논용수 이용량과 기상학적 가뭄인자에 따른 농업가뭄 영향 및 피해 분석
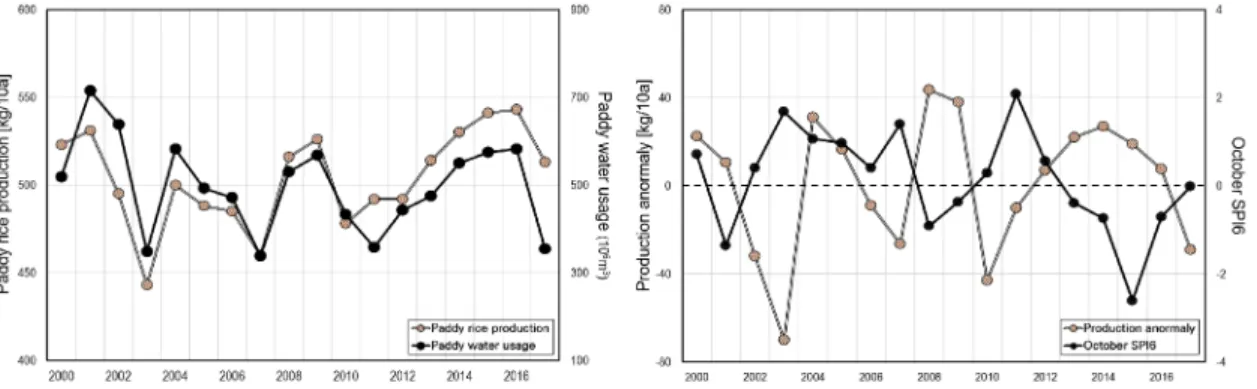
2000년에서 2017년 기간의 연도별 시도단위 자료를 활용 하여 과거 2년 평균대비 단위면적당 쌀 생산량 아노말리와 당해연도 10월 SPI6를 상관분석하였으며, 단위면적당 쌀 생 산량과 논용수 이용량 사이의 상관분석을 수행하였다. Figs.
8∼10은 충청북도, 충청남도, 전라북도의 단위면적당 쌀 생산 량과 논용수 이용량 사이의 상관분석 및 동일지역의 과거 2년 대비 단위면적당 쌀 생산량 아노말리와 SPI6 사이의 상관분 석 결과를 도시한 것이다.
전국 8개도의 상관분석을 시행한 결과 경기도에서는 단위 면적당 쌀 생산량과 논용수 이용량 간에 상관계수 0.523의 양 의 상관성을 보였으며, 과거 2년 평균대비 단위면적당 쌀 생 산량 아노말리와 10월 SPI6 사이에서는 –0.488의 상관계수를 보이며 음의 상관성이 나타났다. 충청북도의 경우 단위면적 Region Number of reservoirs Rice production per 10a (kg/10a) October SPI6
Gyeonggi-do 096 484 -0.1
Gangwon-do 078 499 -0.3
Chungcheongbuk-do 184 513 -0.0
Chungcheongnam-do 225 538 -0.5
Gyeongsangbuk-do 420 554 -1.1
Gyeongsangnam-do 996 513 -1.0
Jeollabuk-do 655 552 -0.7
Jeollanam-do 563 529 -1.4
Table 5 Regional number of reservoirs, rice paddy production per 10a and October SPI6 in 2017
Fig. 7 Correlation analysis of rice paddy production anomalies and drought factors, such as the number of reservoirs and SPI
Region Correlation coefficient Irrigation water usage October SPI6
Gyeonggi-do 0.523 -0.488
Gangwon-do 0.473 -0.490
Chungcheongbuk-do 0.670 -0.474
Chungcheongnam-do 0.735 -0.378
Jeollabuk-do 0.688 -0.471
Jeollanam-do 0.541 -0.527
Gyeongsangbuk-do 0.621 -0.537
Gyeongsangnam-do 0.602 -0.646
Table 6 Correlation coefficient between paddy rice production per 10a and irrigation water usage and SPI
당 쌀 생산량과 논용수 이용량 사이 상관계수가 0.670으로 다 소 높은 양의 상관성을 보였으며, 과거 2년 평균대비 단위면 적당 쌀 생산량 아노말리와 10월 SPI6 사이에서는 상관계수 –0.474로 음의 상관성을 보였다. 충청남도에서는 단위면적당 쌀 생산량과 논용수 이용량 사이 0.735의 상관계수로 높은 상 관성을 보였으며, 단위면적당 쌀 생산량 아노말리와 10월 SPI6와는 –0.378의 상관계수로 낮은 음의 상관성을 보였다.
단위면적당 쌀 생산량과 논용수 이용량의 상관성이 가장 큰 곳은 상관계수 0.735로 충청남도였으며, 10월 SPI6와 가장 상
관성이 큰 곳은 상관계수 –0.646으로 경상남도였다.
전국 8개 시도에서 단위면적당 쌀 생산량과 논용수 이용량 사이에 전반적으로 보통 수준의 양의 상관성 혹은 높은 양의 상관성을 나타냈으며, 단위면적당 쌀 생산량 과거 2년 평균대 비 아노말리와 10월 SPI6 사이에서는 전반적으로 보통 수준 의 음의 상관성을 보였다. 이 결과는 기상학적 가뭄의 발생에 도 농업수리시설물에서 공급되는 농업용수의 영향으로 단위 면적당 쌀 생산량이 높게 나타난 것으로 판단된다.
Fig. 8 Comparison of paddy rice production and irrigation water usage, SPI for Chungcheongbuk-do
Fig. 9 Comparison of paddy rice production and irrigation water usage, SPI for Chungcheongnam-do
Fig. 10 Comparison of paddy rice production and irrigation water usage, SPI for Jeollabuk-do
2. 상관분석을 통한 시범지구 농업가뭄 영향 및 피해 분석
시군단위 가뭄사상의 수문기상학적 특성간의 분석을 위해 가뭄피해가 많았던 충청북도, 충청남도와 저수지당 유효저수 량이 가장 높았던 전라북도에서 각각 한 시군구를 시범지구로 선정하였다. Table 7과 Figs. 11∼13는 충청북도 괴산군, 충청 남도 홍성군, 전라북도 순창군의 단위면적당 쌀 생산량과 논 용수 이용량 사이의 상관분석 및 동일지역의 과거 2년 대비 단위면적당 쌀 생산량 아노말리와 SPI6 사이의 상관분석 결 과를 도시한 것이다.
충청북도 괴산군에서는 단위면적당 쌀 생산량과 논용수 이
Study area Correlation coefficient Irrigation water usage October SPI6
Goesan 0.729 -0.411
Hongseong 0.813 -0.534
Sunchang 0.689 -0.448
Table 7 Correlation coefficient between paddy rice production per 10a and irrigation water usage and between paddy rice production anomaly and SPI
Fig. 11 Comparison of paddy rice production and irrigation water usage, SPI for Goesan, Chungcheongbuk-do
Fig. 12 Comparison of paddy rice production and irrigation water usage, SPI for Hongseong, Chungcheongnam-do
Fig. 13 Comparison of paddy rice production and irrigation water usage, SPI for Sunchang, Jeollabuk-do
용량 사이에 0.729의 상관계수로 높은 상관성을 보였으며, 과 거 2년 평균대비 단위면적당 쌀 생산량 아노말리와 10월 SPI6 사이에서는 –0.411의 상관계수로 음의 상관성을 보였다. 충청 남도 홍성군의 상관분석 결과, 단위면적당 쌀 생산량과 논용 수 이용량 사이에 상관계수 0.813의 강한 상관성을 보였다.
과거 2년 대비 단위면적당 쌀 생산량 아노말리와 10월 SPI6 사이에서는 –0.534의 음의 상관성을 보였다. 전라북도 순창군 의 상관분석 결과, 단위면적당 쌀 생산량과 논용수 이용량 사 이에서 상관계수 0.689의 다소 높은 양의 상관성을 보였으며, 과거 2년 대비 단위면적당 쌀 생산량 아노말리와 10월 SPI6사 이에 상관계수 –0.448의 음의 상관성을 보였다. 시범지구 분 석결과 단위면적당 쌀 생산량과 논용수 이용량의 상관관계는 높은 양의 상관성을 보였으며, 단위면적당 쌀 생산량과 10월 SPI6의 상관관계는 낮거나 보통의 음의 상관성을 보였다. 이 결과는 단위면적당 쌀 생산량에 있어 SPI6보다 논용수 이용 량이 더 큰 영향을 주는 인자로 사료된다.
Ⅳ. 결 론
본 연구에서는 농업가뭄에 대하여 정량적인 가뭄피해 분석 및 가뭄사상에 대한 농업수리시설물이 논 가뭄 피해 및 쌀 생 산성에 미치는 영향을 분석하였다. 전국 8개 시도 및 충청북도 괴산군, 충청남도 홍성군, 전라북도 순창군을 시범지구로 선 정하여 지역별 가뭄발생면적 및 쌀 생산량과 농업용 저수지와 보조수원공, 유효저수량 등의 영향인자를 활용한 가뭄사상의 수문기상학적 특성간의 상관성을 분석하였다.
농업용수 이용량과 강수량의 농업가뭄 영향을 분석하기 위 해 2000년부터 2017년 시도단위 연도별 단위면적당 쌀 생산 량과 논용수 이용량을 상관분석 하였으며, 과거 2년 평균대비 단위면적당 쌀 생산량 아노말리와 당해연도 10월 SPI6를 상 관분석 하였다. 상관분석 결과, 전국 8개 시도 중 6개 시도에 서 단위면적당 쌀 생산량 아노말리와 10월 SPI6 사이 상관성 보다 단위면적당 쌀 생산량과 논용수 이용량 사이 상관성이 큰 것으로 나타났다. 시범지구 농업가뭄 상관분석의 경우, 단 위면적당 쌀 생산량과 논용수 이용량 사이 상관계수가 충북 괴산군에서 0.729, 충남 홍성군에서 0.813, 전북 순천시에서 0.689의 높은 양의 상관성이 나타났으며, 단위면적당 쌀 생산 량 아노말리와 10월 SPI6 사이의 상관계수는 충북 괴산군에 서 –0.411, 충남 홍성군에서 –0.534, 전북 순창군에서 –0.448의 음의 비교적 보통의 상관성을 나타냈다. 2017년 시도별 쌀 생 산량 아노말리에 따른 저수지 수 및 10월 SPI6의 경향성 분석 결과, 쌀 생산량 아노말리와 10월 SPI6보다 농업용 저수지 갯 수 사이에 더 높은 결정계수를 보였다. 이는 자연적으로 주어
지는 기상학적 인자보다 가뭄에 대응하기 위해 구축된 농업 용수인프라, 즉, 농업수리시설물에서 공급되는 논용수 이용 량 및 농어촌공사 관할 저수지 갯수가 농업가뭄에 더 큰 상관 성을 보이는 것으로 판단된다.
또한 전국 8개 시도 및 시범지구를 대상으로 한 관개기 강 수량에 영향을 나타내는 기상학적 인자 10월 SPI6와 단위면적 당 쌀 생산량과의 상관관계 분석 결과, 두 인자는 보통 혹은 낮은 음의 상관성이 있는 것으로 나타났다. 이에 반해 농업수 리시설물에 의한 논용수 이용량과 단위면적당 쌀 생산량 간 상관성은 보통 혹은 높거나 매우 높은 양의 상관성을 보였다.
본 연구의 결과는 농업수리시설물이 논 가뭄 피해에 미치는 영향뿐만 아니라, 단위면적당 쌀 생산량에도 기상학적 인자보 다 더 큰 영향을 미치는 것을 나타낸다. 이러한 본 연구의 결과 는 기상인자가 관개농업에 미치는 영향과 천수농업에 미치는 영향이 상이하다는 문헌의 결과와도 일치한다. (Schlenker et al., 2005, 2009; Dell et al., 2014; Burke and Emerick 2016).
실제 가뭄사상이 발생하면, 농업수리시설물에 의한 농업용 수 공급이 이루어지고, 정부의 선제적 가뭄대책으로 양수저류, 관정 등 다양한 대책들이 사전에 가동되기 때문에 기상학적 가뭄지표인 SPI와 쌀 생산성 간의 상관성을 직접적으로 설명 하기 어려운 한계가 있다. 기상학적으로 가뭄인 상태에도 원 활한 가뭄대응으로 쌀 생산성 저하를 최소화하였고, 반대로 가뭄기간동안 풍부한 일조시간을 바탕으로 생산성이 증가하 는 것으로 사료된다. 농산물 생산성은 가뭄이라는 환경적인 요인뿐만 아니라, 농업수리시설물의 대응역량을 동시에 고려 해야 한다. 최근 가뭄사상에 대한 재해대비 효과, 농촌용수개 발사업, 농업생산기반정비사업의 효과 등 농업수리시설물에 대한 가치 평가가 이루어지고 있는 시점에서 향후 농업수리시 설물의 수요량과 실제 공급량, 이수안전도, 한발대비 수리답 면적 등 추가적인 후속 연구가 필요할 것으로 사료된다.
감사의 글
본 연구는 행정안전부 극한재난대응기반기술개발사업의 연구비 지원 (2019-MOIS31-010)에 의해 수행되었습니다.
REFERENCES
1. Bae, D. H., J. M. So, and S. H. Kim, 2015. 2015 drought analysis and countermeasures. Korea Disaster Prevention Association 17(4): 14-22 (in Korean).
2. Bang, N. K., W. H. Nam, E. M. Hong, M. J. Hayes, and
M. D. Svoboda, 2018. Assessment of the meteorological characteristics and statistical drought frequency for the extreme 2017 spring drought event across South Korea.
Journal of the Korean Society of Agricultural Engineers 60(4): 37-48 (in Korean). doi:10.5389/KSAE.2018.60.4.
037.
3. Burke, M., and K. Emerick, 2016. Adaptation to climate change: Evidence from US agriculture, American Economic Journal: Economic Policy 8(3): 106-140.
4. Chang, Y. J., J. W. Lee, J. K. Park, and H. J. Park, 2015.
Study on effects of meteorological elements in the grain production of Korea. Journal of Environmental Science International 24(3): 281-290. (in Korean). doi:10.5322/
JESI.2015.24.3.281.
5. Dell, M., B. F. Jones, and B. A. Olken, 2014. What do we learn from the weather? The new climate-economy literature. Journal of Economic Literature 52(3): 740-798.
6. Edward, D. C., and T. B. Mckee, 1997. Characteristics of 20th century drought in the United States at multiple time scales. Department of Atmospheric Science, Atmospheric Science Paper No. 634, Climatology Report No. 97-2, Colorado State University.
7. Kang, J. K., S. K. Jung, S. J. Maeng, and C. D. Jang, 2015.
Analysis for drought resilience of monoculture on climate change. Discussion of Crisis Management in Korea 11(1):
63-81 (in Korean).
8. Kim, B. S., J. H. Sung, B. H. Lee, and D. J. Kim, 2013.
Evaluation on the impact of extreme droughts in South Korea using the SPEI and RCP 8.5 climate change scenario.
Journal of the Korean Society of Hazard Mitigation 13(2):
97-109 (in Korean). doi:10.9798/KOSHAM.2013.13.2.097.
9. Korea Meteorological Administration (KMA) weather data service open MET data portal, Automated Synoptic Observing System (ASOS). https://data.kma.go.kr/. Accessed 4 Mar. 2021.
10. Korea Rural Community Corporation, Rural Agricultural Water Resource Information System (RAWRIS).
https://rawris.ekr.or.kr/. Accessed 5 Mar. 2021.
11. Korea Rural Economic Institute (KREI), 2016.
Measurement of agricultural damage due to drought.
Korea Rural Economic Institute, Naju, South Korea (in Korean).
12. Korean Statistical Information Service (KOSIS).
https://kosis.kr/. Accessed 19 Jan. 2021.
13. Lee, H. J., W. H. Nam, D. H. Yoon, E. M. Hong, D. E.
Kim, M. D. Svoboda, T. Tadesse, and B. D. Wardlow, 2019. Satellite-based evaporative stress index (ESI) as an indicator of agricultural drought in North Korea. Journal of the Korean Society of Agricultural Engineers 61(3):
1-14 (in Korean). doi:10.5389/KSAE.2019.61.3.001.
14. Lee, H. J., W. H. Nam, D. H. Yoon, E. M. Hong, T. G.
Kim, J. H. Park, and D. E. Kim, 2020. Percentile approach of drought severity classification in evaporative stress index for South Korea. Journal of the Korean Society of Agricultural Engineers 62(2): 63-73 (in Korean). doi:10.
5389/KSAE.2020.62.2.063.
15. Lee, J. W., Y. J. Jang, K. K. Ko, and J. K. Park, 2013.
Effects of meteorological elements in the production of food crops: Focused on regression analysis using panel data.
Journal of Environmental Science International 22(9):
1171-1180. (in Korean). doi:10.5322/JESI.2013.22.9.1171.
16. Mckee, T. B., M. J. Doesken, and J. Kleist, 1993. The relationship of drought frequency and duration to time scales. In Proceedings of the 8th Conference of Applied Climatology, 17-22 January, Anaheim, CA. American Meteorological Society, Boston, MA. 179-184.
17. Mun, Y. S., W. H. Nam, M. G. Jeon, H. J. Kim, K. Kang, J. C. Lee, T. H. Ha, and K. Y. Lee, 2020. Evaluation of regional drought vulnerability assessment based on agricultural water and reservoirs. Journal of the Korean Society of Agricultural Engineers 62(2): 97-109 (in Korean). doi:10.5389/KSAE.2020.62.2.97.
18. Myeong, S. J., 2018. Impact of climate change related natural disasters on rice production in South Korea. Journal of the Korean Society of Hazard Mitigation 18(7): 53-60 (in Korean). doi:10.9798/KOSHAM.2018.18.7.53.
19. Nam, W. H., J. Y. Choi, M. G. Jang, and E. M. Hong, 2013.
Agricultural drought risk assessment using reservoir drought index. Journal of the Korean Society of Agricultural Engineers 55(3): 41-49 (in Korean). doi:10.5389/KSAE.
2013.55.3.041.
20. Nam, W. H., M. J. Hayes, M. D. Svoboda, T. Tadesse, and D. A. Wilhite, 2015. Drought hazard assessment in the context of climate change for South Korea. Agricultural Water Management 160: 106-117. doi:10.1016/j.agwat.2015.
06.029.
21. Nam, W. H., H. J. Kwon, and K. S. Choi, 2018. Reevaluation of design frequency of drought and water supply safety for agricultural reservoirs under changing climate and farming methods in paddy field. Journal of the Korean Society of
Agricultural Engineers 60(1): 121-131 (in Korean). doi:
10.5389/KSAE.2018.60.1.121.
22. Ryu, M. H., S. W. Jang, and D. H. Park, 2011. Climate change and drought: Study on shadow price and damage cost of water under drought. Journal of Wetlands Researh 13(2): 209-218 (in Korean).
23. Seo, S. S., D. G. Kim, K. H. Lee, H. S. Kim, and T. W.
Kim, 2009. Estimation of drought damage based on agricultural and domestic water use. Journal of Wetlands Researh 11(2): 77-87 (in Korean).
24. Schlenker, W., and M. J. Roberts. 2009. Nonlinear temperature effects indicate severe damages to US crop yields under climate change, Proceedings of the National Academy of Sciences 106(37): 15594-15598.
25. Schlenker, W., W. M. Hanemann, and A. C. Fisher, 2005.
Will U.S. agriculture really benefit from global warming?
Accounting for irrigation in the hedonic approach, American Economic Review 95(1): 395-406.
26. So, J. M., K. H. Shon, and D. H. Bae, 2015. Development
and assessment of drought damage estimation technique using drought characteristic factors. Journal of the Korean Society of Hazard Mitigation 15(2): 93-101 (in Korean).
doi:10.9798/KOSHAM.2015.15.2.93.
27. Sung, J. H., K. S. Chae, and D. E. Kim, 2017. The effects of droughts and public investments in irrigation facilities on rice yields in Korea. Korean Journal of Agricultural and Forest Meteorology 19(4): 293-303 (in Korean). doi:10.
5532/KJAFM.2017.19.4.293.
28. Sung, J. H., and K. S. Chae, 2018. The economic effects on droughts: Focused on rice production. Journal of Rural Development 41(3): 1-23 (in Korean).
29. Yoon, D. H., W. H. Nam, H. J. Lee, E. M. Hong, T. G.
Kim, D. E. Kim, A. K. Shin, and M. D. Svoboda, 2018.
Application of evaporative stress index (ESI) for satellite- based agricultural drought monitoring in South Korea.
Journal of the Korean Society of Agricultural Engineers 60(6): 121-131 (in Korean). doi:10.5389/KSAE.2018.60.6.
121.