• 검색 결과가 없습니다.

Long-circulating and target-specific distributions of cyanine 5.5-labeled hyaluronic acid nanoparticles in mouse organs during 28 days after a single administration

N/A
N/A
Protected

Academic year: 2021

Share "Long-circulating and target-specific distributions of cyanine 5.5-labeled hyaluronic acid nanoparticles in mouse organs during 28 days after a single administration"

Copied!
10
0
0

로드 중.... (전체 텍스트 보기)

전체 글

(1)

Korean J Vet Res(2018) 58(4) : 183~192 https://doi.org/10.14405/kjvr.2018.58.4.183

183

<Original Article>

Long-circulating and target-specific distributions of cyanine 5.5-labeled hyaluronic acid nanoparticles in mouse organs during 28 days

after a single administration

Tae Sik Yun

1,†

, Chunmei Lin

2,†

, Jung-Min Yon

1

, Seul Gi Park

1

, Lee Wha Gwon

1

, Jong-Geol Lee

1

, In-Jeoung Baek

3

, Sang-Seop Nahm

4

, Beom Jun Lee

1

, Young Won Yun

1

, Sang-Yoon Nam

1,

*

1

College of Veterinary Medicine and Veterinary Medical Center, Chungbuk National University, Cheongju 28644, Korea

2

College of Chinese Medicinal Materials, Jilin Agricultural University, Changchun 130-118, China

3

Asan Institute for Life Sciences, University of Ulsan College of Medicine, Seoul 05505, Korea

4

College of Veterinary Medicine, Konkuk University, Seoul 05029, Korea

(Received: October 6, 2018; Revised: December 6, 2018; Accepted: December 10, 2018)

Abstract: Although hyaluronic acid (HA) has been developed as a nanoparticle (NP; 320–400 nm) for a drug delivery system, the tissue targeting efficacy and the pharmacokinetics of HA-NPs are not yet fully understood. After a dose of 5 mg/kg of cyanine 5.5-labeled HA-NPs or HA-polymers was intravenously administrated into mice, the fluorescence was measured from 0.5 h to 28 days. The HA-NPs fluorescence was generally stronger than that of HA-polymers, which was maintained at a high level over 7 days in vivo, after which it gradually decreased. Upon ex vivo imaging, liver, spleen, kidney, lung, testis and sublingual gland fluorescences were much higher than that of other organs. The fluorescence of HA-NPs in the liver, spleen and kidney was highest at 30 min, where it was generally maintained until 4 h, while it drastically decreased at 1 day. However, the fluorescence in the liver and spleen increased sharply at 7 days relative to 3 days, then decreased drastically at 14 days. Conversely, the fluorescence of HA-polymers in the lymph node was higher than that of HA-NPs. The results presented herein may have important clinical implications regarding the safety of as self-assembled HA-NPs, which can be widely used in biomedical applications.

Keywords: drug delivery systems, hyaluronic acid, nanoparticles, tissue distribution, toxicokinetics

Introduction

A variety of nanoparticles (NPs) have been produced with the development of nanotechnology in recent years [13].

Nanotechnology has already been applied clinically for phar- maceutical drug delivery systems (DDSs) and development of therapies for various diseases and disorders [1]. In partic- ular, various self-assembled NPs have been produced to deliver diagnostic and/or therapeutic drugs to target sites, promoting early detection and efficient treatment of cancer [5]. Furthermore, NPs have been widely investigated in many areas, such as the predictive paradigm for oxidative stress, DNA array detection, bio–bar codes for detection of pro- teins, gene delivery to cells, scaffolds for tissue engineering and lymphatic targeting materials. Therefore, the number of newly generated nanomaterials has been continuously increasing along with their uses [6, 11, 17, 18, 21, 24, 27].

Despite this enormous increase in the prevalence of engi-

neered nanomaterials, little is known about their toxicologi- cal effects on humans and the environment [14]. Moreover, even though much attention and effort is being put into development of nano-based therapeutic uses, the level of translational clinical use remains restrictive because of uncer- tainty in the toxicological effects of the NPs [11]. Specifi- cally, the behavior of nano-sized particles in natural states and their consequent ecological impacts are still poorly understood [20]. Many studies have been conducted to develop new DDSs using biopolymers and synthetic poly- mers with a variety of functions and performance to reduce the side effects of existing biomedical therapies, optimize the efficiency and effects of the medication and efficiently deliver the minimum concentration of the drug required for treating diseases [13]. One material that satisfies those needs is hyaluronic acid (HA), which has diverse biomedical uses [25]. These self-assembled NPs, composed of biocompatible and amphiphilic polymer conjugates, have shown prolonged

*Corresponding author

Tel: +82-43-261-2596, Fax: +82-43-271-3246 E-mail: [email protected]

The first two authors contributed equally to this work.

(2)

circulation in the blood stream after systemic administration in vivo [15].

Hyaluronic acid, which is also referred to as hyaluronan, is a naturally existing polysaccharide belonging to the family of glycosaminoglycan. This acid consists of repetitive D-glucu- ronic acid- β-(1,3)-N-acetyl-D-glucosamine disaccharide units connected together through β(1,4)-glycosidic bonds [2]. HA is an extracellular and cellular surface-related polysaccharide that is generally referred to as biological ‘goo’ that is involved in lubricating joints or holding together gel-like connective tissues [12]. As a result, it is generally found in various organs and tissues such as the extracellular matrix and synovial fluids of the body. Moreover, it has been stud- ied as a targeting moiety of drug delivery agents or NPs for tumor treatment since it can specifically locate and stick to a variety of tumor cells that express high levels of CD44, an HA receptor [5]. Hyaluronic acid has been found in a broad range of molecular weights, generally from 20 to 4,000 kDa, and this wide range of weights enables its application in ther- apeutic formulations [25]. HA is a substance of increasing importance to biomaterials disciplines that is finding applica- tions in various fields, such as DDS, cosmetic materials and tissue culture scaffolds [6].

It is well known that the biodistribution and accumulation of NPs are affected by their physicochemical characteristics, such as chemical properties of the surface, molecular weight, size, shape, charge and density. However, its detailed in vivo properties, such as tissue targeting efficacy and the pharma- cokinetics of HA-modified macromolecular prodrugs or NPs are not yet fully understood. Therefore, in this study, we evaluated the distribution and toxicity of HA-NPs and HA- polymers in tissues after intravenous application and investi- gated the time-dependent fates of HA-NPs and HA-poly- mers in the animal body over 28 days. Overall, the results of this study provide pharmacokinetics and safety information regarding the use of HA-NPs and HA-polymers as a drug delivery agent.

Materials and Methods

Preparation of HA

Completely prepared HA-NPs and polymers were obtained from Dr. Kwangmeyung Kim, Korea Institute of Science and Technology (Seoul, Korea). The preparation and conjugation of HA used in the experiments was conducted as previously described [3]. Briefly, sodium hyaluronate (M

w

= 2.344 × 10

5

) was purchased from Lifecore Biomedical (USA). Sodium hyaluronate was dialyzed against distilled water, which was followed by lyophilization, after which it was used. Cyanine 5.5 (Cy5.5) was purchased from Amersham Biosciences (USA). HA-5 β-cholanic acid conjugates (HA-CA conju- gates) with an amphiphilic property were generated by chem- ical process or by conjugation of hydrophobic bile acid (5 β- cholanic acid) to the hydrophilic HA backbone via forma- tion of amide. To generate the HA-NPs, phosphate-buffered

saline (PBS; pH 7.4) was used to dissolve HA-CA conju- gates. This solution was sonicated three times for 2 min each using a probe-type sonifier (VCX-750; Sonics & Materials, USA) at 90 W. The particle diameter of the HA-NPs was measured by applying dynamic light scattering with a helium ion laser system (Laser Model 127-35; Spectra-Physics, USA). For animal tests, HA-NPs and HA-polymers were labeled with Cy5.5 to show their biodistribution and accumu- lation in vivo. In the presence of 1-hydroxybenzotriazole and 1-ethyl-3-(3-dimethylaminopropyl)carbodiimide, HA-CA conju- gates were chemically treated with adipic acid dihydrazide- modified Cy5.5. The concentration of Cy5.5 molecules attached to conjugate was fixed to 3.2 wt%, as measured using a a FLx800 fluorescence reader (BioTek, USA) at 680 nm. The average size of the HA-NPs was 320–400 nm, which is similar to that of those that have been applied for clinical applications.

Animals

Six-week-old ICR and hairless (Hos: HR-1) male mice were purchased from Korea animal technology (Korea) and Central Laboratory Animal Inc. (Korea), respectively. The mice were housed under the following conditions: an ambi- ent temperature of 20

o

C ± 2

o

C, relative humidity of 50 ± 10%, air ventilation rate of 10 cycles per hour, and a 12:12 h light-dark cycle. The animals were fed standard mouse chow (Samyang, Korea) and tap water ad libitum throughout the experimental period. Mice weighing 20 ± 2 g were used for this study. After acclimatization for one week, six mice were assigned to each group (time-dependent group). All experi- ments were approved by the Chungbuk National University Animal Care Committee and conducted according to the Guide for Care and Use of Animals (Chungbuk National University Animal Care Committee, CBNUA-608-13-01).

Ex vivo biodistribution of free Cy5.5

For free Cy5.5 imaging, a dose of 0.1 mg/kg of free Cy5.5 was injected into the tail vein of 7-week-old hairless male mice. A total of 6 mice were used in this control experiment.

After injection of free Cy5.5, the mice were anesthetized and target organs were separated at 0.5 h, 2 h, 4 h, 1 day (d), 3 d, 7 d, 14 d, and 28 d. Target organs were the liver, kidney, heart, lung, stomach, lymph node, testis, small intestine and large intestine. Fluorescence images of dissected organs were obtained as a function of time using an IVIS 200 in vivo imaging system (Xenogen, USA). For accurate analysis of results, the biodistribution of free Cy5.5 was quantified by measuring the fluorescence intensity (photons/sec/cm

2

) from an ex vivo image.

In vivo biodistribution of Cy5.5-labeled HA-NPs and HA-polymers

There were two experimental groups, a Cy5.5-labeled HA-

NPs treated-group and a Cy5.5-labeled HA-polymers treated-

group. Each experimental group contained a total 56 hairless

(3)

male mice, and seven mice were assigned to each time- dependent subgroup (0.5 h, 2 h, 4 h, 1 d, 3 d, 7 d, 14 d, and 28 d). One of seven mice in the subgroups was used as a control mouse to compare with the results of HA treated- mice. The control mouse was administrated saline alone instead of Cy5.5-labeled HA-NPs or HA-polymers. There- fore, six mice per subgroup were used to analyze the results.

Cy5.5-labeled HA-NPs or HA-polymers were injected into the tail vein of 7-week-old hairless male mice at a dose of 5 mg/kg. After injection of Cy5.5-labeled HA-NPs or HA- polymers, the mice were anesthetized and fluorescence images were captured using an IVIS 200 in vivo imaging system (Xenogen). To estimate the time-dependent fates of HA-NPs or HA-polymers, the total change in fluorescence in the whole body was measured at 0.5 h, 2 h, 4 h, 1 d, 3 d, 7 d, 14 d, and 28 d. Finally, the amount and alteration of the flu- orescence image in response to HA-NPs were compared to those observed in the HA-polymers and non-treated (saline- injected) groups to identify the effects of particle size.

Ex vivo distribution of HA-NPs and HA-polymers Mice were prepared and assigned to each group as for investigation of the in vivo distribution of Cy5.5-labeled HA-

NPs or HA-polymers. Similarly, control mice were adminis- trated saline alone instead of Cy5.5-labeled HAs. Cy5.5- labeled HA-NPs or HA-polymers were injected into the tail vein of 7-week-old ICR male mice at a dose of 5 mg/kg.

After injection of Cy5.5-labeled HA-NPs or HA-polymers, the mice were anesthetized and target organs were separated at 0.5 h, 2 h, 4 h, 1 d, 3 d, 7 d, 14 d, and 28 d. The target organs were the brain, sublingual gland, thymus, heart, lung, liver, spleen, kidney, testis, epididymis and adrenal gland.

Fluorescence images of dissected organs were obtained with an IVIS 200 in vivo imaging system (Xenogen).

Fluorescence intensity measurement from ex vivo image For accurate analysis of the results, the biodistributions of HA were quantified by measuring the fluorescence intensity (photons/sec/cm

2

) from an ex vivo image. The target organs were the brain, lymph node, thymus, heart, lung, liver, spleen, kidney, testis, epididymis and adrenal gland. All values are expressed as a function of time.

Statistical analysis

Statistical differences between groups were analyzed by one-way analysis of variance (ANOVA) followed by Tukey’s

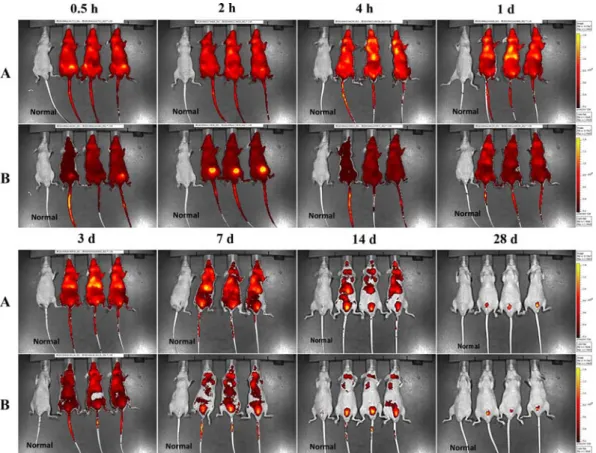
Fig. 1 . In vivo fluorescence images of Cy5.5-labeled HA-NPs (A) and Cy5.5-labeled HA-polymers (B) in the whole body (n = 6) at

0.5 h, 2 h, 4 h, 1 day (d), 3 d, 7 d, 14 d, and 28 d. Tail vein injection of Cy5.5-labeled HA-NPs or HA-polymers (5 mg/kg) in normal

hairless mouse. The fluorescence of HA-NPs was much stronger than that of HA-polymers and was maintained longer within the

experimental period relative to HA-polymers. The liver and urinary bladder were the main organs that showed strong fluorescence in

both groups. Becoming yellow indicates a higher intensity of fluorescence at 680 nm. Normal, untreated mice.

(4)

multiple comparison test. In addition, statistical differences among times in the same group were analyzed by indepen- dent t-tests. Statistical significance was established at p <

0.05. The ex vivo biodistribution of free Cy5.5 was expressed as the means ± SD for groups of six animals. Data describ- ing the fluorescence intensity of HAs from ex vivo images were expressed as the means ± SE for groups of six animals.

All analyses were conducted using SPSS for Windows (ver.

23.0; IBM, USA).

Results

Ex vivo imaging of free Cy5.5

The liver, lung, stomach and kidney were the main organs

in which free Cy5.5 was distributed and accumulated. In addition, free Cy5.5 was detected at higher levels in these organs on the initial day than at other times. Among the total organs, free Cy5.5 was primarily accumulated in the liver.

The fluorescence of the liver showed the highest level at 0.5 h (65.2 × 10

6

± 0.0120 × 10

6

/photons/sec/cm

2

), and was reduced by half at 1 h (32.4 × 10

6

± 0.0056 × 10

6

/photons/

sec/cm

2

), then continued to decrease greatly until 1 d (5.5 × 10

6

± 0.0010 × 10

6

/photons/sec/cm

2

). One day after the admi- nistration of free Cy5.5, it was excreted from the liver very slowly. However, the fluorescence of the liver was main- tained at levels much higher than that of other organs during the first day. In kidney, lung and stomach, the levels of fluo- rescence were much lower than those of the liver, but were

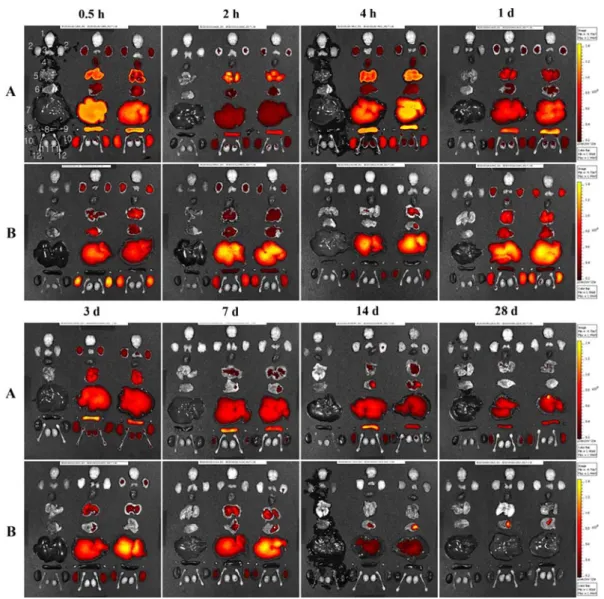
Fig. 2. Ex vivo fluorescence images of Cy5.5-labeled HA-NPs (A) and Cy5.5-labeled HA-polymers (B) in different organs (brain, thy-

mus, sublingual gland, heart, lung, liver, spleen, kidney, adrenal gland, testis and epididymis; n = 6) at 0.5 h, 2 h, 4 h, 1 d, 3 d, 7 d,

14 d, and 28 d. Tail vein injection of Cy5.5-labeled HA-NPs or HA-polymers (5 mg/kg) in normal ICR mice. Generally, the overall

fluorescence of HA-NPs was stronger than that of HA-polymers and was maintained longer during the experimental period. The liver,

spleen, kidney and lung were the main organs that showed strong fluorescence in both groups. Becoming yellow indicates a higher

intensity of fluorescence at 680 nm. 1, brain; 2, sublingual glands; 3, thymus; 4, heart; 5, lung; 6, stomach; 7, liver; 8, spleen; 9, adrenal

glands; 10, kidneys; 11, testes; 12, epididymes.

(5)

higher than those of other organs during the first 4 h. The flu- orescence of the other organs remained low throughout the experimental period and decreased slowly with time (data not shown).

In vivo imaging of Cy5.5-labeled HA-NPs and HA- polymers throughout the body

As shown in Figure 1, evaluation of the whole image of the body revealed that HA-treated groups showed significant differences compared to the normal group, but the distribu- tion of Cy5.5-labeled HAs among organs was not clearly confirmed. Generally, the fluorescence of the HA-NPs groups (Fig. 1A) was much stronger than that of the HA-polymers (Fig. 1B) within the experimental period. The presence of Cy5.5-labeled HA-NPs was confirmed to be at a high level throughout the body, especially in the urinary bladder at 0.5 h after intravenous injection. The fluorescence in the liver was detected at a high level at 4 h. The high level of this fluores- cence throughout the body was maintained until 7 d, and it started to slowly decrease at 14 d. However, it remained in the liver, lung and urinary bladder continuously after that

time, and the last organ that showed fluorescence was the urinary bladder. Similarly, the presence of Cy5.5-labeled HA- polymers was confirmed to be at a high level throughout the body at 0.5 h after intravenous injection, but it showed a much lower level of fluorescence than the HA-NPs group.

The urinary bladder was the brightest organ during the initial 30 min. Specifically, fluorescence was detected at the high- est level in the urinary bladder at 2 h and in the liver at 1 d.

The high level of this fluorescence throughout the body was maintained until 1 d and it decreased slowly at 3 d. However, it remained in the lung and urinary bladder after that time and, with fluorescence remaining in the urinary bladder longest.

Ex vivo imaging of Cy5.5-labeled HA-NPs and HA- polymers in tissues

Generally, the overall fluorescence of HA-NPs (Fig. 2A) in organs was stronger and maintained for longer than HA- polymers (Fig. 2B). The presence of Cy5.5-labeled HA-NPs was confirmed to be at a high level in the lung, liver, spleen and kidney at 0.5 h after intravenous injection. The fluores- cence in those organs was maintained until 4 h, and it started

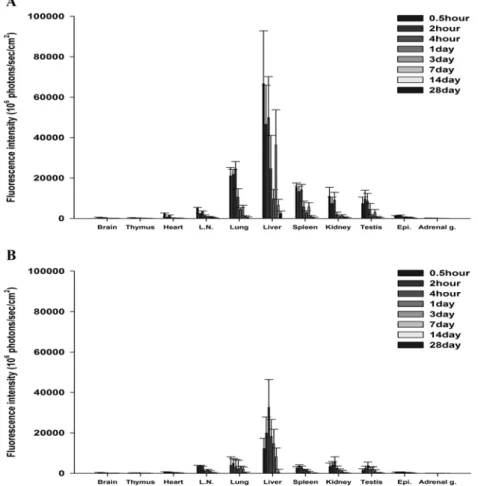
Fig. 3. Fluorescence intensity (10

6

photons/sec/cm

2

) of total organs from 0.5 h to 28 d after injection of 0.5 mg/kg of Cy5.5-labeled

HA-NPs (A) or Cy5.5-labeled HA-polymers (B). The main organs that showed a high intensity of fluorescence were the liver, lung,

spleen, kidney, testis and sublingual gland in both groups. Generally, the intensity of fluorescence peaked within 4 h, then decreased

gradually with time. The intensity of Cy5.5-labeled HA-NPs (A) was much stronger than that of Cy5.5-labeled HA-polymers (B). Data

are expressed as the means ± SE (n = 6).

(6)

to decrease at 1 d; however, it remained in the liver, spleen and kidney throughout the experiment. Similarly, the pres- ence of Cy5.5-labeled HA-polymers was confirmed to be at a high level in the sublingual gland, testis, lung, liver and kid- ney at 0.5 h after intravenous injection. With the exception of the liver, the main organs started to show decreased fluores- cence at 2 h. However, the fluorescence of liver increased at 2 h and was maintained until 1 d. The fluorescence of the lung, liver and kidney was detected at 7 d, but the last organs

in which fluorescence remained were the liver and lung.

While the fluorescence of HA-NPs was maintained in some organs until 28 d, nearly no fluorescence of HA-polymers was detected in any organs at 28 d. The brain was the only organ in which fluorescence was not detected in either group.

Fluorescence intensity from ex vivo imaging in main organs

Figure 3 shows the overall alteration of fluorescence inten-

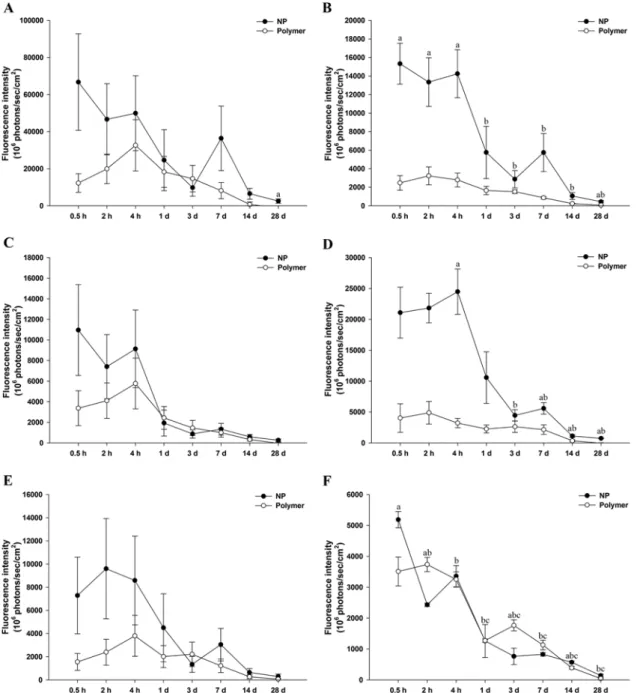
Fig. 4. Fluorescence intensity (10

6

photons/sec/cm

2

) in the liver (A), spleen (B), kidney (C), lung (D), testis (E) and lymph node (F)

from 0.5 h to 28 d after injection of 0.5 mg/kg of Cy5.5-labeled HA-NPs or Cy5.5-labeled HA-polymers. The intensities of Cy5.5-

labeled HA-NPs were much stronger level than those of Cy5.5-labeled HA-polymers. Generally, the intensity of fluorescence peaked

within 4 h, then decreased gradually thereafter. However, the lymph node showed more powerful intensities of fluorescence in HA-

polymers within the experimental period than HA-NPs.

a

p < 0.05 between HA-NPs and HA-polymers.

b,c

p < 0.05 compared with the

intensity of 0.5 h. Data are expressed as the means ± SE (n = 6).

(7)

sity for total organs in HA-NPs (Fig. 3A) and HA-polymers (Fig. 3B) during the experimental periods. Generally, the level of fluorescence peaked from 0.5 to 4 h in both groups, after which it started to decrease. The primary organs that showed more fluorescence intensity were the liver, spleen, kidney, lung, testis and lymph node.

In the liver (Fig. 3A), the fluorescence intensity of Cy5.5- labeled HA-NPs showed the highest level at 0.5 h (66,740 × 10

6

± 26,065 × 10

6

/photons/sec/cm

2

), which was generally maintained at a high level until 4 h. This intensity of fluores- cence decreased significantly at 1 d (24,608 × 10

6

± 16,471 × 10

6

/photons/sec/cm

2

) and decreased gradually from 1 to 28 d, except around 7 d. The intensity of fluorescence at 7 d (36,385 × 10

6

± 17,379 × 10

6

/photons/sec/cm

2

) sharply increased by more than that of 3 d (9,734 × 10

6

± 4,574 × 10

6

/photons/sec/cm

2

), then decreased drastically at 14 d (6,499 × 10

6

± 2,954 × 10

6

/ photons/sec/cm

2

). The fluorescence intensity of Cy5.5-labeled HA-polymers in the liver increased gradually after adminis- tration and showed the highest level at 4 h (32,605 × 10

6

± 13,799 × 10

6

/photons/sec/cm

2

), which decreased gradually until 28 d.

As shown in Figure 4B, the fluorescence intensity of Cy5.5-labeled HA-NPs in the spleen was highest level at 0.5 h (15,327 × 10

6

± 2208 × 10

6

/photons/sec/cm

2

), and was generally maintained at a high level until 4 h. This intensity of fluorescence decreased significantly at 1 d (5,754 × 10

6

± 2,815 × 10

6

/photons/sec/cm

2

), and decreased gradually from 1 to 28 d, except around 7 d. The fluorescence intensity at 7 d (5,743 × 10

6

± 2,051 × 10

6

/photons/sec/cm

2

) sharply increased more than that at 3 d (2,864 × 10

6

± 934 × 10

6

/photons/sec/

cm

2

), then decreased drastically at 14 d (1,052 × 10

6

± 370 × 10

6

/photons/sec/cm

2

). The fluorescence intensity of Cy5.5- labeled HA-polymers in the spleen increased gradually after administration, and showed the highest level at 2 h (3,224 × 10

6

± 959 × 10

6

/photons/sec/cm

2

), then decreased gradually until 28 d.

In the kidney (Fig. 4C), the fluorescence intensity of Cy5.5-labeled HA-NPs showed the highest level at 0.5 h (10,965 × 10

6

± 4,414 × 10

6

/photons/sec/cm

2

), and was gener- ally maintained at a high level until 4 h. This intensity of flu- orescence decreased significantly at 1 d (1,926 × 10

6

± 1,263

× 10

6

/photons/sec/cm

2

), then decreased gradually from 1 to 28 d. The fluorescence intensity of Cy5.5-labeled HA-poly- mers in the kidney increased gradually after administration and showed the highest level at 4 h (5,771 × 10

6

± 2,467 × 10

6

/photons/sec/cm

2

), then decreased gradually until 28 d.

In the lung (Fig. 4D), the fluorescence intensity of Cy5.5- labeled HA-NPs increased significantly after administration, showing the highest level at 4 h (24,486 × 10

6

± 3,667 × 10

6

/ photons/sec/cm

2

). This intensity of fluorescence decreased significantly at 1 d (10,570 × 10

6

± 4,173 × 10

6

/photons/sec/cm

2

), then decreased gradually from 1 to 28 d. The fluorescence intensity of Cy5.5-labeled HA-polymers in the lung increased gradually after administration and showed the highest level at 2 h (4,885 × 10

6

± 1825 × 10

6

/photons/sec/cm

2

), then decreased

gradually until 28 d.

In the testis (Fig. 4E), the fluorescence intensity of Cy5.5- labeled HA-NPs showed the highest level at 2 h (9,601 × 10

6

± 4,327 × 10

6

/photons/sec/cm

2

), and this was generally main- tained until 4 h. This intensity of fluorescence decreased sig- nificantly at 1 d (4,499 × 10

6

± 2,936 × 10

6

/photons/sec/cm

2

) and decreased gradually from 1 to 28 d. The fluorescence inten- sity of Cy5.5-labeled HA-polymers in the testis increased gradually after administration, showing the highest level at 4 h (3,802 × 10

6

± 1,765 × 10

6

/photons/sec/cm

2

), then gradually decreasing until 28 d.

In the lymph node (Fig. 4F), the fluorescence intensity of HA-polymers was generally high within the designated period compared to that of HA-NPs. The fluorescence intensity of Cy5.5-labeled HA-NPs showed the highest level at 0.5 h (5,188 × 10

6

± 265 × 10

6

/photons/sec/cm

2

), then decreased signi- ficantly at 2 h (2,430 × 10

6

± 57 × 10

6

/photons/sec/cm

2

), after which it increased again at 4 h (3,358 × 10

6

± 341 × 10

6

/pho- tons/sec/cm

2

). This intensity of fluorescence decreased signif- icantly at 1 d (1,262 × 10

6

± 533 × 10

6

/photons/sec/cm

2

), then decreased gradually from 1 to 28 d. The fluorescence inten- sity of Cy5.5-labeled HA-polymers in the lymph nodes was highest at 2 h (3,737 × 10

6

± 231 × 10

6

/photons/sec/cm

2

), and was generally maintained at a high level until 4 h. This inten- sity of fluorescence decreased significantly at 1 d (1,272 × 10

6

± 55 × 10

6

/photons/sec/cm

2

), then decreased gradually from 1 to 28 d.

Discussion

The continuous development of new drug delivery agents is facilitated by the necessity to improve therapeutic effects while reducing negative side effects [19]. The potential effects of self-assembled polymeric NPs in tumor treatment have been investigated because they can surround a quantity of water-insoluble anticancer drugs and release them in a sus- tainable manner in their target tissues [3]. In recent years, HA has attracted tremendous interest in the field of drug delivery agents, and they have been used in various types of NPs, as well as ligands to prepare nanoplatforms for actively targeting agents, genes, and diagnostic agents [1]. HA modi- fied macromolecular prodrugs and nano-scaled drug delivery agents showed improved target locating ability and therapeu- tic effects compared to free anticancer drugs [4]. However, as previously described, the time-dependent biodistribution and accumulation of HA are not yet completely understood.

In the present study, Cy5.5-labeled HAs were intrave- nously administrated into mice and the amount of fluores- cence was measured in the main organs to investigate the biodistribution of HA as a drug delivery agent. Thereafter, the distributions of the HAs were monitored as a function of time using in vivo and ex vivo imaging systems.

To identify tissue distribution in real time, a dose of 5 mg/

kg of Cy5.5-labeled HA-NPs or HA-polymers was intrave-

nously administrated into mice. In vivo imaging of the whole

(8)

body showed that the level of fluorescence in HA-NPs (Fig.

1A) was much greater than that of HA-polymers (Fig. 1B) overall. These results suggest that particle size impacts the distribution and accumulation of NPs through the body.

These findings are also supported by those of previous stud- ies that showed NPs have much better intracellular absorp- tion than microparticles, and that the effectiveness of absorption of 100 nm size particles was much better than that of larger size microparticles (1–10 µm) [7, 8, 18]. Although HA-NPs were labeled by 1.5 times more Cy5.5 than HA- polymers, the level of fluorescence in the liver was at an even higher state in the HA-NPs group than the HA-poly- mers group. These results indicate that specific receptors for HA in the liver are molecular weight dependent and show much higher affinity to small-sized particles than large-sized particles [22]. In the current study, in vivo imaging showed that the liver and urinary bladder had much stronger fluores- cence than other organs in both groups. These findings sug- gest that the liver and kidney are the main organs related to excretion of HA [10, 13].

Although the whole body images showed significant dif- ferences compared to the normal group (Fig. 1), distribu- tions among organs were not clearly confirmed. The in vivo imaging to determine tissue distribution was not accurate and reliable because Cy5.5 was not strong enough to distinguish distribution among organs. Moreover, skin permeability, loca- tion of organs from the ventral part, or depth from the abdo- men, and interference by fluorescence from blood and the surrounding organs made it difficult to distinguish organs. To identify more accurate sequential changes in HA-NPs and HA-polymers on the whole body image, more Cy5.5 labeled HA is needed; however, this may change the physicochemi- cal properties of HA and the drugs it encapsulates. There- fore, this result (in vivo imaging) has to be supported by ex vivo imaging as discussed below.

Following administration of the Cy5.5-labeled HA-NPs or HA-polymers into the tail vein, the fluorescence intensities (10

6

photons/sec/cm

2

) were obtained from ex vivo images (Fig. 2). The change in fluorescence intensity was similar to that observed on ex vivo images, but areas non-detected on images were expressed by an imaging program with high dis- cernment. The intensity of HA-NPs fluorescence was gener- ally higher than that of HA-polymers (Figs. 3 and 4). Similarly, as described previously, small-sized particles can penetrate blood vessels and accumulate in tissues more easily than large-sized particles because of differences in receptor affin- ity [7, 8, 18, 22]. However, in the lymph nodes (Fig. 4F), the fluorescence intensity of HA-polymers was generally higher than that of HA-NPs. Because of the atypical physiology of the lymphatic system, intravenously injected NPs do not lead to remarkable delivery to lymphatics [23]. Moreover, lymph node absorption of HA-NPs is highly dependent on density, not particle size; specifically, the absorption of HA-modified agent in the popliteal and iliac lymph nodes was found to mainly rely on HA-density [9]. In addition to particle size,

other factors such as density influence distribution through lymphatics. Therefore, further studies are needed to identify the pharmacokinetics of NPs in the lymphatic system. For example, the effects of density and particle size should be investigated.

The fluorescence of HA-NPs and HA-polymers in the liver, spleen, lung, kidney, testis and lymph node showed much higher intensities than other organs (Fig. 4). Regard- less of HA particle size, the fluorescence in each organ was maintained at a high level for 4 h and decreased at 1 d, after which it was maintained at a low level that gradually decreased for up to 28 d. Therefore, it took about 4 h for HA to distribute through the whole body and about one day to be metabolized and excreted from the animal body. However, some HA that accumulated in tissues appeared to need more time to be metabolized and excreted from body. In particu- lar, regardless of HA particle size, the intensity of fluores- cence in the liver was highest after intravenous injection, at which time it was also high in the spleen, kidney, lung, lymph node and testis (Fig. 3). One mechanism for the removal of HA from blood is by means of the HA receptor for endocytosis, which is primarily located in sinusoidal endot- helial cells of the liver and spleen [22]. Given Teijeiro’s report [22] and the finding that the liver had the highest flu- orescence intensities, HA must be metabolized in liver. These results are also in accordance with those of our in vivo imag- ing. The spleen also showed higher fluorescence intensities than other organs, which was due to the reticuloendothelial system (RES) that takes up HA from the plasma and tissue fluid [9]. In short, the injected NPs were opsonized by plasma proteins in the blood stream, which was followed by their infiltration by RES in the liver and spleen [10, 16]. Sim- ilarly, the kidney also showed high fluorescence intensities.

Therefore, these results imply that circulating nano-sized agents may be dissociated and degraded in vivo and excreted by renal clearance which was further supported by the results of in vivo imaging [10, 13]. The lung was the major organ that showed high intensity because phagocytosis activities such as those conducted by alveolar macrophages contribute to redistribution of nanomaterials within the body [26]. Con- versely, while the level of fluorescence decreased gradually in some organs such as liver (Fig. 4A) and spleen (Fig. 4B) at one day after intravenous injection, it suddenly increased again at 7 d, then decreased again. This may have been because of phagocytic activity such as RES or due to excretion of HA that had accumulated in the tissues during 7 d [13].

Ex vivo imaging of total organs (Fig. 2) revealed that

although HA must be metabolized and excreted by the liver

and kidney, it showed continuous fluorescence in the liver,

spleen and kidney until 28 d, particularly for HA-NPs. Like-

wise, free Cy5.5 showed a similar pattern compared to

Cy5.5-labeled HA-NPs and polymers. These findings indi-

cate that free Cy5.5 was rapidly absorbed in the liver and

maintained at a high concentration in the kidney, which grad-

ually excreted it from the body. Cy5.5-labeled HAs and free

(9)

Cy5.5 showed similar patterns, indicating that more experi- ments are needed to determine if HA is really metabolized in the liver and excreted from the kidney during 28 d. Some studies have reported that nanomaterials do not always dis- tribute in tissue according to particle size because they change their physicochemical properties during blood circulation [10]. Therefore, other test methods such as nuclear magnetic resonance are needed to identify physicochemical properties of nanomaterials in the liver and kidney. It is also necessary to compare these results with those obtained using other test methods that were not used in this experiment.

HA is a naturally existing material that largely constitutes the extracellular matrix of connective tissues and the vitre- ous body of the eye [25]. Furthermore, it is a biodegradable, biocompatible, nontoxic, and non-immunogenic component [2]. Many studies have shown that HA has no side effects such as cytotoxicity, neurotoxicity, mutagenicity, or repro- ductive toxicity. Moreover, histopathological analysis showed no pathological lesions in target organs, including the liver, spleen, kidney, lung, testis and epididymis (data not shown).

Therefore, HA is likely to be a safe material for DDS.

In conclusion, in this study, comparative biodistributions and time-dependent fates of Cy 5.5-labeled HA-NPs and HA-polymers as a potential drug delivery agent were investi- gated in this study. The results showed that HA-NPs had much wider distribution than HA-polymers, implying that the small HA-NPs are able to reach the target site more effec- tively than large HA-polymers. In the liver, spleen and kid- ney, much of the HA was distributed during the first 4 h, after which it was suddenly excreted at 1 d and then gradu- ally excreted until 28 d. These findings imply that the liver and spleen were the main organs that metabolize HA and that HA is excreted from the body through kidney. In the final analysis, HA that circulates in the blood stream is absorbed by the mononuclear phagocytic system in the spleen and liver, metabolized by the liver and excreted from the body through renal clearance. However, some HA that are absorbed by alveolar macrophages are redistributed throughout the lung and HA accumulated by RES or tissue is recirculated at around 7 d. This information on distributions of HA-NPs and HA-polymers in the body may have important clinical impli- cations regarding the safety of self-assembled HA nanoparti- cles, which can be widely used in biomedical applications.

Acknowledgments

This research was supported by the Basic Science Research Program (2016R1D1A1B01015625) through the National Research Foundation of Korea (NRF) funded by the Ministry of Education, Science.

References

1. Arpicco S, Milla P, Stella B, Dosio F. Hyaluronic acid conjugates as vectors for the active targeting of drugs, genes

and nanocomposites in cancer treatment. Molecules 2014, 19, 3193-3230.

2. Battistini FD, Olivera ME, Manzo RH. Equilibrium and release properties of hyaluronic acid–drug complexes. Eur J Pharm Sci 2013, 49, 588-594.

3. Choi KY, Chung H, Min KH, Yoon HY, Kim K, Park JH, Kwon IC, Jeong SY. Self-assembled hyaluronic acid nanoparticles for active tumor targeting. Biomaterials 2010, 31, 106-114.

4. Choi KY, Min KH, Na JH, Choi K, Kim K, Park JH, Kwon IC, Jeong SY. Self-Assembled hyaluronic acid nanoparticles as a potential drug carrier for cancer therapy:

synthesis, characterization, and in vivo biodistribution. J Mater Chem 2009, 19, 4029-4280.

5. Choi KY, Min KH, Yoon HY, Kim K, Park JH, Kwon IC, Choi K, Jeong SY. PEGylation of hyaluronic acid nanoparticles improves tumor target ability in vivo. Biomaterials 2011, 32, 1880-1889.

6. Collins MN, Birkinshaw C. Hyaluronic acid based scaffolds for tissue engineering-a review. Carbohyd Polym 2013, 92, 1262-1279.

7. Desai MP, Labhasetwar V, Amidon GL, Levy RJ.

Gastrointestinal uptake of biodegradable microparticles: effect of particle size. Pharm Res 1996, 13, 1838-1845.

8. Desai MP, Labhasetwar V, Walter E, Levy RJ, Amidon GL. The mechanism of uptake of biodegradable microparticles in Caco-2 cells is size dependent. Pharm Res 1997, 14, 1568-1573.

9. Fraser JRE, Appelgren LE, Laurent TC. Tissue uptake of circulating hyaluronic acid: a whole body autoradiographic study. Cell Tissue Res 1983, 233, 285-293.

10. Hwang HY, Kim IS, Kwon IC, Kim YH. Tumor targetability and antitumor effect of docetaxel-loaded hydro- phobically modified glycol chitosan nanoparticles. J Control Release 2008, 128, 23-31.

11. Joris F, Manshian BB, Peynshaert K, De Smedt SC, Braeckmans K, Soenen SJ. Assessing nanoparticle toxicity in cell-based assays: influence of cell culture parameters and optimized models for bridging the in vitro–in vivo gap.

Chem Soc Rev 2013, 42, 8339-8359.

12. Lee H, Lee K, Kim IK, Park TG. Synthesis, characteri- zation, and in vivo diagnostic applications of hyaluronic acid immobilized gold nanoprobes. Biomaterials 2008, 29, 4709- 4718.

13. Lee JS, Ji HJ, Chai H, Jeong JH, Nam SY, Yun YW, Lee BJ. Distribution and accumulation of Cy5.5-labeled hydrophobically modified glycol chitosan in mice. J Prev Vet Med 2015, 39, 48-57.

14. Marquis BJ, Love SA, Braun KL, Haynes CL. Analytical methods to assess nanoparticle toxicity. Analyst 2009, 134, 425-439.

15. Mironov V, Kasyano V, Shu XZ, Eisenberg C, Eisenberg L, Gonda S, Trusk T, Markwald RR, Prestwich GD.

Fabrication of tubular tissue constructs by centrifugal casting of cells suspended in an in situ crosslinkable hyaluronan- gelatin hydrogel. Biomaterials 2005, 26, 7628-7635.

16. Moghimi SM, Hunter AC, Murray JC. Long-circulating and target-specific nanoparticles: theory to practice. Pharmacol Rev 2001, 53, 283-318.

17. Nam JM, Thaxton CS, Mirkin CA. Nanoparticle-based bio-

(10)

bar codes for the ultrasensitive detection of proteins. Science 2003, 301, 1884-1886.

18. Panyam J, Labhasetwar V. Biodegradable nanoparticles for drug and gene delivery to cells and tissue. Adv Drug Deliv Rev 2003, 55, 329-347.

19. Rösler A, Vandermeulen GWM, Klok HA. Advanced drug delivery devices via self-assembly of amphiphilic block copolymers. Adv Drug Deliv Rev 2001, 53, 95-108.

20. Song U, Jun H, Waldman B, Roh J, Kim Y, Yi J, Lee EJ. Functional analyses of nanoparticle toxicity: a comparative study of the effects of TiO

2

and Ag on tomatoes (Lycopersicon esculentum). Ecotoxicol Environ Saf 2013, 93, 60-67.

21. Taton TA, Mirkin CA, Letsinger RL. Scanometric DNA array detection with nanoparticle probes. Science 2000, 289, 1757-1760.

22. Teijeiro C, McGlone A, Csaba N, Garcia-Fuentes M, Alonso MJ. Polysaccharide-based nanocarriers for drug delivery. In: Torchilin V (ed.). Handbook of Nanobiomedical Research: Fundamentals, Applications and Recent Develop- ments. Vol. 1. 1st ed. pp. 235-278, World Scientific, Singapore, 2014.

23. Thomas SN, Schudel A. Overcoming transport barriers for

interstitial-, lymphatic-, and lymph node-targeted drug delivery.

Curr Opin Chem Eng 2015, 7, 65-74.

24. Tiantian Y, Wenji Z, Mingshuang S, Rui Y, Shuangshuang S, Yuling M, Jianhua Y, Xinggang Y, Shujun W, Weisan P. Study on intralymphatic-targeted hyaluronic acid-modified nanoliposome: influence of formulation factors on the lymphatic targeting. Int J Pharm 2014, 471, 245-257.

25. Tripodo G, Trapani A, Torre ML, Giammona G, Trapani G, Mandracchia D. Hyaluronic acid and its derivatives in drug delivery and imaging: recent advances and challenges.

Eur J Pharm Biopharm 2015, 97, 400-416.

26. Walkey CD, Olsen JB, Guo H, Emili A, Chan WCW.

Nanoparticle size and surface chemistry determine serum protein adsorption and macrophage uptake. J Am Chem Soc 2012, 134, 2139-2147.

27. Zhang H, Ji Z, Xia T, Meng H, Low-Kam C, Liu R,

Pokhrel S, Lin S, Wang X, Liao YP, Wang M, Li L,

Rallo R, Damoiseaux R, Telesca D, Mdler L, Cohen Y,

Zink JI, Nel AE. Use of metal oxide nanoparticle band gap

to develop a predictive paradigm for oxidative stress and

acute pulmonary inflammation. ACS Nano 2012, 6, 4349-

4368.

수치

Fig. 1 . In vivo fluorescence images of Cy5.5-labeled HA-NPs (A) and Cy5.5-labeled HA-polymers (B) in the whole body (n = 6) at 0.5 h, 2 h, 4 h, 1 day (d), 3 d, 7 d, 14 d, and 28 d
Fig. 2.  Ex vivo fluorescence images of Cy5.5-labeled HA-NPs (A) and Cy5.5-labeled HA-polymers (B) in different organs (brain, thy- thy-mus, sublingual gland, heart, lung, liver, spleen, kidney, adrenal gland, testis and epididymis; n = 6) at 0.5 h, 2 h, 4
Fig. 3. Fluorescence intensity (10 6  photons/sec/cm 2 ) of total organs from 0.5 h to 28 d after injection of 0.5 mg/kg of Cy5.5-labeled HA-NPs (A) or Cy5.5-labeled HA-polymers (B)
Figure 3 shows the overall alteration of fluorescence inten-

참조

관련 문서

contralateral extremity except 3 patients who had comminuted fracture at the last follow-up. These three cases showed an angular deformity of less than 5 degrees and

capacity with respect to freeze-thaw cycles···26 Figure 4: Particle size, PDI and zeta potential value ···27 Figure 5: Western blotting showed the expression of specific

Equivalent dose (HT) to tissues/organs in the maxillofacial region and effective doses for indirect and direct digital panoramic radiographys... Comparison of effective

– Land: Food, Urbanization, Fibre, Water, Conservation – Energy: Utility and cost as a delivered energy form.. • US has land

2. No chain length effect.. 2-6 Molecular Weight Control in Linear Polymerization i) Quenching the reaction.. =&gt; Subsequent heat can change the Molecular Weight

Sequencing results of groEL gene of Anaplasma phagocytophilum detected in blood, kidney and spleen of wild rodents captured in Jeollanam-do area using a

In this study, we developed a non-toxic titanium alloy with low elastic modulus in order to improve biocompatibility, and the surface characteristics of

Comparison of cell attachment on the bone grafting materials synthesized as the defined mixing ratio of Hydroxyapatite (HA) and β-tricalcium phosphate (β-TCP) by DAPI staining