화장품에 함유된 미량의 프탈레이트 함량을 정확히 분석하기 위한 가스크로마토그래피-질량분석 시험법 및 그 시험법의 유효성
김 민 기†⋅정 혜 진⋅조 준 철 아모레퍼시픽 기술연구원 피부연구소
(2011년 11월 1일 접수, 2011년 11월 30일 수정, 2011년 12월 5일 채택)
Accurate Analysis of Trace Phthalates and Method Validation in Cosmetics using Gas Chromatography with Mass Spectrometric Detection
Minkee Kim†, HyeJin Jeong, and JunCheol Cho
Skin Research Institute, AMOREPACIFIC Corporation R&D Center, Yongin-si, Gyeonggi-do 446-729, Korea (Received November 1, 2011; Revised November 30, 2011; Accepted December 5, 2011)
요 약: 네일락카와 헤어스프레이 같은 화장품에 존재하는 미량의 프탈레이트를 정량분석하기 위하여, 가스크로마토그 래피와 질량분석기를 사용한 효과적이면서 환경친화적인 분석방법을 개발하였다. 이들 화장품들은 다량의 유기용매를 함유되어 프탈레이트를 분석하기 위하여 널리 사용되는 시료의 클린업 방법이 적합하지 않았다. 더군다나 미량의 프탈 레이트 분석시에는 실험과정 중에서의 오염으로 인해 실제보다 높은 분석값을 산출하게 되는 경우가 매우 많다. 이에 정확한 함량분석 및 이차오염을 방지하기 위해 유기용매를 사용하여 시료를 직접 희석하는 시료 전처리를 적용하였다.
이 분석방법은 높은 정확성, 분석감도, 그리고 시료전처리를 간략히 할 수 있는 이점을 가진다. 화장품에서의 검출되는 빈도가 높고, 사람과 동물에 영향을 미치는 환경호르몬으로 보고되는 dibutyl phthalate (DBP)와 di (2-ethylhexyl) phthalate (DEHP) 두 종의 프탈레이트를 분석대상으로 선정하였다. 정량시 그 정확도 향상을 위해서 내부표준물질로 두 물질의 중수소치환체인 DBP-
d4, 와 DEHP-
d4를 사용하였다. 시험법의 유효화를 시행한 결과 본 시험법이 ppm 농도 의 프탈레이트 정량분석에 적합함을 확인하였으며, 네일락카와 헤어스프레이 제품에 약 25 µg/g의 농도로 표준물질을 첨가하여 분석한 회수율은 95 ∼ 106.1 % 범위였고, % 상대표준편차 값은 3.9 % 이하였다.
Abstract: An effective, environmentally friendly analytic methods using gas chromatography with mass spectro- metric detector (GC-MSD) have been developed for the quantitative analysis of trace phthalate levels in cosmetics such as nail lacquer and hair spray. Since such cosmetics are largely comprised of organic solvents, conventional clean-up methods that have been widely used for phthalate analyses are in adequate. In addition, analysis of trace phthalate levels is notorious for its sensitivity to contamination, which causes high analytical values. A direct sample dilution method using an organic solvent was adopted to the sample preparation process to determine the exact amounts of phthalates and simultaneously avoid the high risk of secondary contamination. The method has many advantages including high accuracy, sensitivity, and simplicity in sample preparation. Dibutyl phthalate (DBP) and di (2-ethylhexyl) phthalate (DEHP) were selected for analysis because they have been frequently detected in cos- metics and consistently reported as endocrine disruptors in humans and animals. Internal standard method using two deuterium substitutes (DBP-
d4, DEHP-
d4) as the internal standard was also used. The results of ‘Method validation' showed the capabilities of this method for the routine analysis of phthalates at the ppm level. The recovery ranges were between 95 % and 106.1 %, and relative standards deviations (RSD) were less than 3.9 % in fortified nail lac- quer and hair spray samples at the concentration of 25 µg/g.
1)
Keywords: cosmetics, dibutyl phthalate, di (2-ethylhexyl) phthalate, gas chromatography with mass spectrometric de- tector, method validation
† 주 저자 (e-mail: [email protected])
1. Introduction
The widespread production and use of phthalates in commercial goods caused many issues to the present environment. Since these sorts of persistent and re- fractory organic pollutants have a propensity to accu- mulate in living tissues, they give high risk to human health. Phthalates have been reported as cancer-caus- ing and endocrine-disrupting materials[1,2], and some phthalates and their metabolites showed reproductive effects[3,4]. Such factors are very important for trace analysis. Some research on phthalate (and/or their me- tabolites) levels in human urine, blood, and breast milk[5–7] revealed that phthalates extensively migrate into the human body from various sources, including cosmetics. Accordingly, the use of dibutyl phthalate (DBP), benzylbutyl phthalate (BBP), and di (2-ethyl- hexyl) phthalate (DEHP) as cosmetic ingredients is prohibited by law in many countries because of their well-known genotoxicities. Additionally, the use of di- butyl phthalate (DEP) is of concern, although it is rarely reported to be genotoxic.
While phthalates are not used as cosmetic in- gredients, some cosmetics such as nail lacquer, hair spray, and perfume contain phthalates as impurities.
According to the European Cosmetic Toiletry and Perfumery Association (COLIPA), trace amounts of phthalates in the product itself can be caused from contamination and/or carryover from plastic and raw materials used in production or storage. COLIPA has asked the European Commission on Health & Consu- mer Protection Directorate-General to evaluate whether the presence of such trace levels would constitute a risk to consumers. In 2007, the Scientific Committee on Consumer Products (SCCP) of the European Commis- sion agreed that “traces of DBP, BBP, and DEHP up to 100 µg/g (or µg/mL) total or per substance don't in- dicate a risk to the health of the consumer”[8].
Nevertheless, non-governmental organizations (NGO) have consistently sought to eliminate these chemicals from cosmetics, contending that even trace amounts of phthalates will be very harmful to humans. As a result, the cosmetic industry needs an reliable, accurate, and
convenient analytical method to detect low levels of phthalates and thus control the quality of their products.
Previous researchers have focused solely on analysis of phthalates in environmental samples such as wa- ter-based matrices and soil samples[9–15], and in food stuffs such as milk, vegetable oil, and wine[16–18].
However studies on phthalates in cosmetics are rare.
Two papers using gas chromatography with a flame ionization detector (GC-FID) and high performance liquid chromatography (HPLC) exist[19,20]. But their quantitative concentration levels were disappointingly above 0.1 % (1000 µg/g). The most common techni- ques used for sample preparation were solvent ex- traction[12,15], liquid –liquid extraction (LLE), adsorp- tion column chromatography, and solid phase extraction (SPE)[5,6,12,13,16,21]. However these treatments are expensive, time-consuming, laborious, and harmful to both analyst and environment because they use organic solvent extraction and pre-concentration steps to ana- lyze trace levels. Moreover, analysis of phthalates at low concentrations is notorious for being contaminated by the apparatus and solvent, which results in high an- alytical results[22]. Accordingly, phthalate analysis re- quires extra steps to remove possible contamination from the sample. To overcome the drawbacks of the sample preparation method mentioned above, solid- phase microextraction (SPME)[17,18] and liquid- phase microextraction (LPME)[9,11,14] have been de- veloped and used in environmental, food, biological, and pharmaceutical analyses. These procedures simplify the sampling, extraction, and concentration steps, and greatly reduce secondary contamination of phthalates.
In addition, they use a minimal amount of solvent and achieve good concentration efficiency.
Nail cosmetics, hair sprays, and perfumes are the
main cosmetic products in which phthalates (particul-
arly DBP, and DEHP) are detected. These cosmetics
share the feature of containing plenty of organic sol-
vents, which causes ready phthalate contamination
during production or storage and makes sample treat-
ment for trace analysis difficult. According to our ex-
perimental observations, the sample preparation meth-
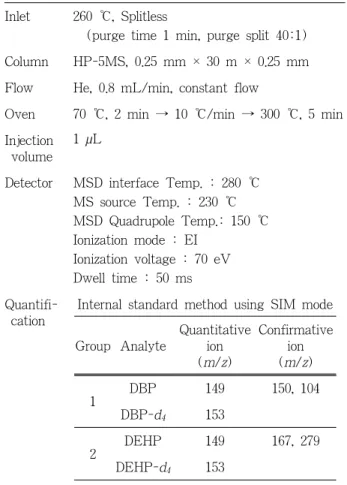
Table 1. Operation Condition for Analysis of Phthalates Inlet 260 ℃, Splitless
(purge time 1 min, purge split 40:1) Column HP-5MS, 0.25 mm × 30 m × 0.25 mm Flow He, 0.8 mL/min, constant flow
Oven 70 ℃, 2 min → 10 ℃/min → 300 ℃, 5 min Injection
volume 1 µL
Detector MSD interface Temp. : 280 ℃ MS source Temp. : 230 ℃ MSD Quadrupole Temp.: 150 ℃ Ionization mode : EI
Ionization voltage : 70 eV Dwell time : 50 ms Quantifi-
cation
Internal standard method using SIM mode
Group Analyte
Quantitative ion (m/z)
Confirmative ion (m/z)
1 DBP 149 150, 104
DBP-d4 153
2 DEHP 149 167, 279
DEHP-d4 153
ods discussed above are ineffective for phthalate analy-
sis of these cosmetics. In this study, we adopted a di- rect sample dilution method with an organic solvent, and quantified DBP, and DEHP at low levels in nail cosmetics and hair sprays with GC-MSD. Two phtha- lates (DBP and DEHP) were selected for analyses be- cause they have been identified in these cosmetics and are possible endocrine disruptors in humans. We con- firmed the capabilities and validity of our described method through the ‘method validation’ procedure re- ferred to in EPA methods 8000C[23] and 8270D[24].
2. Experimental
2.1. Chemicals and Reagents
The grade of methanol, acetone, and n-hexane were
‘B&J GC
2capillary GC/GC-MS solvent. For trace analysis at or below the ppb level' (Honeywell. USA).
Dibutyl phthalate (DBP), and di (2-ethylhexyl) phtha- late (DEHP) were obtained from Sigma-Aldrich (USA). Di-n-butylphthalate-3,4,5,6-d
4(DBP-d
4) and di (2-ethylhexyl)phthalate-3,4,5,6-d
4(DEHP-d
4), which were used as the internal standards, were purchased from CDN Isotopes Inc. (USA).
2.2. Instruments and Apparatus
The GC-MSD system used was the 6890GC (Agilent, USA), which included capillary column split/splitless EPC inlet and liquid autosampler, 5975B inert XL MSD (Agilent, USA), and Mass Chemstation data system.
The analytical column was HP-5MS (30 m × 0.25 mm, 0.25 µm).
All glassware was ultrasonicated in acetone for at least 30 min, then washed with n-hexane and dried in a phthalate-free desiccator at least 1 day to avoid phthalates contamination.
2.3. Preparation of Sample and Standard Solutions An internal standard (IS) solution was made by dis- solving two deuterium substitutes in methanol and di- luting the solution to a concentration of about 10 µg/mL. A standard stock solution was prepared by dis- solving DBP and DEHP together into a 100 mL volu-
metric flask with methanol. This stock solution was used to prepare the seven levels of standard solutions ranging 0.01 µg/mL to 2.5 µg/mL. Adequate portions of standard stock solution with the addition of 0.5 mL of IS solution were diluted to 10 mL with methanol to prepare the working standard solutions.
About 0.5 g of sample was transferred into 10 mL flask with 0.5 mL of IS solution. This sample solution dissolved with acetone, then was ultrasonicated for at least 30 min, and was filled up with acetone to given volumn. When insolubles existed, they were removed by centrifugation. The upper clear layer was moved to the GC vial and then injected in the GC.
2.4. Identification and Quantification
The standard solution, sample solution, and solvent
blank solution were injected into the split/splitless inlet
in splitless mode by the autosampler. Selected ion mon-
itoring (SIM) mode was used for quantification (m/z
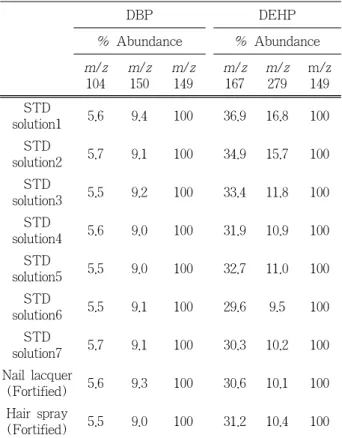
Table 2. % Abundancesa of Confirming Mass Relative to Quantitative Mass
DBP DEHP
% Abundance % Abundance m/z
104 m/z
150 m/z
149
m/z 167
m/z 279
m/z 149 STD
solution1 5.6 9.4 100 36.9 16.8 100 STD
solution2 5.7 9.1 100 34.9 15.7 100 STD
solution3 5.5 9.2 100 33.4 11.8 100 STD
solution4 5.6 9.0 100 31.9 10.9 100 STD
solution5 5.5 9.0 100 32.7 11.0 100 STD
solution6 5.5 9.1 100 29.6 9.5 100 STD
solution7 5.7 9.1 100 30.3 10.2 100 Nail lacquer
(Fortified) 5.6 9.3 100 30.6 10.1 100 Hair spray
(Fortified) 5.5 9.0 100 31.2 10.4 100
a[Abundance of confirming mass/abundance of quantita- tive mass (m/z 149)] × 100
149 comes from phthalates and m/z 153 comes from IS) and analyte identification (m/z 104 and m/z 150 for DBP, m/z 167 and m/z 279 for DEHP). DBP-d
4was used as an IS for DBP and DEHP-d
4was used for DEHP. The operation conditions are summarized in Table 1.
2.5. Method Validation
We also performed ‘Method Validation’ which refers to EPA method 8000C ‘Determinative chromatographic separations’, and 8270D ‘Semivolatile organic com- pounds by Gas Chromatography/Mass Spectrometry’.
The specificity (peak identification) was checked by relative retention time (RRT), which was expressed as retention time (RT) of the m/z 149 ion over RT of m/z 153 ion derived from IS and ion ratios (two % abundances of confirmative ions compared with quanti- tative ion).
Linearity was evaluated by calibration curves of first-order and second-order least squares regression.
The correlation coefficient derived from standard sol- utions in the range of 0.01 ~ 2.5 µg/mL. % differences were calculated to confirm the representativeness of the data. This checks fitness of the calibration data back to the model of the calculated amount of each of the standards against the expected amount of the standard, which was determined by using the following equation:
% difference = (C
c– C
e)/C
e× 100
where C
cis the calculated amount of standard in concentration units
C
eis the expected amount of standard in concentration units.
The % recovery and precision were calculated to check the accuracy of these methods by analyzing spiked hair spray and nail lacquer samples that con- tained a certain amount of standard solution. Hair spray and nail lacquer samples, which were prepared in con- centrations of 25.0 µg/g of each DBP and DEHP, were analyzed. Fortified samples were created from well-
cleaned nail cosmetics and hair spray samples by add- ing a certain amount of analytes.
3. Results
Analyte level in standard solution lower than 0.01 µg/mL was difficult to quantify by this method. We confirmed the reliability of the quantification range of 0.2 ~ 50 µg/g in sample for GC-MSD. Obviously, this method minimizes sample handlings and the amounts of solvent, which show their potentials for analyzing trace level of phthalates. Acceptable criteria for vali- dation were based on those described in EPA methods.
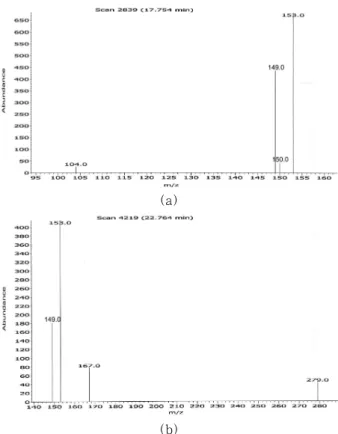
3.1. Specificity (Peak Identification)
GC-MS chromatograms and mass spectra of each
peak provide some information for peak identification,
Table 3. Parameters of Calibrations
First order Second order
DBP DEHP DBP DEHP
Equation y = 0.9658 x + 0.0069
y = 0.9212 x + 0.007
y = 0.0267 x2+ 0.8761 x + 0.0421
y = 0.0014 x2+ 0.9158
x + 0.0095 r2 0.9992 0.9986 0.9998 0.9986 LOD
(µg/g) 0.06 0.09 0.06 0.09
LOQ
(µg/g) 0.2 0.3 0.2 0.3
0.01 ∼ 2.5 µg/mL, 7 levels (n = 3) Figure 1. Total ion chromatogram of standard solution.
(a)
(b)
Figure 2. Mass spectra of DBP peak (a) and DEHP peak (b).
Table 4. % Difference of Standard Solutions (n=3) Standard
solutions
First order Second order
DEP DEHP DEP DEHP
1
57.3 48.9 54.7
- 2.6 43.9 46.1
16.4 7.3 13.5
- 5.3 41.3 43.6
2
14.4 14.1 11.5
4.4 - 1.0 - 8.9
- 2.7 - 2.8 - 5.7
3.3 - 2.1 - 10.1
3
- 4.7 - 3.4 - 4.3
- 0.4 - 2.0 - 3.7
- 2.7 - 1.3 - 2.3
- 0.3 - 1.8 - 3.6
4
- 2.1 - 1.8 - 1.3
- 3.2 - 2.8 0.1
0.8 1.1 1.6
- 3.0 - 2.6 0.2
5
- 1.8 - 2.4 - 0.7
1.5 0.3 0.1
0.0 - 0.6 1.1
1.6 0.4 0.2
6
- 0.7 0.4 - 0.9
0.4 - 0.9 - 2.0
1.1 3.3 - 1.6
0.7 - 0.5 - 1.6
7
- 2.0 1.3 2.0
1.3 2.0 1.3
- 1.2 3.0 - 3.1
0.0 0.6 - 0.1
including RT and relative intensity of confirming
masses. Deviations of RRT windows (criterion : ≤ 0.06 min) were within 0.001 min, deviations of absolute RT windows (criterion : ≤ 0.03 min) were within 0.02 min, and deviation of % abundance of confirmative ions (criterion : within ± 20 %) were lower than 5 % (Table 2). A peak suspected to be phthalate was not considered when it did not satisfy any one of these identification criteria.
3.2. Linearity / % difference
The calibration curve was obtained using first-order
and second-order least squares regression. The correla-
tion coefficients (r
2, criterion : > 0.99) were greater
than 0.997 (Table 3). All results of % differences in
Table 5. % Recovery and % RSD of Fortified Sample Solutions (n=6)
DBP DEHP
% Recovery
RSD (%)
% Recovery
RSD (%) Hair spray
(Fortified) 95.1 0.8 95.0 0.6
Nail lacquer
(Fortified) 97.3 0.9 104.2 0.8
Figure 3. GC-MSD total ion chromatogram of a fortified nail lacquer sample.
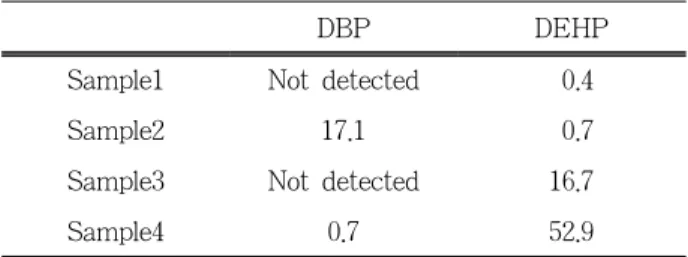
Table 6. Measured Concentrations in Nail Lacquer Cosmetics (n=3, µg/g)
DBP DEHP
Sample1 Not detected 0.4
Sample2 17.1 0.7
Sample3 Not detected 16.7
Sample4 0.7 52.9