Research Article
Analysis of Polycyclic Aromatic Hydrocarbons in Ambient
Aerosols by Using One-Dimensional and Comprehensive
Two-Dimensional Gas Chromatography Combined with Mass
Spectrometric Method: A Comparative Study
Yun Gyong Ahn ,
1So Hyeon Jeon,
1Hyung Bae Lim,
2Na Rae Choi,
3Geum-Sook Hwang,
1Yong Pyo Kim,
4and Ji Yi Lee
31Western Seoul Center, Korea Basic Science Institute, Seoul 03759, Republic of Korea
2Air Quality Research Division, National Institute of Environmental Research, Incheon 22689, Republic of Korea 3Department of Environmental Science and Engineering, Ewha Womans University, Seoul 03759, Republic of Korea 4Department of Chemical Engineering and Material Science, Ewha Womans University, Seoul 03760, Republic of Korea
Correspondence should be addressed to Ji Yi Lee; [email protected]
Received 14 December 2017; Revised 6 February 2018; Accepted 19 February 2018; Published 1 April 2018 Academic Editor: Federica Bianchi
Copyright © 2018 Yun Gyong Ahn et al. This is an open access article distributed under the Creative Commons Attribution License, which permits unrestricted use, distribution, and reproduction in any medium, provided the original work is properly cited.
Advanced separation technology paired with mass spectrometry is an ideal method for the analysis of atmospheric samples having complex chemical compositions. Due to the huge variety of both natural and anthropogenic sources of organic compounds, simultaneous quantification and identification of organic compounds in aerosol samples represents a demanding analytical challenge. In this regard, comprehensive two-dimensional gas chromatography with time-of-flight mass spectrometry (GC×GC-TOFMS) has become an effective analytical method. However, verification and validation approaches to quantify these analytes have not been critically evaluated. We compared the performance of gas chromatography with quadrupole mass spectrometry (GC-qMS) and GC×GC-TOFMS for quantitative analysis of eighteen target polycyclic aromatic hydrocarbons (PAHs). The quantitative obtained results such as limits of detection (LODs), limits of quantification (LOQs), and recoveries of target PAHs were approximately equivalent based on both analytical methods. Furthermore, a larger number of analytes were consistently identified from the aerosol samples by GC×GC-TOFMS compared to GC-qMS. Our findings suggest that GC×GC-TOFMS would be widely applicable to the atmospheric and related sciences with simultaneous target and nontarget analysis in a single run.
1. Introduction
Human health research associated with polycyclic aromatic hydrocarbons (PAHs) has raised concerns because certain PAHs are classified as probable human carcinogens [1–4] and have shown tumorigenic activity and endocrine disrupting activity in mammals [5]. The US EPA has included 16 of them in the list of priority pollutants and has established a maximum contaminant level of 0.2 μg/L for benzo[a]pyrene in drinking water [6]. In the European Union (EU), eight PAHs have been identified as priority hazardous substances in the field of water
policy [7]. The EPA priority 16 PAHs and two additional PAHs are now being monitored by European agencies, and they have sought to quantify the individual concentrations of benzo[e] pyrene and perylene in environmental samples [6]. PAHs are found in ambient air in the gas phase and as sorbents to aerosols [8]. Thus, air monitoring of PAHs to quantify in-halation exposure and to identify other organic compounds is important for insight into photochemical reactions. The quantification and identification of organic compounds in air samples is an important feature of atmospheric chemistry and represents some demanding analytical challenges [9].
Volume 2018, Article ID 8341630, 9 pages https://doi.org/10.1155/2018/8341630
For these reasons, a key issue in current analytical methods is the ability to measure a large number of com-pounds with quantitative analysis for target analytes. Comprehensive two-dimensional gas chromatography (GC×GC) coupled with mass spectrometry (MS) can screen for nontarget compounds with fast identification of the compounds in an entire sample [10]. Therefore, previous studies applied GC×GC-MS for the identification of nu-merous compounds present in air samples [11–13]. How-ever, there are limitations on the validation of simultaneous quantification and identification of analytes in air samples. Correspondingly, a validation of simultaneous identification and quantification of PAHs and other compounds in air samples by GC×GC–MS is required. A TOF mass spec-trometer was used to acquire sufficient data from a com-prehensive two-dimensional chromatographic technique that generated multiple narrow peaks from the short sec-ondary column [14, 15]. Generally, GC coupled with quadrupole MS (GC-qMS) in the selected ion monitoring (SIM) mode has been used for quantitative analysis of PAHs in air samples because of its selective detection for specific target compounds [16, 17]. However, a GC×GC-TOFMS validated method suitable for the quantification of target PAHs in an aerosol sample compared with GC-qMS in the SIM mode has not yet been reported. The aim of this study was to evaluate the effectiveness of GC×GC-TOFMS in the quantitative analysis of target PAHs as well as the fast identification of multiple compounds for aerosol samples. The validity of the quantitative results obtained by both GC×GC-TOFMS and GC-qMS in the SIM mode was demonstrated by several method performance parameters such as linearity, accuracy, and repeatability.
2. Experimental
2.1. Air Sampling. The total suspended particle (TSP)
samples were collected at Asan Engineering Building, Ewha Womans University, Seoul, South Korea (37.56°N, 126.94°E,
20 m above ground level), with a PUF sampler (Tisch, TE-1000) on a quartz fiber filter (Quartz fiber filter, QFF, Ø10.16 cm, Whatman, UK). The sampling site is located in the mixed resident area, commercial area, forest area, and nearby roadside. A total of 67 filter samples were obtained during summer (August 12–30, 2013) and winter (January 27–February 16, 2014) and day (9 a.m.∼6 p.m.) and night (8 p.m.∼6 a.m.). Prior to sampling, the quartz fiber filters were baked for 8 h in an electric oven at 550°C to remove
possible organic contaminants. The sampled filters were wrapped in aluminum foils and stored in a freezer at −20°C
until analysis.
2.2. Chemicals. All organic solvents were of GC grade and
purchased from Burdick and Jackson (Phillipsburg, NJ, USA). Standard solutions of target PAHs (Table 1 for their full chemical names and information) except Per and BeP for quantitative analysis were purchased as a mixture at a concentration of 2000 µg/mL in dichloromethane from Supelco (Bellefonte, PA, USA). Per and BeP standards
(>99%) were purchased from Aldrich (St. Louis, MI, USA), and a standard mixture of eighteen PAHs was prepared at a concentration of 1000 µg/mL. Deuterium-labeled internal standards of seven PAHs were purchased from Aldrich (St. Louis, MI, USA) and Chiron (Trondheim, Norway) and used for the spiking test as listed in Table 1. Working standard solutions (0.01∼10 µg/mL) were prepared and then stored at −20°C prior to use.
2.3. Preparation of Samples. Air sampling filters were
extracted with a mixture of dichloromethane and methanol (3 : 1, v/v) two times using an accelerated solvent extractor (ASE) (Dionex ASE-200) at 40°C and 1700 psi for 5 min.
Prior to the extraction, seven deuterated internal standards (Nap-d8, Ace-d10, Phen-d10, Fla-d10, Chr-d12, Per-d12, and BghiPer-d12) were spiked in the filters to compensate for matrix effects during the extraction procedure. Extracts were blown down to 1 mL using a nitrogen evaporator (TurboVap II, Caliper Life Sciences). GC×GC-TOFMS analysis was carried out using an Agilent GC (Wilmington, Delaware, USA)-Quad-jet thermal modulation Pegasus 4D TOFMS (LECO, St. Joseph, MI, USA). The sample was in-jected in the splitless mode at 300°C. The GC×GC columns
were as follows: DB-5MS (30 m × 0.25 mm ID, film thickness of 0.25 μm) and 1.17 m DB-17MS (0.18 mm OD, 0.18 μm film). The operating conditions of GC-MS and GC×GC-TOFMS are summarized in Table 2.
3. Results and Discussion
3.1. GC-qMS and GC×GC-TOFMS for Characterization of Aerosol Samples. In most studies, separation and
quantifi-cation of PAHs in aerosol samples have been analyzed using a conventional GC-qMS [18]. Flame ionization detection (FID) has also been widely used for quantification as it features a higher response to PAHs which contain only carbon and hydrogen, while oxygenates and other species that contain heteroatoms tend to have a lower response factor [19]. However, this nonspecific detector may not distinguish inferences, which include a large fraction of aliphatic and aromatic compounds in aerosol samples from alkylated PAH homologues. The coupling of GC with MS is increasingly becoming the analytical tool of choice in this regard because of its superior selectivity and sensitivity. Among the most common analyzers including TOF [20], ion trap, and qMS [21, 22], qMS is the most widely adopted technique for routine analysis of PAHs [23]. GC-qMS data acquisition takes advantages of both a full mass scan range (scan mode) and specific ion masses for target analytes (SIM mode). The sensitivity in the SIM mode is higher than that in the scan mode of GC-qMS due to the increased dwell time on each monitored ion for trace analysis in some matrices such as in atmospheric aerosols [24, 25]. GC-TOFMS has a much faster spectral acquisition rate than GC-qMS does, which is up to 500 full mass scans per second [26]. Con-sequently, this system is able to widen the application of GC×GC techniques providing very narrow chromato-graphic peaks, typically 50∼600 ms at the baseline with
sufficient density of data points per chromatographic peak [27]. Environmental samples are generally complex, often with more than hundreds of compounds containing structural isomers and homologues spread over a wide range of concentration and volatility. Accordingly, multidimen-sional separation is an advanced technique offering the possibility of greatly enhanced selectivity using different separation mechanisms for the analysis of complex envi-ronmental samples [28–30]. In this study, a set of columns DB-5×DB-17 ms was applied to increase the resolution and peak capacity. The fast scanning Pegasus 4D TOFMS system was combined to allow efficient processing of data acqui-sition, handling, peak detection, and deconvolution. In the one-dimensional column, a 30 m-long DB-5 ms (5% diphenyl/95% dimethyl polysiloxane) stationary phase was used to separate analytes based on volatility and combined with a 1.17 m-long DB-17 ms column (50% diphenyl/50% dimethyl polysiloxane) allowing relative polarity-based separation. Figure 1 shows GC×GC-TOFMS chromato-grams of aerosol samples collected at day and night during winter in Seoul, South Korea. To compare the identification ability of GC×TOFMS with qMS, analysis with GC-qMS in the scan mode was performed. A comparison of the one-dimensional chromatograms of the same samples ob-tained by GC-qMS is shown in Figure 2. 2D chromatograms enable the visual classification of chemically related com-pounds into groups. It was rare to see that the early-eluting
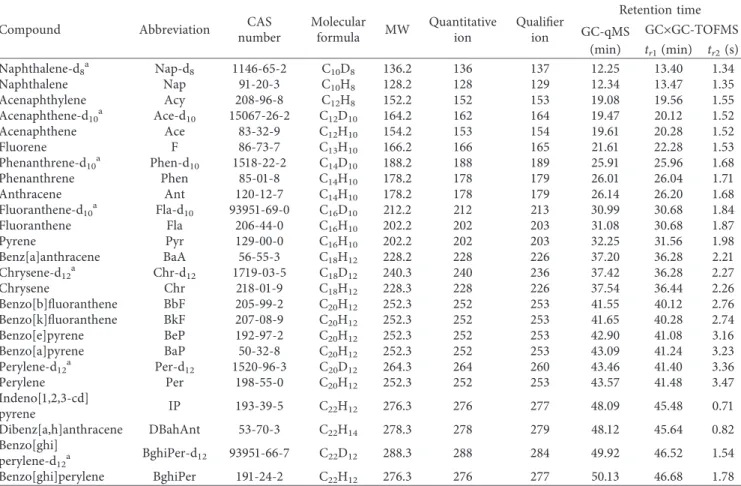
Table 1: Information of target PAHs in the study.
Compound Abbreviation CAS
number Molecular formula MW Quantitative ion Qualifier ion Retention time GC-qMS GC×GC-TOFMS (min) tr1(min) tr2(s) Naphthalene-d8a Nap-d8 1146-65-2 C10D8 136.2 136 137 12.25 13.40 1.34 Naphthalene Nap 91-20-3 C10H8 128.2 128 129 12.34 13.47 1.35 Acenaphthylene Acy 208-96-8 C12H8 152.2 152 153 19.08 19.56 1.55 Acenaphthene-d10a Ace-d10 15067-26-2 C12D10 164.2 162 164 19.47 20.12 1.52 Acenaphthene Ace 83-32-9 C12H10 154.2 153 154 19.61 20.28 1.52 Fluorene F 86-73-7 C13H10 166.2 166 165 21.61 22.28 1.53 Phenanthrene-d10a Phen-d10 1518-22-2 C14D10 188.2 188 189 25.91 25.96 1.68 Phenanthrene Phen 85-01-8 C14H10 178.2 178 179 26.01 26.04 1.71 Anthracene Ant 120-12-7 C14H10 178.2 178 179 26.14 26.20 1.68 Fluoranthene-d10a Fla-d10 93951-69-0 C16D10 212.2 212 213 30.99 30.68 1.84 Fluoranthene Fla 206-44-0 C16H10 202.2 202 203 31.08 30.68 1.87 Pyrene Pyr 129-00-0 C16H10 202.2 202 203 32.25 31.56 1.98 Benz[a]anthracene BaA 56-55-3 C18H12 228.2 228 226 37.20 36.28 2.21 Chrysene-d12a Chr-d12 1719-03-5 C18D12 240.3 240 236 37.42 36.28 2.27 Chrysene Chr 218-01-9 C18H12 228.3 228 226 37.54 36.44 2.26 Benzo[b]fluoranthene BbF 205-99-2 C20H12 252.3 252 253 41.55 40.12 2.76 Benzo[k]fluoranthene BkF 207-08-9 C20H12 252.3 252 253 41.65 40.28 2.74 Benzo[e]pyrene BeP 192-97-2 C20H12 252.3 252 253 42.90 41.08 3.16 Benzo[a]pyrene BaP 50-32-8 C20H12 252.3 252 253 43.09 41.24 3.23 Perylene-d12a Per-d12 1520-96-3 C20D12 264.3 264 260 43.46 41.40 3.36 Perylene Per 198-55-0 C20H12 252.3 252 253 43.57 41.48 3.47 Indeno[1,2,3-cd] pyrene IP 193-39-5 C22H12 276.3 276 277 48.09 45.48 0.71 Dibenz[a,h]anthracene DBahAnt 53-70-3 C22H14 278.3 278 279 48.12 45.64 0.82 Benzo[ghi] perylene-d12a BghiPer-d12 93951-66-7 C22D12 288.3 288 284 49.92 46.52 1.54 Benzo[ghi]perylene BghiPer 191-24-2 C22H12 276.3 276 277 50.13 46.68 1.78 a Internal standard.
Table 2: GC-qMS and GC×GC-TOFMS operating conditions.
Parameters GC-qMS GC×GC-TOFMS
Injector settings
Injection volume 1 μL 1 μL
Inlet mode Splitless Splitless
Carrier gas He (99.999%) He (99.999%)
Carrier gas flow 1.0 mL·min−1 1.3 mL·min−1
Inlet temperature 280°C 300°C
GC oven temperature
Initial temperature 1 min at 60°C 1 min at 60°C
First rate 6°C/min to 310°C 6°C/min to 300°C
Isothermal pause 15 min at 310°C 15 min at 300°C
2nd oven temperature offset — 5°C, relative to the 2nd oven temperature Modulator Modulator temperature offset — 15°C, relative to the 2nd oven temperature Modulator period — 4.00 s
Hot pulse time — 1.00 s
Cool time between stages — 1.40 s
MS
Mass range 40∼550 40∼550
Electron energy 70 eV 70 eV
analytes have an extreme volatility in the chromatogram, as shown in Figure 2. Because of the large losses of these analytes during sample extraction and concentration, particle-associated semivolatile analytes were mainly de-tected and classified according to their aromatic and ali-phatic hydrocarbon groups.
Meanwhile, analytes from the GC-qMS chromatogram were separated based on their vapor pressures or boiling points. The GC×GC technique is rather well suited for group separations, and classifying compounds into chemical-related
groups could be useful for source identification of atmo-spheric aerosols by means of the large amount of chemical data handling. The combined use with TOFMS provides rapid and reliable identification of analytes using their deconvoluted pure mass spectra. The major limitation of qMS is its limited scan rate; therefore, quantification and identification is seriously compromised because of the mass spectral skew due to the variations in ion abundances at different regions of a chromatographic peak [31, 32]. The numbers of identified chromatographic peaks analyzed by
1st dimension retention time (min)
2nd dimension rentention time (sec)
0 0 7:00.00 23:40.00 Masses: TIC 40:20.00 1 2 3 4 1.56172e + 006 (a) 0 0 1 2 3 4
2nd dimension rentention time (sec)
1st dimension retention time (min)
7:00.00 23:40.00
Masses: TIC
40:20.00 1.36252e + 006
(b)
Figure1: GC×GC-TOFMS plots of aerosol samples collected during day (a) and night (b) of winter in Seoul, Korea. A total of 251 and 297
peaks were identified in aerosol samples collected during day (a) and night (b), respectively. Aromatic and aliphatic classes were drawn to divide two regions for ease of viewing.
GC-qMS using the same signal threshold setting from the aerosol samples collected at day and night were 35 and 64, respectively. In the case of results obtained by GC×GC-TOFMS, 251 and 297 peaks from the day- and night-time aerosol samples were, respectively, assigned by individual spectral deconvolution. As a result, phthalic anhydride and 1,2-naphthalic anhydride as the markers of secondary for-mation for gas-phase PAH reactions were identified in the aerosol sample, as shown in Figure 3. Since the products formed through photochemical reactions are often more toxic than their parent PAHs in atmosphere [17], sig-nificant efforts have been expended to identify the pho-tochemical products with PAHs in the fields of atmospheric or environmental sciences. In the case of results obtained using GC-qMS, phthalic anhydride and 1,2-naphthalic anhydride were not detected in the same sample. Limitations of one-dimensional separation have been reported for these photochemical products and complex mixtures of the aerosol sample because of their diverse polarities in a single run [33, 34]. Contrastively, two anhydrides associated with secondary organic aerosol formation were clearly separated and detected by GC×GC-TOFMS. Therefore, it showed advantages for nontarget screening to identify molecular markers or chemical patterns more representative of the aerosol state observed in ambient air.
3.2. Validation of GC-qMS and GC×GC-TOFMS for Quan-tification of PAHs. GC-qMS and GC×GC-TOFMS were
tested individually in order to evaluate their analytical performances. The calibration linearity (regression co-efficient, R2) and relative response factor (RRF) are
pre-sented in Table 3. The RRF is the ratio between a signal produced by an individual native analyte and the corre-sponding isotopically labeled analogue of the analyte (as an internal standard). For calculating RRF, 2 ng of each target PAH and each corresponding deuterated internal standard was spiked, and the relative sensitivity in both the methods was compared. Despite the high-speed scanning perfor-mance of GC×GC-TOFMS, the RRFs obtained by this method were approximately equivalent to those obtained by GC-qMS. RRF expresses the sensitivity of a detector for a given substance relative to a standard substance [35, 36]. Thus, it indicated that the sensitivity of GC×GC-TOFMS relative to target PAHs is comparable in quantitative analysis. Calibration curves were generated using the peak area for the 18 PAHs at seven concentrations ranging from 0.01 to 10 μg/mL. The linearity was assessed by calculating the regression equation and the correlation coefficient by the least squares method, as shown in Table 3. The R2 values
were greater than 0.999 for GC-qMS and 0.99 for GC×GC-TOFMS. Although data processing for quantification by GC×GC-TOFMS was derived from the combined peak areas
15,00,000 10,00,000 5,00,000
10.00 15.00 20.00 25.00 30.00 35.00 40.00 45.00 50.00 55.00
Retention time (min)
Ab und anc e O O O OH N N 0 (a) 15,00,000 10,00,000 5,00,000 0 10.00 15.00 20.00 25.00 30.00 35.00 40.00 45.00 50.00 55.00
Retention time (min)
Ab
unda
nce
(b)
Figure2: Total ion chromatograms of aerosol samples collected in day (a) and night (b) of winter in Seoul, Korea, obtained by GC-qMS. A
total of 35 and 64 peaks were identified in aerosol samples collected during day (a) and night (b), respectively. The analytes were separated based on their boiling points.
for the slices of modulated peaks in contrast to production of the single measured peak by GC-qMS, the results meet the criteria for acceptable linearity within this calibration range.
Naturally, the development of quantitative GC×GC studies based on the quantitative results associated with sophisti-cated implementation for modulated peaks has been delayed
Table3: Relative response factors (RRFs) and calibrations of 18 PAHs obtained by the compared methods.
Compound GC-qMS GC×GC-TOFMS
RRFa Slope Intercept R2 RRF Slope Intercept R2
Nap 1.04 0.515 −0.003 0.9999 1.69 0.560 0.049 0.9971 Acy 1.57 0.808 −0.004 1.0000 1.95 1.026 −0.012 0.9999 Ace 1.03 0.439 0.009 0.9999 1.16 0.553 −0.006 0.9994 F 1.29 0.667 −0.006 1.0000 1.11 0.609 −0.021 0.9997 Phe 1.17 0.572 −0.004 0.9998 1.47 0.763 −0.039 0.9979 Ant 0.98 0.547 −0.017 0.9992 0.93 0.431 −0.010 0.9982 Fla 1.30 0.678 −0.001 1.0000 1.43 0.802 −0.021 0.9995 Pyr 1.31 0.686 −0.004 0.9999 1.62 0.910 −0.055 0.9972 BaA 0.98 0.575 −0.019 0.9997 1.42 0.574 −0.004 0.9998 Chr 1.06 0.563 −0.003 1.0000 1.26 0.651 −0.005 0.9998 BbF 0.99 0.535 −0.008 0.9999 1.69 0.848 −0.028 0.9993 BkF 1.11 0.576 −0.011 0.9998 0.88 0.327 −0.012 0.9977 BeP 0.91 0.455 −0.007 0.9996 0.90 0.530 −0.014 0.9997 BaP 0.88 0.505 −0.014 0.9997 0.83 0.477 −0.030 0.9985 Per 0.89 0.475 −0.008 0.9998 1.11 0.521 -0.023 0.9979 IP 1.37 0.717 −0.023 0.9995 1.25 0.660 -0.062 0.9922 DBahAnt 1.24 0.629 −0.019 0.9996 1.16 0.490 -0.074 0.9898 BghiPer 1.24 0.594 −0.010 1.000 1.53 0.710 -0.036 0.9991
aRRF expresses the sensitivity of a detector for a given analyte relative to its corresponding deuterated internal standards; RRF (A
xCis)/(AisCx), where Axis the peak area of a quantifying ion for a given analyte being measured; Aisis the peak area of a quantifying ion for its corresponding internal standard; Cxis the concentration of a given analyte; and Cisis the concentration of its corresponding internal standard.
1143.2
943.2 1343.2 1543.2
1st dimension retention time (min)
2nd dimen sio n r en ten tio n time (s ec) 0 Masses: 104 126 178 0.855 1.355 1.855 2.355 200000
Figure3: GC×GC chromatograms and mass spectrums of phthalic anhydride (marked as green) and 1,2-naphthalic anhydride (marked as
yellow) in the aerosol sample. GC×GC chromatograms of phthalic anhydride and 1,2-naphthalic anhydride were certified by molecular ions of m/z 148 and 198, respectively.
compared with qualitative reports. Recently, the approach to quantifying multiple analytes at once with comprehensive two-dimensional GC has been extensively studied in ac-cordance with the improvement of data processing for the integration of modulated peaks [37, 38]. In this study, the modulated peaks of each PAH was automatically combined and integrated by the ChromaTOF software based on a similarity of spectra within an allowable time difference between the second dimension peaks in the neighboring slices of the chromatogram. Recovery test was performed by spiking known amounts of the 18 PAH compounds in a prebaked clean filter at a final concentration of 2 μg/mL and analyses of each through all the experiment procedures were compared using the two different methods. Six du-plicate tests were performed, and the results of the recovery are shown in Table 4. The average recoveries were in the range of 90.3 to 158% with relative standard deviations (RSDs) ranging from 3.9 to 28% for GC-qMS, while the recoveries were from 86.3 to 135% for GC×GC-TOFMS, with RSDs ranging from 5.7 to 45%. Most of the targeted PAH compounds were afforded acceptable recoveries, ex-cluding F and Nap by using the two analytical methods due to the high volatility of these compounds. Compared with the reproducibility as expressed in %RSDs, the values ob-tained by GC-qMS were slightly lower than those obob-tained by GC×GC-TOFMS; however, the %RSD values of the targeted PAHs excluding F and Nap were acceptable (<20% RSD). These observations may vary for the versatile GC×GC technique, since the reproducibility of the modulation phase is dependent on the type of modulator, the stability of the stationary phases, and the chemistry of the analyte, re-garding interaction with the stationary phase as presented in several prior studies [39, 40]. The LOD and LOQ were determined based on the standard deviation (SD) of the intersection of the analytical curve (s) and the slope of the
curve (S) as LOD � 3.3 × (s/S) and LOQ � 10 × (s/S). The LOD and LOQ for each PAH compound obtained from both the methods are shown in Table 4. The LOD and LOQ values of the 18 PAH compounds obtained by GC-qMS were similar to the results of previous studies [10, 41, 42]. Thus, the suitability of GC×GC-TOFMS for quantification of PAHs was proven by comparing the results with those obtained using GC-qMS.
4. Conclusion
A fast scanning GC×GC-TOFMS was compared to a GC-qMS for the determination of PAHs in aerosol samples. For sep-aration, identification, and characterization, GC×GC-TOFMS was advantageous over GC-qMS owing to the increased peak capacity, and its results showed enhanced detectability and structured chromatograms for nontarget analysis. The quali-tative mass separation by TOFMS combined with an auto-mated peak-finding capability provided the resolution of complex mixed mass spectra, resulting from overlapping chromatographic peaks and spectral deconvolution of indi-vidual mass spectra for unknown analytes. Furthermore, the obtained quantitative results such as LODs, LOQs, and re-coveries of the 18 target PAHs were approximately equivalent for both the analytical methods. Thus, GC×GC-TOFMS had advantages for the simultaneous quantification and qualifi-cation of PAHs and other organic compounds in a single run. Because of its high degree of separation and capability of spectral deconvolution of overlapping peaks in highly complex samples, comprehensive GC×GC-TOFMS may become a useful platform in many other fields of research.
Conflicts of Interest
The authors declare that they have no conflicts of interest.
Table 4: Limits of detection and quantification and recoveries of 18 PAHs obtained by the compared methods.
Compound LOD
a(ng) LOQb(ng) Recovery ± RSD (%)
GC-qMS GC×GC-TOFMS GC-qMS GC×GC-TOFMS GC-qMS GC×GC-TOFMS
Nap 0.07 0.40 0.21 1.19 94.4 ± 4.2 135 ± 45 Acy 0.17 0.07 0.51 0.22 119 ± 12 116 ± 15 Ace 0.05 0.17 0.16 0.52 105 ± 5.3 105 ± 7.8 F 0.04 0.15 0.13 0.44 158 ± 28 130 ± 29 Phe 0.10 0.34 0.31 1.03 94.5 ± 5.3 86.3 ± 16 Ant 0.19 0.31 0.58 0.92 90.4 ± 4.6 95.1 ± 20 Fla 0.05 0.14 0.16 0.41 90.3 ± 3.9 105 ± 13 Pyr 0.08 0.36 0.25 1.09 97.4 ± 5.3 97.2 ± 13 BaA 0.12 0.09 0.37 0.27 93.4 ± 4.9 86.9 ± 8.2 Chr 0.04 0.08 0.13 0.24 95.8 ± 5.8 101 ± 16 BbF 0.05 0.18 0.15 0.53 96.1 ± 5.7 92.3 ± 10 BkF 0.09 0.35 0.28 1.05 94.2 ± 6.5 105 ± 12 BeP 0.13 0.13 0.40 0.38 92.6 ± 5.8 92.7 ± 5.7 BaP 0.12 0.24 0.37 0.72 93.6 ± 5.3 104 ± 9.0 Per 0.11 0.34 0.32 1.02 93.0 ± 5.5 92.5 ± 8.6 IP 0.15 0.65 0.16 1.94 95.0 ± 5.4 93.9 ± 8.5 DBahAnt 0.13 1.05 0.40 3.14 94.9 ± 5.5 95.8 ± 5.7 BghiPer 0.09 0.22 0.27 0.66 94.6 ± 6.0 87.0 ± 8.5 a
LOD, smallest amount of analyte that is statistically different from the blank;bLOQ, smallest amount of analyte that can be measured with reasonable accuracy.
Acknowledgments
This research was supported by the Bio-Synergy Research Project (no. NRF-2017M3A9C4065961) of the Ministry of Science, ICT, and Future Planning through the National Research Foundation and the Korea Basic Science Institute Grant (no. C37705). This research was also supported by the Basic Science Research Program through the National Re-search Foundation of Korea (NRF) funded by the Ministry of Education (no. NRF-2016R1A2B4015143)
References
[1] IARC, “Polynuclear aromatic compounds, Part 1. Chemical, environmental and experimental data,” IARC Monographs on
the Evaluation of the Carcinogenic Risk of Chemicals to Humans, vol. 32, pp. 1–453, 1983.
[2] World Health Organization, “Environmental health criteria,” in International Programme on Chemical Safety (IPCS), vol. 171, WHO, Geneva, Switzerland, 1998.
[3] V. Vestreng, “Emission data reported to UNECE/EMEP: quality assurance and trend analysis and presentation of WebDab: MSC-W status report 2002,” Research report, University of Oslo, Oslo, Norway, 2002.
[4] L.-B. Liu, L. Yan, J.-M. Lin, T. Ning, K. Hayakawa, and T. Maeda, “Development of analytical methods for polycyclic aromatic hydrocarbons (PAHs) in airborne particulates: a review,” Journal of Environmental Sciences, vol. 19, no. 1, pp. 1–11, 2007.
[5] E. Cavalieri, R. Roth, E. Rogan, C. Grandjean, and J. Althoff, “Mechanisms of tumor initiation by polycyclic aromatic hydrocarbons,” Carcinogenesis, vol. 3, pp. 273–287, 1978. [6] Z. Zelinkova and T. Wenzl, “The occurrence of 16 EPA PAHs
in food—a review,” Polycyclic Aromatic Compounds, vol. 35, no. 2–4, pp. 248–284, 2015.
[7] T. Wenzl, R. Simon, E. Anklam, and J. Kleiner, “Analytical methods for polycyclic aromatic hydrocarbons (PAHs) in food and the environment needed for new food legislation in the European Union,” Trends in Analytical Chemistry, vol. 25, pp. 716–725, 2006.
[8] H. I. Abdel-Shafy and M. S. Mansour, “A review on polycyclic aromatic hydrocarbons: source, environmental impact, effect on human health and remediation,” Egyptian Journal of
Pe-troleum, vol. 25, no. 1, pp. 107–123, 2016.
[9] U. P¨oschl, “Atmospheric aerosols: composition, trans-formation, climate and health effects,” Angewandte Chemie
International Edition, vol. 44, no. 46, pp. 7520–7540, 2005.
[10] M. A. Bari, G. Baumbach, B. Kuch, and G. Scheffknecht, “Particle-phase concentrations of polycyclic aromatic hy-drocarbons in ambient air of rural residential areas in southern Germany,” Air Quality, Atmospheric Health, vol. 3, no. 2, pp. 103–116, 2010.
[11] D. A. Lane, A. Leithead, M. Baroi, J. Y. Lee, and L. A. Graham, “The detection of polycyclic aromatic compounds in air samples by GC×GC-TOFMS,” Polycyclic Aromatic
Com-pounds, vol. 28, no. 4-5, pp. 545–561, 2008.
[12] D. A. Lane and J. Y. Lee, “Detection of known photochemical decomposition products of PAH in particulate matter from pollution episodes in Seoul, Korea,” Polycyclic Aromatic
Compounds, vol. 30, no. 5, pp. 309–320, 2010.
[13] J. Y. Lee, D. A. Lane, J. B. Heo, S.-M. Yi, and Y. P. Kim, “Quantification and seasonal pattern of atmospheric reaction
products of gas phase PAHs in PM2.5,” Atmospheric
Envi-ronment, vol. 55, pp. 17–25, 2012.
[14] R. J. Vreuls, J. Dall¨uge, and U. A. T. Brinkman, “Gas chromatography–time-of-flight mass spectrometry for sen-sitive determination of organic microcontaminants,” Journal
of Microcolumn Separations, vol. 11, no. 9, pp. 663–675, 1999.
[15] C. Weickhardt, F. Moritz, and J. Grotemeyer, “Time-of-flight mass spectrometry: state-of the-art in chemical analysis and molecular science,” Mass Spectrometry Reviews, vol. 15, no. 3, pp. 139–162, 1996.
[16] M. X. Xie, F. Xie, Z. W. Deng, and G. S. Zhuang, “De-termination of polynuclear aromatic hydrocarbons in aerosol by solid-phase extraction and gas chromatography–mass spectrum,” Talanta, vol. 60, no. 6, pp. 1245–1257, 2003. [17] R. Atkinson and J. Arey, “Atmospheric chemistry of gas-phase
polycyclic aromatic hydrocarbons: formation of atmospheric mutagens,” Environmental Health Perspectives, vol. 102, no. 4, pp. 117–126, 1994.
[18] J. D. Pleil, T. L. Vossler, W. A. McClenny, and K. D. Oliver, “Optimizing sensitivity of SIM mode of GC/MS analysis for EPA’s TO-14 air toxics method,” Journal of the Air & Waste
Management Association, vol. 41, no. 3, pp. 287–293, 1991.
[19] D. L. Poster, M. M. Schantz, L. C. Sander, and S. A. Wise, “Analysis of polycyclic aromatic hydrocarbons (PAHs) in environmental samples: a critical review of gas chromato-graphic (GC) methods,” Analytical and Bioanalytical
Chemistry, vol. 386, no. 4, pp. 859–881, 2006.
[20] W. Welthagen, J. Schnelle-Kreis, and R. Zimmermann, “Search criteria and rules for comprehensive two-dimensional gas chromatography–time-of-flight mass spectrometry anal-ysis of airborne particulate matter,” Journal of
Chromatog-raphy A, vol. 1019, no. 1-2, pp. 33–249, 2003.
[21] A. Filipkowska, L. Lubecki, and G. Kowalewska, “Polycyclic aromatic hydrocarbon analysis in different matrices of the marine environment,” Analytica Chimica Acta, vol. 547, no. 2, pp. 243–254, 2005.
[22] K. Ravindra, A. F. L. Godoi, L. Bencs, and R. Van Grieken, “Low-pressure gas chromatography–ion trap mass spec-trometry for the fast determination of polycyclic aromatic hydrocarbons in air samples,” Journal of Chromatography A, vol. 1114, no. 2, pp. 278–281, 2006.
[23] M. Bergknut, K. Frech, P. L. Andersson, P. Haglund, and M. Tysklind, “Characterization and classification of complex PAH samples using GC–qMS and GC–TOFMS,”
Chemo-sphere, vol. 65, no. 11, pp. 2208–2215, 2006.
[24] T. Tran, Characterization of Crude Oils and Atmospheric
Organic Compounds by Using Comprehensive Two-Dimensional Gas Chromatography Technique (GC×GC),
Ph.D. thesis, Applied Sciences, RMIT University, Melbourne VIC, Australia, 2009.
[25] Environmental Protection Agency (EPA), Compendium Method
TO-13A, Determination of Polycyclic Aromatic Hydrocarbons (PAHs) in Ambient Air Using Gas Chromatography/Mass Spectrometry (GC/MS), EPA, Cincinnati, OH, USA, 1999.
[26] S. H. Jeon, J. H. Shin, Y. P. Kim, and Y. G. Ahn, “De-termination of volatile alkylpyrazines in microbial samples using gas chromatography-mass spectrometry coupled with head space-solid phase microextraction,” Journal of Analytical
Science and Technology, vol. 7, no. 1, p. 16, 2016.
[27] A. R. Fern´andez-Alba, TOF-MS within Food and
Environ-mental Analysis, vol. 58, Elsevier, Amsterdam, Netherlands,
2012.
[28] J. H. Winnike, X. Wei, K. J. Knagge, S. D. Colman, S. G. Gregory, and X. Zhang, “Comparison of GC-MS and
GC×GC-MS in the analysis of human serum samples for biomarker discovery,” Journal of Proteome Research, vol. 14, no. 4, pp. 1810–1817, 2015.
[29] L. I. Osemwengie and G. W. Sovocool, “Evaluation of comprehensive 2D gas chromatography-time-of-flight mass spectrometry for 209 chlorinated biphenyl congeners in two chromatographic runs,” Chromatography Research
In-ternational, vol. 2011, Article ID 675920, 14 pages, 2011.
[30] J. Zrostlı́kov´a, J. Hajˇslov´a, and T. ˇCajka, “Evaluation of
two-dimensional gas chromatography–time-of-flight mass spec-trometry for the determination of multiple pesticide residues in fruit,” Journal of Chromatography A, vol. 1019, no. 1-2, pp. 173–186, 2003.
[31] P. Antle, C. D. Zeigler, Y. Gankin, and J. A. Robbat, “New spectral deconvolution algorithms for the analysis of poly-cyclic aromatic hydrocarbons and sulfur heterocycles by
comprehensive two-dimensional gas
chromatography-quadrupole mass spectrometery,” Analytical Chemistry, vol. 85, no. 21, pp. 10369–10376, 2013.
[32] S. Samanipour, P. Dimitriou-Christidis, J. Gros, A. Grange, and J. Samuel Arey, “Analyte quantification with compre-hensive two-dimensional gas chromatography: assessment of methods for baseline correction, peak delineation, and matrix effect elimination for real samples,” Journal of
Chromatog-raphy A, vol. 1375, pp. 123–139, 2015.
[33] P. Mills and W. Guise Jr., “A multidimensional gas chro-matographic method for analysis of n-butane oxidation re-action products,” Journal of Chromatographic Science, vol. 34, no. 10, pp. 431–459, 1996.
[34] R. M. Flores and P. V. Doskey, “Using multidimensional gas chromatography to group secondary organic aerosol species by functionality,” Atmospheric Environment, vol. 96, pp. 310–321, 2014.
[35] S. Pongpiachan, P. Hirunyatrakul, I. Kittikoon, and C. Khumsup, “Parameters influencing on sensitivities of polycyclic aromatic hydrocarbons measured by Shimadzu GCMS-QP2010 ultra,” in Advanced Gas Chromatography–
Progress in Agricultural, Biomedical and Industrial Applica-tions, M. Ali Mohd, Ed., InTech, Rijeka, Croatia, 2012.
[36] European Pharmacopoeia 7.0, Section 2.2.46,
Chromato-graphic Separation Techniques, 2010.
[37] P. Marriott and C. M¨uhlen, “The modulation ratio in com-prehensive two-dimensional gas chromatography: a review of fundamental and practical considerations,” Scientia
Chro-matographica, vol. 8, no. 1, pp. 7–23, 2016.
[38] J. Krupcik, P. Majek, R. Gorovenko, J. Blasko, R. Kubinec, and P. Sandra, “Considerations on the determination of the limit of detection and the limit of quantification in one-dimensional and comprehensive two-one-dimensional gas chro-matography,” Journal of Chromatography A, vol. 1396, no. 117, pp. 117–130, 2015.
[39] P. M. Antle, C. D. Zeigler, N. M. Wilton, and A. Robbat Jr., “A more accurate analysis of alkylated PAH and PASH and its implications in environmental forensics,” International
Journal of Environmental Analytical Chemistry, vol. 94, no. 4,
pp. 332–347, 2014.
[40] T. Cajka, “Gas chromatography–time-of-flight mass spec-trometry in food and environmental analysis,” in
Compre-hensive Analytical Chemistry, I. Ferrer, Ed., pp. 271–302,
Elsevier, Amsterdam, Netherlands, 2013.
[41] B. Lazarov, R. Swinnen, M. Spruyt et al., “Optimisation steps of an innovative air sampling method for semi volatile organic compounds,” Atmospheric Environment, vol. 79, pp. 780–786, 2013.
[42] H. C. Menezes and Z. de Lourdes Cardeal, “Determination of polycyclic aromatic hydrocarbons from ambient air partic-ulate matter using a cold fiber solid phase microextraction gas chromatography–mass spectrometry method,” Journal of
Tribology
Advances in Hindawi www.hindawi.com Volume 2018 Hindawi www.hindawi.com Volume 2018International Journal ofInternational Journal of
Photoenergy
Hindawi www.hindawi.com Volume 2018 Journal ofChemistry
Hindawi www.hindawi.com Volume 2018 Advances inPhysical Chemistry
Hindawi www.hindawi.com Analytical Methods in Chemistry Journal of Volume 2018 Bioinorganic Chemistry and Applications Hindawi www.hindawi.com Volume 2018Spectroscopy
International Journal ofHindawi
www.hindawi.com Volume 2018
Hindawi Publishing Corporation
http://www.hindawi.com Volume 2013 Hindawi www.hindawi.com
The Scientific
World Journal
Volume 2018Medicinal ChemistryInternational Journal of
Hindawi www.hindawi.com Volume 2018
Nanotechnology
Hindawi www.hindawi.com Volume 2018 Journal ofApplied Chemistry
Journal ofHindawi www.hindawi.com Volume 2018 Hindawi www.hindawi.com Volume 2018 Biochemistry Research International Hindawi www.hindawi.com Volume 2018
Enzyme
Research
Hindawi www.hindawi.com Volume 2018 Journal ofSpectroscopy
Analytical Chemistry International Journal of Hindawi www.hindawi.com Volume 2018Materials
Journal of Hindawi www.hindawi.com Volume 2018 Hindawi www.hindawi.com Volume 2018 BioMedResearch International
Electrochemistry
International Journal of Hindawi www.hindawi.com Volume 2018