Effects of Temperature on the Changes of Enzymatic
Activities and Metabolite during Wheat nuruk Fermentation
Se Hee Lee
1, Seong Yeol Baek
1, Ji-Eun Kang
1, Che Ok Jeon
2, Dae-Hyuk Kim
3, Myoung-Dong Kim
4, and Soo-Hwan Yeo
1*
1
Fermented Food Science Division, Department of Agrofood Resources, National Academy of Agricultural Science, RDA, Wanju 55365, Republic of Korea
2
Department of Life Science, Chung-Ang University, Seoul 06974, Republic of Korea
3
Department of Molecular Biology, Chonbuk National University, Jeonju 54896, Republic of Korea
4
Department of Food Science and Biotechnology, Kangwon National University, Chuncheon 24341, Republic of Korea
Received: October 7, 2015 / Revised: November 4, 2015 / Accepted: November 15, 2015
The traditional Korean fermentation agent, called nuruk, is produced by the fermentation of various raw grains (e.g., wheat, barley, millet, rice, soybean, rye, or oats) [6, 13, 20].
Nuruk is generally made by spontaneous fermentation through the natural transfer of fungi (such as Aspergillus sp., Lichtheimia sp., Rhizopus sp., Mucor sp., and yeasts) and bacteria from the environment [10, 19, 20, 29]. These microorganisms produce various amylolytic and proteolytic enzymes that play important roles in starch saccharification and protein digestion. Nuruk plays a significant role in the production of unique flavor and quality of traditional Korean alcoholic beverages during alcoholic fermentation [4, 26,
28]. However, non-saccharogenic or pathogenic microor- ganisms from rotten grains or contaminated environment may sometimes dominate in nuruk when it is fermented under uncontrolled conditions [16, 17]. Nuruk is usually pro- cessed at a moisture content of approximately 26% (w/v) and a temperature of 30 −45°C to ensure vigorous growth of microorganisms and generation of starch-degrading enzymes [1, 21, 26]. Fermentation temperature is one of the most important factors that shape the microbial commu- nity of nuruk [1] and affect the production of effective hydro- lytic enzymes [2]. However, to the best of our knowledge, the effects of temperature on enzymatic activity and metab- olite changes during nuruk fermentation have not yet been fully investigated.
It has been suggested that hydrolytic enzymes as well as the metabolites produced by these enzymes may be Nuruk is a fermentation agent, which has been used for the production of traditional Korean alcoholic beverages. The objective of this study was to investigate the effects of temperature on nuruk fermentation. One wheat nuruk sample was fermented at 36°C for 30 days (TN-A) and another at 45°C for 10 days followed by 36°C for 20 days (TN-B). The activities of α-amylase, glu- coamylase, and acidic protease, as well as metabolite contents were measured. Initially, the enzymatic activities increased rap- idly regardless of the fermentation temperature. After 3 days of fermentation, the enzymatic activities were maintained in TN-A, but gradually decreased in TN-B until the end of fermentation process. Metabolite analysis using
1H-NMR showed that the lev- els of glucose, glycerol, fructose, mannitol, and lactose initially increased quickly and then decreased in TN-A. However, they initially decreased and then were maintained over the fermentation period in TN-B. The contents of glycine, proline, and serine were higher in TN-A than in TN-B. This study suggests that a constant temperature of approximately 36°C is appropriate for achieving high amylolytic and proteolytic activities in the production of wheat nuruk.
Keywords: Nuruk, amylolytic, amylase,
1H-NMR, metabolite
*Corresponding author
Tel : +82-63-238-3610, Fax: +82-63-238-3843 E-mail: [email protected]
© 2015, The Korean Society for Microbiology and Biotechnology
responsible for nuruk fermentation [25]. Because the metabolite composition of fermented nuruk reflects its potential for alcoholic fermentation, parallel studies of enzyme activity and metabolite content are indispensable to understand nuruk fermentation. Proton nuclear magnetic resonance (
1H-NMR) is one of the most comprehensive, relatively easy, and nondestructive methods for simultane- ous analysis of multiple metabolites present in fermented foods [5, 7 −9, 14, 15].
The main objective of this study was to investigate the effects of the initial fermentation temperature on nuruk fer- mentation by comparing enzymatic activities and changes in metabolite contents in nuruk. Our data suggest an appro- priate fermentation temperature for the production of wheat nuruk with high amylolytic and proteolytic activities.
Wheat grain for nuruk fermentation was prepared using the wheat (Triticum aestivum) cultivar Keumkang with some modifications of the traditional manufacturing method [4].
Briefly, dried whole wheat grain (10 kg) was crushed using a grain grinder (Daewoo, Seoul, Korea), sifted using a sieve (2.7 mm mesh size) to remove large particles and soaked in 2.6 L of water for 1 h. Water was added to crushed wheat grain (340 g) at final water content of 26%
and was pressed into a cake-shaped mold (11.8 cm in diameter × 3.1 cm in height). One sample (TN-A) was incu- bated at 36°C for 30 days and the other (TN-B) at 45°C for 10 days and then at 36°C for 20 days to examine changes in enzyme activity and metabolite profiles by temperature succession. All samples were fermented at 70% relative humidity and the temperature was measured every 12 h using a HOBO data logger (Onset Computer Corporation, Bourne, MA, USA). Aliquots were taken after 0, 3, 6, 10, 20, and 30 days of fermentation, and samples were dried at 45°C for 1 week. The nuruk samples were homogenized using a blender (Hanil Science Industry, Incheon, Korea), suspended in deionized water (20 g sample/100 ml water) at 20°C for 30 min, and pH was measured with a pH meter (Thermo Fisher Scientific, Waltham, MA, USA).
Enzymes were extracted from nuruk samples using a method recommended by Megazyme (Wicklow, Ireland).
Briefly, 10 g of nuruk samples were mixed with 50 ml of deionized water using a rotary shaker (200 rpm, Hanil Sci- ence Industry) at 20°C for 30 min followed by centrifugation (10,000 ×g for 20 min at 4°C). Supernatants were stored at -80°C until analysis.
Enzymatic activities were measured as described previ-
ously [24, 25] with modifications. For the measurement of α-amylase activity, 40 μl of enzyme solution was mixed with 40 μl of 2% (w/v) soluble starch solution (dissolved in 0.1 M phosphate buffer, pH 7.0). After incubation at 40°C at 30 min, 20 μl of 1 M HCl was added to stop the reaction, followed by the addition of 100 μl of iodine reagent (0.05 mM I
2and 0.05 mM KI). After color development, the absorbance was measured at 580 nm using SynergyMx reader (BioTek, Winooski, VT, USA). One unit of α-amylase activity was defined as the disappearance of 1 mg of iodine-stained starch per min [24].
For the measurement of glucoamylase activity, 1 ml of 2% (w/v) soluble starch solution was added to 0.2 ml of 200 mM sodium acetate buffer (pH 5.0) and incubated at 40°C for 5 min. Enzyme solution (100 μl) was then added to this mixture and incubated at 40°C for 20 min. The reaction was stopped by adding 0.1 ml of 1 M NaOH. The reaction mix- ture (400 μl) was added to 0.6 ml of 3,5-dinitrosalicylic acid (DNS) solution, and the mixture was heated in a boiling water bath for 5 min. Absorbance was determined at 510 nm with glucose used as a standard as described by Yang et al. [25]. One unit of glucoamylase activity was defined as the amount of glucoamylase liberating 1 mg of glucose from soluble starch in 20 min.
For the measurement of acidic protease activity, 0.5 ml of 2% (w/v) casein solution was added to 1 ml of 0.1 M McIl- vaine buffer (pH 3.0) and incubated with enzyme solution (2 ml) at 40°C for 1 h. The reaction was stopped by adding 0.5 ml of 0.4 M trichloroacetic acid. The reaction mixture was clarified by filtration, and the amount of soluble pep- tides in 1 ml filtrate was measured by incubation with 5 ml of 0.4 M sodium carbonate solution and 1 ml of 20% (w/v) Folin-Ciocalteu’s phenol reagent at 40°C for 30 min, fol- lowed by absorbance measurement at 660 nm [25]. One unit of acid protease activity was defined as the amount of enzyme required to catalyze the release of 1 μg tyrosine per hour at 40°C.
Metabolites produced in the nuruk samples during fer- mentation were measured as previously described [11, 12]
with some modifications. Briefly, a nuruk sample (1 g) was
dissolved in 99.9% deuterium oxide (600 μl, D
2O) contain-
ing 5 mM sodium 2,2-dimethyl-2-silapentane-5-sulfonate
(DSS) and incubated at 20°C for 10 min. After centrifuga-
tion at 10,000 ×g for 5 min, the supernatants were trans-
ferred into 5-mm NMR tubes, and their
1H-NMR spectra
were acquired using a Varian Inova 600-MHz NMR spec-
trometer (Varian, Palo Alto, CA, USA). All analysis were performed in triplicate. Metabolite identification and quantifi- cation were performed using the Chenomx NMR suite pro- gram (v6.1; Chenomx, Canada) as described previously [7, 27]. To investigate metabolite changes during fermentation, statistical redundancy analysis (RDA) was performed using the vegan package [18] in the R programming environment (http ://cran.r-project.org/) on the basis of all metabolites in nuruk samples annotated from the
1H-NMR spectra depending on the fermentation temperature.
The temperatures of both nuruk samples rapidly increased to 45 −46°C during the initial fermentation period, but their profiles during fermentation were markedly differ- ent. The temperature of TN-A nuruk rapidly decreased until approximately 36°C after 3 days of fermentation (Fig. 1A).
However, the temperature of TN-B nuruk was relatively constant and then rapidly decreased to approximately 36°C after 10 days of fermentation according to the change in the set temperature. After this rapid decrease, the tempera- tures of both samples were similar and nearly constant until
the end of fermentation (Fig. 1A). Thus, the increase in the sample temperature above the set temperature was detected only in TN-A, which might be explained by the generation of heat by microbial growth during fermentation [23].
The pH of nuruk samples was approximately pH 6.2 (Fig.
1B). However, the pH values of TN-A and TN-B markedly diverged during fermentation. After 3 days, the pH of TN-A decreased to approximately pH 5.9, whereas that of TN-B increased to approximately pH 6.5. After these initial
Fig. 1. Changes in the temperature (A) and pH (B) of nuruk during the fermentation period.
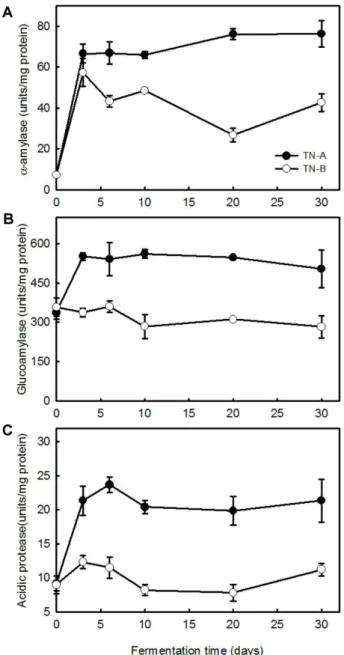
Fig. 2. Changes in the activities of α-amylase (A), glucoam-
ylase (B), and acidic protease (C) of nuruk during fermen-
tation at different temperatures.
changes, the pH value of each sample remained relatively constant. The decrease in pH in TN-A might be related to the production of organic acids, suggesting that the pH pro- file might be a potential indicator of metabolite production by fermentation.
To compare changes in enzymatic activities at different fermentation temperatures, the activities of α-amylase (Fig.
2A), glucoamylase (Fig. 2B), and acidic protease (Fig. 2C) in nuruk samples were measured during the fermentation period. The activities of all three enzymes rapidly increased
Fig. 3. Changes in the contents of glucose (A), fructose (B), mannitol (C), maltose (D), glycerol (E), galactose (F), malate
(G), and lactate(H)] identified in TN-A and TN-B nuruk samples during the fermentation. Data are presented as the average
values ± standard deviations, measured in triplicate.
during the initial fermentation period and then remained rel- atively constant in TN-A. In both samples, α-amylase activ- ity increased quickly but then gradually decreased in TN-B.
The activities of glucoamylase and acidic protease in TN-B nuruk were relatively constant during the entire fermenta- tion period (Fig. 2). The activities of all three enzymes were much lower in TN-B than in TN-A. These results showed that amylolytic and proteolytic activities in nuruk samples maintained at the 36°C were higher than those in the sam- ples first incubated at 45°C and then at 36°C.
The
1H-NMR technique was applied to analyze changes in metabolites such as carbohydrates, organic acids, and amino acids during nuruk fermentation. Glucose, fructose, mannitol, maltose, glycerol, galactose, malate, and lactate were detected as major carbonic compounds (Fig. 3). In TN-B sample, the levels of glucose, fructose, mannitol, maltose, glycerol, and galactose decreased relatively quickly during the early fermentation period and then remained constant until the end of fermentation. In TN-A, the levels of these metabolites were higher than in TN-B during most of the fermentation period, and only decreased at the end of fermentation (30 days). The concentrations of malate and lactate were relatively constant during the entire fermentation period in TN-A, but slightly decreased in TN-B and then increased again.
The concentration-time profiles of amino acids differed
depending on the fermentation temperature (data not shown). The concentrations of glycine, proline, and serine increased more rapidly during the early fermentation period in TN-A than in TN-B; however, after the initial rapid increase, the concentrations of these amino acids decreased rapidly in both samples.
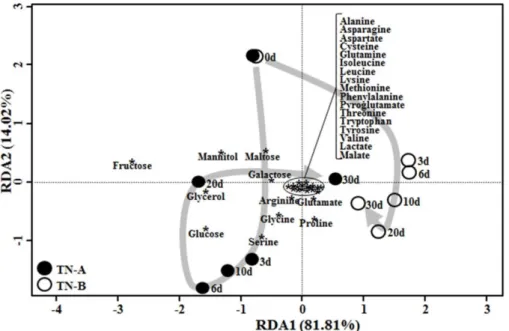
An RDA showed that metabolite changes in nuruk sam- ples fermented at different temperatures were distributed along notably different routes of the biplot over the fermen- tation period (Fig. 4), which suggested that metabolite changes differed depending on the fermentation tempera- ture and production of sugars and amino acids was higher in TN-A than TN-B on 3 −20 days. Previous studies have shown that the fungi from the Aspergillus genus, which are amylolytic and proteolytic enzyme producers [11, 25], are present in larger amounts in TN-A nuruk than in TN-B nuruk [1]. This study suggests that 36°C might be the appropriate temperature for amylolytic and proteolytic activ- ity during wheat nuruk fermentation. This is the first study to investigate the effects of fermentation temperature on the activity of amylolytic and proteolytic enzymes and metabo- lite changes during fermentation of nuruk. However, addi- tional studies on the relationships among microbial communities, metabolite changes, and sensory character- istics (e.g., taste and flavor) are necessary to produce high- quality Korean alcoholic beverages.
Fig. 4. Redundancy analysis (RDA) showing the correlation between nuruk samples and metabolite concentrations during
fermentation of TN-A and TN-B nuruk samples. Numbers beside the data points represent fermentation time (days). Asterisks repre-
sent metabolites on the RDA biplot. Arrows indicate the metabolic routes of nuruk fermentation.
Acknowledgments
This work was carried out with the support of “Cooperative Research Program for Agricultural Science & Technology Develop- ment (PJ00999803)”, Rural Development Administration, Republic of Korea.
References
1. Bal J, Yun SH, Song HY, Yeo SH, Kim JH, Kim JM, et al.
2014. Mycoflora dynamics analysis of Korean traditional wheat-based nuruk. J. Microbiol. 52: 1025−1029.
2. Bechman A, Phillips RD, Chen J. 2012. Changes in selected physical property and enzyme activity of rice and barley koji during fermentation and storage. J. Food Sci. 77: 318−322.
3. Brewing Society of Japan. 1993. Regulation for analysis of alcoholic beverages. pp. 221−228.
4. Choi JS, Jung ST, Kim YJ, Choi JH, Choi HS, Yeo SH. 2011.
Quality characteristics of wheat nuruk and optimum condition of liquid starters for Aspergillus sp. Korean J. Microbiol. Bio- technol. 39: 357−363.
5. Figueiredo IM, Pereira NR, Efraim P, García NH, Rodrigues NR, Marsaioli A Jr, et al. 2006.
1H NMR, a rapid method to monitor organic acids during cupuassu (Theobroma grandiflo- rum Spreng) processing. J. Agric. Food Chem. 54: 4102−
4106.
6. Jang JH. 1989. History of Korea traditional rice wine. Korean J. Diet. Cult. 4: 271−274.
7. Jung JY, Lee SH, Kim JM, Park MS, Bae JW, Hahn Y, et al.
2011. Metagenomic analysis of kimchi, a traditional Korean fermented food. Appl. Environ. Microbiol. 77: 2264−2274.
8. Jung JY, Lee SH, Lee HJ, Jeon CO. 2013. Microbial succes- sion and metabolite changes during fermentation of saeu-jeot, traditional Korean salted seafood. Food Microbiol. 34: 360−
368.
9. Jung JY, Lee SH, Lee HJ, Seo HY, Park WS, Jeon CO. 2012.
Effects of Leuconostoc mesenteroides starter cultures on microbial communities and metabolites during kimchi fermen- tation. Int. J. Food Microbiol. 153: 378−387.
10. Jung MJ, Nam YD, Roh SW, Bae JW. 2012b. Unexpected convergence of fungal and bacterial communities during fer- mentation of traditional Korean alcoholic beverages inocu- lated with various natural starters. Food Microbiol. 30: 112−
123.
11. Kim HR, Kim JH, Bai DH, Ahn BH. 2011. Identification and characterization of useful fungi with α-amylase activity from the Korean traditional nuruk. Microbiol. 39: 278−282.
12. Lee EJ, Shaykhutdinov R, Weljie AM, Vogel HJ, Facchini PJ, Park SU, et al. 2009. Quality assessment of ginseng by
1H- NMR metabolite fingerprinting and profiling analysis. J. Agric.
Food Chem. 57: 7513−7522.
13. Lee HJ, Jung JY, OH YK, Lee SS, Madsen EL, Jeon CO.
2012. Comparative survey of rumen microbial communities
and metabolites across one caprine and three bovine groups, using bar-coded pyrosequencing and
1H nuclear magnetic resonance spectroscopy. Appl. Environ. Microbiol. 78: 5983−
5993.
14. Lee SH, Jung JY, Jeon CO. 2015. Bacterial community dynamics and metabolite changes in myeolchi-aekjeot, a Korean traditional fermented fish sauce, during fermentation.
Int. J. Food Microbiol. 203: 15−22.
15. Lee SJ, Cho SW, Kwon YY, Kwon HS, Shin WC. 2014. Inhibi- tory effects of ethanol extracts from nuruk on oxidative stress, melanogenesis, and photo-aging. Mycobiol. 40: 117−123.
16. Lotong N, Suwanarit P. 1983. Production of soy sauce koji mold spore inoculum in plastic bags. Appl. Environ. Microbiol.
46: 1224−1226.
17. Matsushima K, Yashiro K, Hanya Y, Abe K, Yabe K, Hamasaki T. 2001. Absence of aflatoxin biosynthesis in koji mold (Asper- gillus sojae). Appl. Microbiol. Biotechnol. 55: 771−776.
18. Oksanen J, Blanchet FG, Kindt R, Legendre P, Minchin PR, O’Hara RB, et al. 2015. Package ‘vegan’. R package version 2.2-1. Available: http:// cran.r-project.org/package=vegan Accessed 2015 Jan 27.
19. Shon SK, Rho YH, Kim HJ, Bae SM. 1990. Takju brewing of uncooked rice starch using Rhizopus koji. Korean J. Appl.
Microbiol. Biotechnol. 18: 506−510.
20. Song SH, Lee C, Lee S, Park JM, Lee HJ, Bai DH, et al. 2013.
Analysis of microflora profile in Korean traditional nuruk. J.
Microbiol. Biotechnol. 23: 40−46.
21. Tamang JP. 2012. Plant-based fermented foods and bever- ages of asia, pp. 74. In Hui YH and Evranuz EÖ (eds.), Hand- book of plant-based fermented food and beverage technology, Taylor & Francis, United Kingdom.
22. The Brewing Society of Japan. 1993. The annotation of the official method of analysis of the national tax administration agency. 4: 218−226.
23. van Kleeff BH, Kuenen JG, Heijnen JJ. 1993. Continuous measurement of microbial heat production in laboratory fer- mentors. Biotechnol. Bioeng. 41: 541−549.
24. Xiao Z, Storms R, Tsang A, 2006. A quantitative starch-iodine method for measuring alpha-amylase and glucoamylase activities. Anal. Biochem. 351: 146−148.
25. Yang S, Choi SJ, Kwak J, Kim K, Seo M, Moon TW, et al.
2013. Aspergillus oryzae strains isolated from traditional Korean nuruk: fermentation properties and influence on rice wine quality. Food Sci. Biotechnol. 22: 425−432.
26. Yang S, Lee J, Kwak J, Kim K, Seo M, Lee YW. 2011. Fungi associated with the traditional starter cultures used for rice wine in Korea. Appl. Biol. Chem. 54: 933−943.
27. Yang SO, Kim MS, Liu KH, Auh JH, Kim YS, Kwon DY, et al.
2009. Classification of fermented soybean past during fer- mentation by
1H nuclear magnetic resonance spectroscopy and principal component analysis. Biosci. Biotechnol. Bio- chem. 73: 502−507.
28. Yi SD, Yang JS, Lee GH, Choi SH, Oh MJ. 2001. Effects of
raw materials and various molds on the production of koji. J.
Food Sci. Nutr. 6: 101−106.
29. Yu TS, Yeo SH, Kim HS. 2004. A new species of hyphomy-
cetes, Aspergillus coreanus sp. nov., isolated from traditional Korean nuruk. J. Microbiol. Biotechnol. 14: 182−187.
국문초록
밀누룩 발효기간 동안 효소와 대사체 변화에 대한 온도의 영향 이세희
1, 백성열
1, 강지은
1, 전체옥
2, 김대혁
3, 김명동
4, 여수환
1*
1
농촌진흥청 국립농업과학원 농식품자원부 발효식품과
2
중앙대학교 자연과학대학 생명과학과
3
전북대학교 자연과학대학 분자생물학과
4
![Fig. 3. Changes in the contents of glucose (A), fructose (B), mannitol (C), maltose (D), glycerol (E), galactose (F), malate (G), and lactate(H)] identified in TN-A and TN-B nuruk samples during the fermentation](https://thumb-ap.123doks.com/thumbv2/123dokinfo/5435209.430258/4.892.153.752.293.1056/changes-contents-fructose-mannitol-glycerol-galactose-identified-fermentation.webp)