ISSN 2288-8101(Print) ISSN 2288-8586(Online)
Original Article
RECEIVED July 16, 2014, REVISED August 25, 2014, ACCEPTED October 13, 2014 Correspondence to Young-Kyun Kim
Department of Oral and Maxillofacial Surgery, Section of Dentistry, Seoul National University Bundang Hospital 82 Gumi-ro 173beon-gil, Bundang-gu, Seongnam 463-707, Korea
Tel: 82-31-787-7541, Fax: 82-31-787-4068, E-mail: [email protected]
Copyright © 2014 by The Korean Association of Maxillofacial Plastic and Reconstructive Surgeons. All rights reserved.
CC
This is an open access article distributed under the terms of the Creative Commons Attribution Non-Commercial License (http://creativecommons.org/licenses/
by-nc/3.0) which permits unrestricted non-commercial use, distribution, and reproduction in any medium, provided the original work is properly cited.
Comparative Study of the Early Loading of Resorbable Blasting Media and Sandblasting with Large-grit and
Acid-etching Surface Implants: A Retrospective Cohort Study
Sung-Beom Kim, Young-Kyun Kim, Su-Gwan Kim 1 , Ji-Su Oh 1 , Byung-Hoon Kim 2
Department of Oral and Maxillofacial Surgery, Section of Dentistry, Seoul National University Bundang Hospital,
1
Department of Oral and Maxillofacial Surgery,
2Department of Dental Materials, School of Dentistry, Chosun University
Abstract
Purpose: This study compares the prognosis (the survival rate and marginal bone loss) of resorbable blasting media (RBM) surface implants and sandblasting with large-grit and acid-etching (SLA) surface implants in the early loading.
Methods: This study targeted 123 patients treated by implants installation from January 2008 to March 2010. The loading was initiated in the maxilla within three to four months and in the mandible within one to two months. The types of restoration were single crown and fixed partial prosthesis. Those functioned over one year. The implants were classified by the surface of implants as Group 1: RBM surface (GS III; OSSTEM, Busan, Korea) and, Group 2: SLA surface (Superline; Dentium, Seoul, Korea). The groups were categorized by maxilla and mandible and compared by survival rate, marginal bone loss through clinical records evaluation, and radiographic measurements.
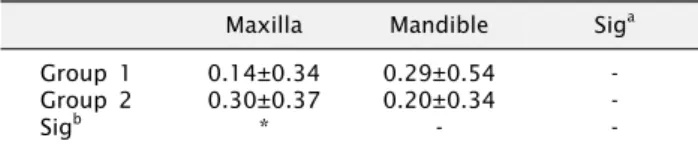
Results: The marginal bone loss in the maxilla was 0.14±0.34 mm (Group 1) and 0.30±0.37 mm (Group 2), a statistically significant difference ( P <0.05). In the mandible those were 0.28±0.54 mm (Group 1) and 0.20±0.33 mm (Group 2), not significant ( P >0.05). There was no significant difference of marginal bone loss between maxilla and mandible by groups.
During observation there was no implant failure, a survival rate of 100%.
Conclusion: Both surfaces showed an excellent survival rate, and the marginal bone loss was not substantial.
Key words: Early dental implant loading, Resorbable blasting media, Sandblasting with large-grit and acid-etching
Introduction
Obtaining excellent primary stability with an absence of micromotion during secondary bone healing is very im- portant for successful implant placement[1]. Early implant loading was thought to impede the osseointegration of im-
plants, so the delayed loading technique (gradual loading
after a three to six month wait), is used[2,3]. Despite this
conventional wisdom, there have been several recent studies
on the stability of immediate or early loading. These studies
report success rates up to 88% to 100%, and a tendency
toward decreasing postsurgical treatment period[4-9].
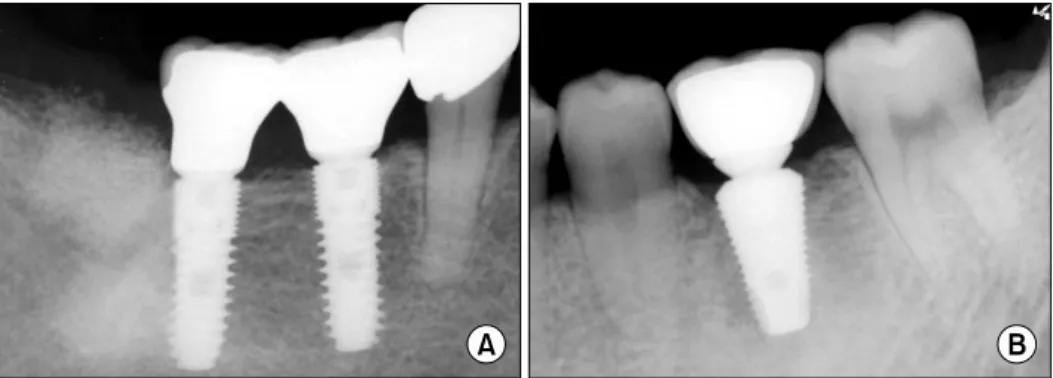
Fig. 1. Periapical views of implants.
(A) Group 1: Resorbable blasting media surface implant (GS III). (B) Group 2: Sandblasting with large-grit and acid-etching surface implant (Superline).
In the third International Team for Implantology (ITI) consensus conference, immediate loading was defined as the insertion of a prosthesis within 48 hours of implant placement, which is loaded by biting with the opposite dentition. Early loading was defined as the initiation of function between 48 hours and 3 months after implant placement[10]. However, because of improvements in the implant surface treatment process, the loading period tends to be shortened; there is a trend of early loading within two months in the mandible and within four months in the maxilla.
Implant surface treatment is important for success, and several surface treatments have been developed. The re- sorbable blasting media (RBM) surface has been the subject of several reports. In 2003, Mazor and Cohen[11] reported that for single crowns observed over 48 months, the mar- ginal bone loss was less than 1 mm, and the success rate was 100%. Sandblasting with large-grit and acid-etching (SLA) surfaces showed stronger bony union in comparison with the machined surface[12,13]. The topography of the implant surface has important effects on bone response[14].
In early loading cases particularly, implant surface treat- ment is important for implant success.
This study compared the survival rate and marginal bone loss of the early loading of RBM surface implants and that of SLA surface implants.
Materials and Methods
The study included patients who were loaded three to four months after implant placement in the maxilla and one to two months after implant placement in the mandible at the Bundang Seoul National University Dental Clinic from January 2008 to March 2010. The informed consents
for this study were explained to the patients before treatment. This study was approved by Seoul National University Bundang Hospital Institutional Review Board (IRB: B-0810-062-010).
Smoking and oral habits were not considered, and pa- tients with controllable systemic diseases were included as study subjects. The type of maxillary prosthesis was either a single crown or fixed partial denture that func- tioned for over a year.
The subjects were divided by implant surface treatment into Group 1: RBM surface (GS III; OSSTEM, Busan, Korea) and Group 2: SLA surface (Superline; Dentium, Seoul, Korea) (Fig. 1). Both the GS III and Superline system were of the internal hex and tapered body type. The mean ob- servation period was 19.05±7.13 months for the maxilla and 18.06±7.88 months for the mandible. During the first year post-treatment, exams was performed at three month intervals, then lengthened to six month intervals thereafter.
Analysis of the medical records and measurements on radiographs, the implant survival rate and the marginal bone loss between the maxilla and the mandible were evaluated along with the implant system.
The marginal bone loss was measured by comparing the marginal bone level around the implant fixture on the periapical radiograph taken at initial implant installation with those of the final follow-up radiograph. For the mar- ginal bone loss, bone height from the implant shoulder to the most distinct radio-opaque area in the mesiodistal alveolar ridge was measured vertically on the radiograph taken by the parallel imaging method and the average was calculated by obtaining the mesiodistal height. Considering the magnification by measuring the height of fixture in the radiograph, the marginal bone loss was calculated.
In each group, the gender distribution, the distribution of
Table 3. Distribution of implant length and width in Group 1 (GS III) and Group 2 (Superline)
Group 1 Group 2
Length (mm) Width (mm) Length (mm) Width (mm)
7.0 8.5 10.0 11.5 12.0 13.0 Total 3.5 4.0 4.5 5.0 Total 8.0 10.0 12.0 14.0 Total 3.4 3.8 4.3 4.8 5.8 6.0 Total Maxilla (n)
Mandible (n) 0 10 2
18 12
19 17
21 1
0 22
0 54
68 9
2 17 17 4
17 24 32 54
68 6 17 14
26 17
1 1
0 38
44 1
0 4
1 5
0 25 40 3
2 0
1 38
44 Table 1. Distribution of implant in Group 1 (GS III) and Group
2 (Superline)
Maxilla Mandible
Group 1 Group 2 Group 1 Group 2 Anterior (n)
Premolar (n) Molar (n) Total (n)
14 13 27 54
0 6 32 38
2 14 52 68
0 1 43 44
Table 2. Distribution of patients in maxilla and mandible groups in Group 1 (GS III) and Group 2 (Superline)
Maxilla Mandible
Group 1 Group 2 Group 1 Group 2
Female (n) Male (n) Total (n)
13 16 29
11 15 26
15 15 30
14 24 38
Table 4. Comparison of marginal bone loss between groups/
maxilla and mandible in each group
Maxilla Mandible Sig
aGroup 1 Group 2 Sig
b0.14±0.34 0.30±0.37
*
0.29±0.54 0.20±0.34
-
- - - Values are presented as mean±standard deviation. -: not significant.
a,b
Student’s t-test. *P <0.05.
the length of implant used, and the diameter were examined. In addition, the survival rate of implants, success rate, and marginal bone loss of the groups were compared by devided into groups of maxilla and mandible. In addi- tion, the survival rate and the marginal bone loss in the maxilla and the mandible of each group were compared.
The survival rate and success rate of implants for the two groups were compared by the Pearson’s chi-square test. The mean bone resorption level of the two groups was compared by Student’s t-test. The SPSS program ver- sion 12.0 (SPSS Inc., Chicago, IL, USA) was used for stat- istical analysis. Null hypotheses of no difference were re- jected if P -values were less than 0.05, or, equivalently, if the 95% confidence intervals of risk point estimates ex- cluded 1.
The criteria for implant success were as follows: (1) no detection of mobility by clinical test; (2) the absence of radiolucency around implants; (3) vertical bone defects during the first year after prosthesis restoration less than 1.5 mm bone loss and less than 0.2 mm of annual bone loss 1 year after function; and (4) the absence of continuous and irreversible symptoms, such as pain, infection, and neurological problems. Using these criteria, the success of implant was evaluated in this study[14].
Results
The average loading times after placement of the final prosthesis in the maxilla were 17.37±5.32 months in
Group 1 and 16.6±17.32 months in Group 2. Averages for the mandible were 17.76±5.82 months in Group 1, and 15.31±9.88 months in Group 2. The number of im- plants in the maxilla and the mandible of each group and the gender distribution of the patients are shown in Table 1, 2. The mean age of the subjects for the evaluation of the maxilla was 54.29±12.64 years, and the mean age of the subjects for the evaluation of the mandible was 54.92±13.00 years. The distribution of the length and di- ameter of the implants in each group is shown in Table 3. In the maxilla, the marginal bone loss around implants was 0.14±0.34 mm in Group 1 and 0.30±0.37 mm in Group 2, and a statistically significant difference between groups was found ( P <0.05). In the mandible, the marginal bone loss was 0.29±0.54 mm in Group 1 and 0.20±0.34 mm in Group 2, no significant difference. In each group, there was no significant difference of the marginal bone loss between the maxilla and mandible (Table 4). There was a 100% survival rate of the implants in both groups.
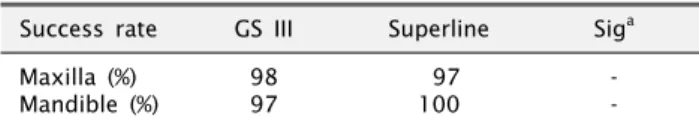
For the maxilla, the success rate was 98% for Group 1
and 97% for Group 2. For the mandible, the success rate
Table 5. Success rate in each group
Success rate GS III Superline Sig
aMaxilla (%) Mandible (%)
98 97
97 100
- - -: not significant.
a