Vol.18, No.3, (2016), pp.30~34 http://dx.doi.org/10.9714/psac.2016.18.3.030
```
1. INTRODUCTION
Stirling cryocoolers have been widely used for cooling of infrared detectors, RF filters and HTS devices to cryogenic temperature. The integral crank driven Stirling cryocooler is solidly based on concepts of direct IR detector mounting on the cryocooler’s cold finger, and the integral construction of the cryocooler and Dewar envelope [1]. The crycooler is applicable to cooling device for compact mobile thermal imaging system, because the cryocooler has compact structure and light weight.
Operation processes of the Stirling cryocooler are based on a cyclic compression and an expansion of working fluid.
Typically, helium is a working fluid. The working fluid is filled in the envelope of the cryocooler at a certain condition of temperature and pressure.
Typical performance factors of the Stirling cryocooler are a required cool-down time to reach the targeted operation temperature of cold end, the cooling capacity and the power consumption. These factors depend on operating conditions of the cryocooler such as a cyclic mean pressure of the working fluid, a rotational speed of driving mechanism, a thermal environment, a targeted operation temperature and etc. [2].
At given charging condition of helium gas, the cyclic mean pressure of helium gas in the cryocooler changes with temperatures of the cold end and the environment. In general, the Stirling cryocooler has small cooling capacity and high power consumption at the elevated environmental temperature or the low cold end temperature.
* Corresponding author: [email protected]
Otherwise, at the low environmental temperature or high cold end temperature, it has the other tendency.
In this study, effects of the cyclic mean pressure of helium gas on performances of the integral crank driven Stirling cryocooler were investigated by numerical analyses using the Sage software [3,4]. This paper presents P-V works in the compression and expansion space, cooling capacity, contribution of losses in the expansion space as a result.
2. SIMULATION MODEL OF A STIRLING CRYOCOOLER
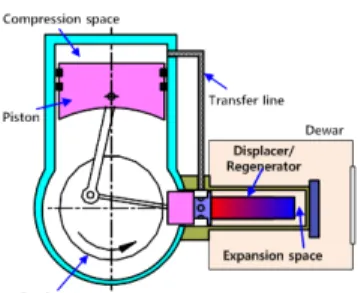
A schematic diagram of the Stirling cryocooler is shown in Fig. 1. The cryocooler consists of a BLDC motor, a crank-rod mechanism, a compression piston, a regenerator, a displacer, a compression space, an expansion space, a crank space, and a Dewar. The Stirling cryocooler has a cooling capacity of 0.5 W at 80 K [5]. Table 1 describes parameters of the simulation on the Stirling cryocooler.
Fig. 1. Schematic diagram of an integral crank driven Stirling cryocooler.
Effects of cyclic mean pressure of helium gas
on performance of integral crank driven stirling cryocooler
Yong-Ju Hong*, Junseok Ko, Hyo-Bong Kim, and Seong-Je Park Korea Institute of Machinery & Materials
(Received 8 August 2016; revised or reviewed 22 September 2016; accepted 23 September 2016)
Abstract
An integral crank driven Stirling cryocooler is solidly based on concepts of direct IR detector mounting on the cryocooler’s cold finger, and the integral construction of the cryocooler and Dewar envelope. Performance factors of the cryocooler depend on operating conditions of the cryocooler such as a cyclic mean pressure of the working fluid, a rotational speed of driving mechanism, a thermal environment, a targeted operation temperature and etc.. At given charging condition of helium gas, the cyclic mean pressure of helium gas in the cryocooler changes with temperatures of the cold end and the environment. In this study, effects of the cyclic mean pressure of helium gas on performances of the Stirling cryocooler were investigated by numerical analyses using the Sage software. The simulation model takes into account thermodynamic losses due to an inefficiency of regenerator, a pressure drop, a shuttle heat transfer and solid conductions. Simulations are performed for the performance variation according to the cyclic mean pressure induced by the temperature of the cold end and the environment. This paper presents P-V works in the compression and expansion space, cooling capacity, contribution of losses in the expansion space.
Keywords: Stirling cryocooler, Cyclic mean pressure, Cooling capacity, Loss
TABLEI
SIMULATION PARAMETER OF THE SRIRLING CRYOCOOLER
Parameter Value
Rotational speed 20 ~ 70 RPS
Swept vol. of comp./exp. space 0.308 / 0.092 cc Diameter of cold finger
Regenerator
8 mm Porosity 0.691 Cyclic mean pressure of helium gas 2.5 ~ 4.0 MPa
(Charging pressure 3.5 MPa@290K)
Operation temperature 80 K
Environmental temperature 240 ~ 340 K
The Sage is used for simulations of the performance of the Stirling cryocooler. Fig. 2 shows the root level of the Sage model of the Stirling cryocooler. Redlich-Kong equation of state is used to model helium gas. In order to know cooling capacity, we need to calculate losses in the expansion space of the Stirling cryocooler. Thermal conduction losses occur along the wall of the cold finger and the regenerator sleeve. Enthalpy flow losses due to imperfect heat transfer arise in the regenerator and the solid conduction of the regenerator material. And enthalpy flow losses and shuttle loss arise in the clearance between the expansion cylinder and the regenerator sleeve.
In the Sage model, the thermal conduction loss and the enthalpy flow loss are taken into account. In the simulation, the cold end temperature is 80 K and rejection temperatures of the cryocooler are equal to the environmental temperature.
Fig. 2. Sage model of the Stirling cryocooler.
Fig. 3. Cyclic mean pressure variation with changes of the cold end temperature and environmental temperature.
Efficiency of the motor is assumed to be constant.
Radiation loss is not considered in the calculation of the cooling capacity.
In the Stirling cryocooler, helium gas is filled in the cryocooler at given conditions of temperature and pressure.
So, the cyclic mean pressure of helium in the cryocooler changes with density changes due to the variation of temperatures of the cold end and the environment. Fig. 3 shows the cyclic mean pressure variation with changes of the cold end temperature and environmental temperature.
The cyclic mean pressure is determined by using isothermal processes with ideal gas assumptions [6].
Simulations are performed for case of the given cyclic mean pressure, cases for the given charging condition with the variation of the environmental temperature and cold end temperature.
3. SIMULATION RESULTS
3.1. Case for Given Cyclic Mean Pressure
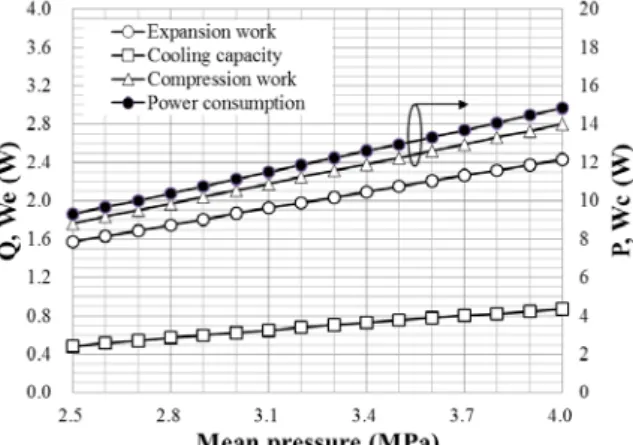
Fig. 4 shows the cooling capacity, the power consumption, the expansion work, and the compression work of the Stirling cryocooler. The simulation is performed for the rotational speed of 60 RPS and the environmental temperature of 300 K. The cooling capacity and power consumption increase as the cyclic mean pressure of helium gas increases, which is mainly caused by increases of the expansion work and compression work.
The increase of 56% in the mean pressure induces an increase of 56% in the power consumption and an increase of 75% in the cooling capacity. As shown in Fig. 4, at the cyclic mean pressure of 3.5 MPa, the cooling capacity without the radiation loss and the power consumption of the cryocooler are 0.75 W and 13.0 W, respectively. And the expansion work and the compression work are 2.15 W and 10.1 W, respectively. The 35% of the expansion work is converted into the cooling capacity
Fig. 5 shows losses in the expansion space. The total loss is about 60 ~ 70% of the expansion work. A major loss in the expansion space is the enthalpy flow through the regenerator. Enthalpy losses from the regenerator and the clearance increase as the mean pressure increases.
Fig. 4. Performance of the Stirling cryocooler with variations of the cyclic mean pressure of helium gas.
Fig. 5. Losses of the expansion space with variations of the the cyclic mean pressure of helium gas.
This must have been due to increases of the mass flow rate through the regenerator and the clearance.
On the other hand, the conduction loss remains steady due to no changes in the cold end temperature and the rejection temperature.
3.2. Case for Given Condition of Charging Pressure with Variation of Environmental Temperature
Fig. 6 shows P-V diagrams of the compression and the expansion space of the cryocooler with variations of the mean pressure due to the change of the environmental temperature. Simulations are performed for cases over a range of environmental temperatures from 240 to 340 K at the rotational speed of 60 RPS. The charging condition is the temperature of 290 K and the pressure of 3.5 MPa.
As shown in Fig. 6, P-V diagrams shift to the high pressure region with increases of the environmental temperature. Mean pressures, at environmental temperatures of 260, 300, and 340 K are 2.88, 3.28 and 3.68 MPa, respectively. Spans of the pressure variation increase slightly as the environmental temperature increase. In the compression space, amplitudes of pressure wave for environmental temperatures of 260, 300, and 340 K are 0.366, 0.421, and 0.477 MPa, respectively. And, in the expansion space, amplitudes of pressure wave are 0.340, 0.398, and 0.448 MPa, respectively.
Fig. 6. P-V diagrams of the compression space and the expansion space.
Fig. 7. Performances in the expansion space of the cryocooler at the given condition of the charging pressure.
The pressure difference between the compression space and the expansion space increases as the environmental temperature increases.
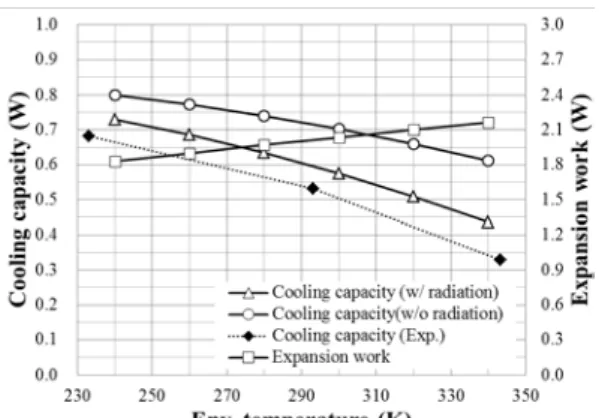
Fig. 7 shows predicted performances in the expansion space of the cryocooler at the charging pressure of 3.5 MPa and the rotational speed of 60 RPS. The expansion work increases as the environment temperature increases. This result shows effects of variations of the cyclic mean pressure on the performance of the Stirling cryocooler.
In order to compare simulation results with the cooling capacity from experiments, the radiation loss should be considered in the predicted cooling capacity from the Sage.
As shown in Fig. 7, the cooling capacity with the radiation loss becomes quite low than the predicted cooling capacity without the radiation loss. Hence, the radiation loss was estimated from the boil-off measurement. At the environmental temperature of 340 K, cooling capacities without the radiation loss and with the radiation loss are 0.61 W and 0.44 W, respectively. And, at the environmental temperature of 240 K, those are 0.80 W and 0.73 W, respectively.
The cooling capacity from the simulation and the experiment are slightly different, but exhibit the same tendency. The variation of the mean pressure, which arises from the change of the environmental temperature, should be considered to predict the performance of the Stirling cryocooler.
Fig. 8. Performances in the compression space of the cryocooler at the given condition of the charging pressure.
Fig. 9. Losses in the expansion space of the cryocooler at the given condition of the charging pressure.
The compression increases as the environment temperature increases, as shown in Fig. 8.
The enthalpy flow loss through the regenerator and the conduction loss increase as the environmental temperature increases. The total loss increases with the environmental temperature, up to 1.55 W at 340 K, as shown in Fig. 9.
The total loss in the environmental temperature of 240, 300, and 340 K are 1.03, 1.33, and 1.55 W, respectively.
A major loss in the expansion space is the enthalpy flow through the regenerator, and it exceeds half of the total loss in the Stirling cryocooler.
Fig. 10. P-V diagrams of the compression space.
Fig. 11. P-V diagrams of the expansion space.
Fig. 12. Performances in the expansion space with the cold end temperature.
3.3. Case for Given Condition of Charging Pressure with Variation of Cold End Temperature
Fig. 10 and 11 show P-V diagram of the cryocooler.
Simulations are performed for cases over a range of cold end temperatures from 80 to 300 K at the rotational speed of 60 RPS and the environmental temperature of 300 K.
The charging condition of the gas is the temperature of 290 K and the pressure of 3.5 MPa.
As shown in Fig. 10 and 11, it is obvious that the compression work increases with cooldown, and the expansion work decrease.
Fig. 13. Losses in the expansion space with the cold end temperature.
Fig. 14. Mass flow rate through the regenerator and the clearance with the cold end temperature.
Fig. 12 shows predicted performances in the expansion space of the cryocooler. The cooling capacity with the radiation loss increases as the environment temperature increases, from 0.53 W @ 80 K up to 2.6 W @290 K.
The power consumption increases as the cold end temperature decreases, which is mainly caused by increases of the expansion work and compression work as shown in Fig. 10 and 11. Cooling capacities with the radiation loss from the simulation and the experiment exhibit the same tendency at the low temperature range.
Fig. 13 shows losses in the expansion space. The total loss is increases as the cold end temperature decreases.
Results show that the dominant loss factor is the enthalpy flow loss through the regenerator in the low temperature range, but that is the enthalpy flow loss through the clearance in the high temperature range.
These phenomena arise out of the distribution of the mass flow rate through the regenerator and the clearance.
As shown in Fig. 14, the large fraction of helium gas passes through the clearance in the high temperature range, but the small fraction of helium gas passes through that in the low temperature range. And what’s more, there is a big temperature difference between the solid and helium gas in the expansion space because the cryocooler has large cooling capacity in the high temperature range, and the heat transfer in the clearance is insufficient to cool helium gas passing through the clearance.
4. SUMMARY
In this study, effects of the cyclic mean pressure on performances of the integral crank driven Stirling cryocooler were investigated by numerical analyses using the Sage software.
The variation of the mean pressure, which arises from the change of the environmental temperature and the cold end temperature, should be considered to predict the performance of the Stirling cryocooler. The enthalpy flow loss through the regenerator and the conduction loss increase as the environmental temperature increases or the cold end temperature decreases. In the total loss in the expansion space, a major loss is the enthalpy flow through the regenerator at low cold end temperature.
ACKNOWLEDGMENT
This research was supported by the Space Core Technology Development Program of the National Research Foundation (NRF) funded by the Ministry of Science, ICT & Future Planning (2015M1A3A3A03 027288).
REFERENCES
[1] G. Walker, Miniature Refrigerators for Cryogenic Sensors and Cold Electronics, Oxford: Clarendon Press, pp. 89-120, 1989.
[2] M. Donabedian, Spacecraft Thermal Control Handboolk, Volume II:
Cryogenics, El Segundo: The Aerospace Press, pp. 121-129, 2002.
[3] D. Gedeon, Sage User’s Guide, Athens: Gedeon Associates, 2013 [4] D. Gedeon, “Sage : Object-Oriented Software for Cryocooler
Design,” Cryocoolers, Vol. 8, pp. 281-292, 1995.
[5] Y. J. Hong, H. B. Kim, S. J. Park, “Effects of the environmental temperature on the performance of the Stirling cryocooler,” Journal of KIASC, Vol. 11, No. 3, pp. 65-68, 2009 (In Korean).
[6] https://www.ohio.edu/mechanical/stirling/