Journal of the American Heart Association
ORIGINAL RESEARCH
Treatment Intensification for Elevated Blood Pressure and Risk of Recurrent Stroke
Beom Joon Kim , MD, PhD; Yong- Jin Cho , MD, PhD; Keun- Sik Hong, MD, PhD; Jun Lee, MD, PhD;
Joon- Tae Kim , MD, PhD; Kang Ho Choi , MD, PhD; Tai Hwan Park , MD, PhD; Sang- Soon Park, MD;
Jong- Moo Park, MD, PhD; Kyusik Kang , MD, PhD; Soo Joo Lee , MD, PhD; Jae Guk Kim , MD, PhD;
Jae- Kwan Cha, MD, PhD; Dae- Hyun Kim, MD, PhD; Byung- Chul Lee , MD, PhD; Kyung- Ho Yu, MD, PhD;
Mi- Sun Oh , MD, PhD; Dong- Eog Kim, MD, PhD; Wi- Sun Ryu, MD, PhD; Jay Chol Choi , MD, PhD;
Wook- Joo Kim, MD, PhD; Dong- Ick Shin, MD, PhD; Sung Il Sohn , MD, PhD; Jeong- Ho Hong, MD, PhD;
Ji Sung Lee , PhD; Juneyoung Lee , PhD; Moon- Ku Han , MD, PhD; Philip B. Gorelick , MD, MPH;
Hee- Joon Bae , MD, PhD
BACKGROUND: It remains unclear whether physicians’ attitudes toward timely management of elevated blood pressure affect the risk of stroke recurrence.
METHODS AND RESULTS: From a multicenter stroke registry database, we identified 2933 patients with acute ischemic stroke who were admitted to participating centers in 2011, survived at the 1- year follow- up period, and returned to outpatient clin- ics ≥2 times after discharge. As a surrogate measure of physicians’ attitude, individual treatment intensification (TI) scores were calculated by dividing the difference between the frequencies of observed and expected medication changes by the frequency of clinic visits and categorizing them into 5 groups. The association between TI groups and the recurrence of stroke within 1 year was analyzed using hierarchical frailty models, with adjustment for clustering within each hospital and relevant covariates. Mean±SD of the TI score was −0.13±0.28. The TI score groups were significantly associated with increased risk of recurrent stroke compared with Group 3 (TI score range, −0.25 to 0); Group 1 (range, −1 to −0.5), adjusted hazard ratio (HR) 13.43 (95% CI, 5.95– 30.35); Group 2 (range, −0.5 to −0.25), adjusted HR 4.59 (95% CI, 2.01– 10.46); and Group 4 (TI score 0), adjusted HR 6.60 (95% CI, 3.02– 14.45); but not with Group 5 (range, 0– 1), adjusted HR 1.68 (95% CI, 0.62– 4.56).
This elevated risk in the lowest TI score groups persisted when confining analysis to those with hypertension, history of blood pressure- lowering medication, no atrial fibrillation, and regular clinic visits and stratifying the subjects by functional capacity at discharge.
CONCLUSIONS: A low TI score, which implies physicians’ therapeutic inertia in blood pressure management, was associated with a higher risk of recurrent stroke. The TI score may be a useful performance indicator in the outpatient clinic setting to prevent recurrent stroke.
Key Words: clinical inertia ■ hypertension ■ prevention ■ stroke ■ treatment intensification
V
ascular events after ischemic stroke can be pre- vented by management of risk factors and ad- ministration of the appropriate antithrombotic.1 Blood pressure (BP) control has been a mainstay in the prevention of recurrent stroke.2 Although loweringBP is an effective therapy for reducing the risk of re- current stroke, the best time for starting antihyperten- sive drugs or how quickly BP should be reduced is not clear in patients with acute stroke.3 Clinicians may find themselves in a state of clinical equipoise concerning
Correspondence to: Hee- Joon Bae, MD, PhD, Department of Neurology and Cerebrovascular Center, Seoul National University Bundang Hospital, 82 Gumi- ro 173 Beon- gil, Bundang- gu, Seongnam- si, 13520 Gyeonggi- do, Republic of Korea. E- mail: [email protected]
Supplementary Material for this article is available at https://www.ahajo urnals.org/doi/suppl/ 10.1161/JAHA.120.019457 For Sources of Funding and Disclosures, see page 8.
© 2021 The Authors. Published on behalf of the American Heart Association, Inc., by Wiley. This is an open access article under the terms of the Creative Commons Attribution- NonCommercial- NoDerivs License, which permits use and distribution in any medium, provided the original work is properly cited, the use is non- commercial and no modifications or adaptations are made.
JAHA is available at: www.ahajournals.org/journal/jaha
the best timing and rate of BP- lowering treatment after stroke,3 and this uncertainty may lead to poor BP con- trol in real- world practice.
Elevated BP is frequently encountered in a stroke prevention clinic, and adequate BP control after stroke may not be easily achieved.4 Only 30% to 40% of sur- vivors of stroke had their BP reasonably controlled during the 1- year follow- up at veterans hospitals.5,6 A quarter of patients with hypertension discontinued an- tihypertensive medications within 2 years after index stroke.7 Medication nonadherence may only partially explain the failure to control BP successfully, and thus a better understanding of the reasons for such failure is needed. Physicians’ attentiveness toward elevated BP may be an underlying factor.8 However, it has not been well studied at least in terms of secondary prevention of stroke.
Among the various measures of physicians’ atti- tudes, the treatment intensification (TI) score has been widely applied.8 The TI score, which ranges from −1 to +1, is obtained by dividing the difference between the frequencies of observed medication changes and expected medication changes (according to given standards) by the frequency of clinic visits. A 0 score implies perfect responsiveness, −1 implies complete
negligence, and +1 indicates excessive aggression.
Studies on the TI score have been reported in various clinical settings as its median or mean values ranging from −0.43 to −0.25,8– 10 but there has been no study in a stroke population.
In this context, using a prospective multicenter stroke registry database, this study aimed to describe physicians’ attitudes toward BP control, quantified by the TI score, and its effect on the risk of recurrent stroke in patients with acute ischemic stroke.
METHODS Data Availability
Anonymized data used in the current study can be obtained through an appropriate request to the cor- responding author.
Study Design and Subjects
This retrospective, observational study was conducted among consecutive patients with acute ischemic stroke who were registered into CRCS- K (Clinical Research Collaboration for Stroke in Korea), a nationwide, pro- spective, multicenter clinical stroke registry database.11 Data on eligible patients’ BP, clinic visits, and prescrip- tion of BP- lowering medications were extracted retro- spectively from medical records. Information on other clinical data and clinical outcomes after index stroke, available for up to 1 year after the stroke, were directly obtained from the registry database. The local institu- tional review boards approved data collection for the CRCS- K registry in order to monitor and improve the quality of stroke care in all participating centers with a waiver of patient consent. Additional data collection and analysis for this study were approved further at the study centers (institutional review board approval number, B- 1103/124- 111).
During the year 2011, 5528 patients with acute isch- emic stroke were admitted to the participating centers and entered into the registry database. Among these patients, we selected the study subjects by applying the following algorithm: (1) the availability of clinical out- comes (n=4279), (2) the availability of BP data at clinic visits after discharge (n=3470), (3) ≥2 visits during the follow- up (n=2946), and (4) exclusion of those who had died during the 1- year follow- up period (n=2933; for baseline characteristics of 2715 excluded cases, see Table S1).
BP and Prescription Data Collection and TI Score Calculation
Physicians at clinics prescribe antihypertensive medi- cations at their discretion and according to current guidelines,12,13 but their dosage and types depend on
CLINICAL PERSPECTIVE
What Is New?
• Treatment intensification score, calculated by dividing the difference between observed and predicted blood pressure- lowering medication changes by the number of the clinic visit, can be generated and evaluated among patients with ischemic stroke.
• Treatment intensification score, which repre- sents physicians’ attentiveness toward ab- normal blood pressure measurements, was associated with an increased risk of recurrent events among patients with ischemic stroke.
What Are the Clinical Implications?
• Treatment intensification score may be used as a performance measure of physicians’ at- tentiveness in the secondary prevention after ischemic stroke.
Nonstandard Abbreviations and Acronyms
CRCS- K Clinical Research Collaboration for Stroke in Korea
TI treatment intensification
patient characteristics, including expected medication adherence and functional status, comorbidities, and stroke mechanisms. We collected all outpatient blood pressure measurements for all study subjects, meas- ured by means of an automated oscillometric blood- pressure cuff.
BP measurements and prescription of antihyper- tensive medications were collected retrospectively by review of medical records. The BP- lowering medica- tions were defined in the current study as oral drugs given to patients to lower BP and were classified as renin- angiotensin receptor antagonists, angiotensin- converting- enzyme inhibitors, beta blockers, calcium channel blockers, and diuretics. Some alpha blockers and vasodilators approved as antihypertensive drugs by the Korean Food and Drug Administration were also regarded as BP- lowering medications.
The TI score during the follow- up period was cal- culated for each patient using the following formula8:
For those who had a recurrent stroke during the fol- low- up, BP and prescription data before the recurrent event were used to generate the individual TI score.
Observed medication changes included the changes in the regimen of BP- lowering medications, such as dose increment, alteration in a drug class, and addition of a new compound. Joint National Committee VII was used as the standard for predicted medication changes.14 In brief, a medication change was predicted in case systolic BP was ≥130 mm Hg or diastolic BP was ≥80 mm Hg in patients with diabetes mellitus or chronic kidney disease or systolic BP was
≥140 mm Hg or diastolic BP was ≥90 mm Hg without such comorbidities.
Clinical Data Collection
We retrieved demographic data, stroke characteris- tics, and other clinical data of the study participants from the CRCS- K registry database. Recurrent stroke events and mortality were prospectively captured through telephone interviews by experienced and trained study coordinators or direct interviews by cli- nicians during clinic visits. We collected data on re- current stroke within 1 year after the index stroke, permitting a 2- month grace period (ie, 12±2 months).
Details of definitions used in the CRCS- K registry have been published elsewhere.11
Statistical Analysis
Descriptive analyses were summarized as mean±SD or medians (interquartile range) for continuous
variables or frequencies with percentages for cat- egorical variables. Study subjects were categorized into 5 groups: group 1 (TI score range, −1 to −0.5), group 2 (−0.5 to −0.25), group 3 (−0.25 to 0), group 4 (0), and group 5 (0– 1), as the number of subjects with TI score 0 was 1209 (41.2%). Baseline characteristics were summarized and compared according to those groups using the chi- square test or 1- way ANOVA, as appropriate. To estimate associations between the TI score groups and recurrent stroke, we used a multivariable log- normal frailty model to adjust for clustering within each hospital.15 Hospitals were in- corporated as a random effect in the frailty models.
The following multivariable models were constructed:
(1) model 1 with no covariates; (2) model 2 with age, sex, and National Institutes of Health Stroke Scale score at arrival; and (3) model 3 with covariates of model 2 and other clinically relevant variables such as stroke mechanism, hypertension, diabetes mel-
litus, dyslipidemia, atrial fibrillation, and prestroke disability (modified Rankin Scale score ≥1 before the index stroke). Group 3, which incorporated the mean of TI score, was taken as a reference category to compare both ends of the TI score strata.
The formula for the TI score inherently implies that subjects with a TI score of 0 are heterogeneous, in- cluding patients with perfect BP control, nonhyper- tensives, or debilitated patients who could not return to outpatient clinics. To assess the robustness of our findings, we performed several post hoc sensitivity analyses, as follows: restricting analysis subsets to those who were diagnosed with hypertension before or during the stroke admission; were prescribed BP- lowering medications; did not have atrial fibrillation because patients with atrial fibrillation tended to have a lower BP trajectory16; visited outpatient clinics for
≥3, ≥4, and ≥5 times; and stratifying the study sub- jects according to functional capacity at the time of discharge (modified Rankin Scale score 0– 2 versus 3– 5).
A significance level was set as a 2- tailed P value of <0.05. Frailty models were fitted using the frailt- yHL package version 2.3.17 Statistical analyses were performed using R for statistical computing version 4.0.2 (R Foundation for Statistical Computing, Vienna, Austria).
RESULTS
Of 2933 patients eligible for this study, the mean age was 67±13 years, and 61% were men. The median (Frequency of observed medication changes − Frequency of predicted medication changes based on given standards)
Frequency of clinic visits
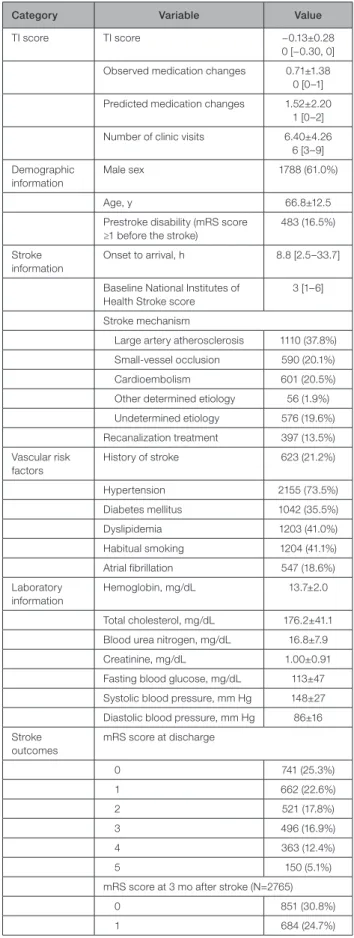
baseline National Institutes of Health Stroke Scale score was 3 (interquartile range, 1– 6), and 17% were functionally disabled (modified Rankin Scale score ≥1) before the index stroke. Hypertension was diagnosed in 74% (Table 1).
During a mean follow- up period of 350±66 days, the mean frequency of clinic visits was 6.4±4.3.
Medication changes were observed 2086 times in 1063 patients (36.2%); the mean was 0.71±1.38 times per patient, and the median was 0. Medication changes were expected 4472 times in 1654 patients (56.4%); the expected mean was 1.52±2.20 times per patient, and the median was 1. The mean TI score of the entire study population was −0.13±0.28, and the median was 0 (for a histogram of TI score, see Figure S1). The TI score was 0 in 41.2% of the study subjects (n=1209). Recurrent stroke occurred in 175 patients (6.0%).
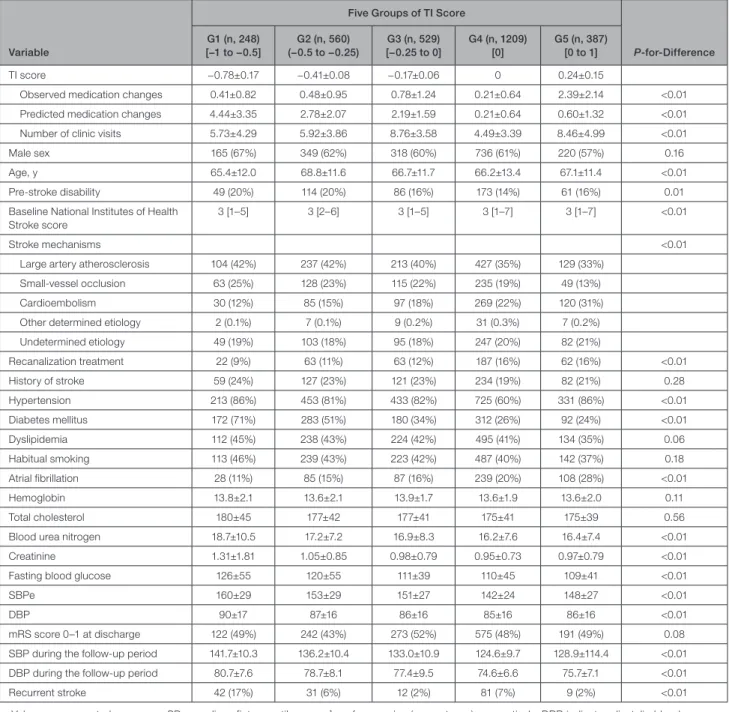
We categorized the study subjects into 5 groups by their TI scores to explore associations of TI scores with baseline profiles and the risk of recurrent stroke.
Compared with the middle TI score group (group 3), the lowest TI score group (group 1) was more likely to have a prestroke disability, diabetes mellitus, and a higher mean systolic BP at arrival. The proportion of cardioembolic stroke was greater in groups 4 and 5.
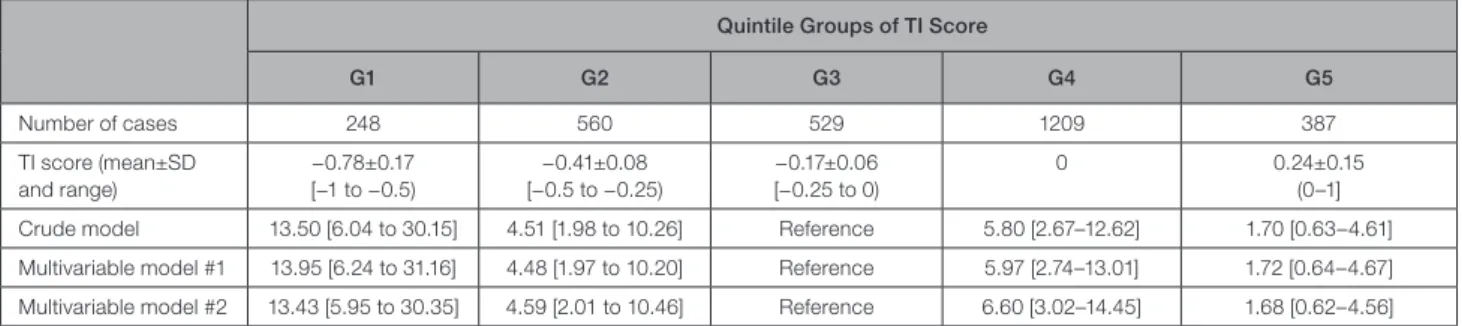
Recurrent stroke occurred most frequently in group 1 (G1; Figure 1; Table 2). The multivariable analyses considering clustering within hospitals and adjusted for relevant covariates showed that the G1 (adjusted hazard ratio [HR], 13.43; 95% CI, 5.95– 30.35), group 2 (adjusted HR, 4.59; 95% CI, 2.01– 10.46), and G4 (ad- justed HR, 6.60; 95% CI, 3.02– 14.45) had a significantly
Table 1. Baseline Characteristics of the Included Patients (n=2933)
Category Variable Value
TI score TI score −0.13±0.28
0 [−0.30, 0]
Observed medication changes 0.71±1.38 0 [0– 1]
Predicted medication changes 1.52±2.20 1 [0– 2]
Number of clinic visits 6.40±4.26 6 [3– 9]
Demographic information
Male sex 1788 (61.0%)
Age, y 66.8±12.5
Prestroke disability (mRS score
≥1 before the stroke)
483 (16.5%)
Stroke information
Onset to arrival, h 8.8 [2.5– 33.7]
Baseline National Institutes of Health Stroke score
3 [1– 6]
Stroke mechanism
Large artery atherosclerosis 1110 (37.8%) Small- vessel occlusion 590 (20.1%)
Cardioembolism 601 (20.5%)
Other determined etiology 56 (1.9%) Undetermined etiology 576 (19.6%) Recanalization treatment 397 (13.5%) Vascular risk
factors
History of stroke 623 (21.2%)
Hypertension 2155 (73.5%)
Diabetes mellitus 1042 (35.5%)
Dyslipidemia 1203 (41.0%)
Habitual smoking 1204 (41.1%)
Atrial fibrillation 547 (18.6%)
Laboratory information
Hemoglobin, mg/dL 13.7±2.0
Total cholesterol, mg/dL 176.2±41.1 Blood urea nitrogen, mg/dL 16.8±7.9
Creatinine, mg/dL 1.00±0.91
Fasting blood glucose, mg/dL 113±47 Systolic blood pressure, mm Hg 148±27 Diastolic blood pressure, mm Hg 86±16 Stroke
outcomes
mRS score at discharge
0 741 (25.3%)
1 662 (22.6%)
2 521 (17.8%)
3 496 (16.9%)
4 363 (12.4%)
5 150 (5.1%)
mRS score at 3 mo after stroke (N=2765)
0 851 (30.8%)
1 684 (24.7%)
(Continued)
Category Variable Value
2 473 (17.1%)
3 344 (12.4%)
4 277 (10.0%)
5 136 (4.9%)
6 0
mRS score at 1 y after stroke (N=2768)
0 1036 (37.4%)
1 639 (23.1%)
2 404 (14.6%)
3 314 (11.3%)
4 224 (8.1%)
5 151 (5.5%)
Recurrent stroke within 1 y after stroke
175 (6.0%)
F/U for stroke, d 350±66
Values are presented as means±SDs, medians [interquartile ranges], or frequencies (percentages), respectively. mRS indicates modified Rankin Scale; and TI, treatment intensification.
Table 1. Continued
elevated risk of recurrent stroke during the first year after stroke when compared with group 3, but not with group 5 (adjusted HR, 1.68; 95% CI, 0.62– 4.56;
Table 3).
We performed several sensitivity analyses to demonstrate the robustness of our results (Figure 2).
The increased risk of recurrent stroke of G1 persisted in the subgroups who were diagnosed with hyperten- sion, who were prescribed on BP- lowering medica- tions, and who did not have atrial fibrillation. We further repeated the main frailty models in those with the fre- quency of clinic visits of ≥3, ≥4, and ≥5 times after dis- charge to address attrition bias. The point estimates and statistical significance of G1 and G4 diminished after focusing on the subjects who return to the clinic regularly. When stratified by functional capacity at the time of discharge, HRs from the G1 and G4 remained significant (Table S2).
DISCUSSION
Among the 2933 patients with ischemic stroke who visited outpatient clinics more than 2 times during the 1 year of follow- up, we observed a mean TI score of
−0.13±0.28. Furthermore, patients who belonged to the lowest group of TI scores had a 13.4- fold elevated risk of recurrent stroke compared with those in the
middle range of TI score. The deleterious effect of the lower TI score on the risk of recurrent stroke was car- ried forward in several sensitivity analyses.
The concept of TI for elevated BP was first pro- posed in 2006, counting the medication changes only, and TI was reported to occur in 64% of patients during the first 6 months of treatment in a primary care setting.18 A higher TI score was shown to be as- sociated with better BP control in a follow- up study of patients with coronary artery disease.19 Rose et al pointed out the inherent limitation in the precedent definition of a raw change4,19– 21 and demonstrated the better performance of the standard- based method compared with other methods for measuring TI.8,22 The TI score, rather than medication adher- ence, was more predictive of the systolic BP tra- jectory among 9569 patients with newly diagnosed coronary artery disease during a mean follow- up period of 1.8 years.23 In a 1- year follow- up study of patients with resistant hypertension, TI occurred in 22% of the study population and increased the odds of adequate BP control at 1 year by 64%.9
Lower TI scores, implying physician’s hesitancy in increasing the dose of BP- lowering medications for patients with high BP recordings, are not uncommon in clinical practice.24 How might we explain such a clinical contradiction? First, in modern practice, it is known that physicians’ attention may be diverted
Figure 1. Stroke- free survival by the quintile groups of TI score.
Hazard ratios and 95% CIs were calculated using frailty models that considered the clustering effect of the treating hospitals and adjusted for age, sex, baseline National Institutes of Health Stroke Scale score, stroke mechanism, hypertension, diabetes mellitus, dyslipidemia, atrial fibrillation, and prestroke disability. TI indicates treatment intensification.
away from patients as only 33% of practice time may include direct physician– patient interaction.25 At a clinic visit, mild elevation of BP is usually as- ymptomatic, and it may be overlooked as a physician is distracted by the time pressure of practice and the endless demand for documentation.26 Second, physicians may be subject to clinical inertia, that is, they fail to initiate or intensify appropriate therapies or diagnostic tests despite abnormal findings on laboratory tests or clinical exams.27 The clinical in- ertia has been observed in primary care settings in the management of hypertension, diabetes mellitus,
and dyslipidemia.4,28 It may reflect physicians’ over- estimation of the amount of care that they had al- ready provided, lack of motivation, nihilism, or lack of proper training for treating some conditions.9 Finally, BP measurement may often be inaccurate. Clinicians may not feel obligated to treat BP when it seems to be measured falsely.29,30 Considering the TI score formula and the potential clinical inertia that may un- derlie low TI scores, the TI score may be interpreted as a surrogate of physicians’ attentiveness to treat elevated BP.31 Physicians who have lower TI scores may also be less watchful of several other subtle
Table 2. Clinical Profiles by TI Score Quintile Groups
Variable
Five Groups of TI Score
P- for- Difference G1 (n, 248)
[−1 to −0.5]
G2 (n, 560) (−0.5 to −0.25)
G3 (n, 529) [−0.25 to 0]
G4 (n, 1209) [0]
G5 (n, 387) [0 to 1]
TI score −0.78±0.17 −0.41±0.08 −0.17±0.06 0 0.24±0.15
Observed medication changes 0.41±0.82 0.48±0.95 0.78±1.24 0.21±0.64 2.39±2.14 <0.01
Predicted medication changes 4.44±3.35 2.78±2.07 2.19±1.59 0.21±0.64 0.60±1.32 <0.01
Number of clinic visits 5.73±4.29 5.92±3.86 8.76±3.58 4.49±3.39 8.46±4.99 <0.01
Male sex 165 (67%) 349 (62%) 318 (60%) 736 (61%) 220 (57%) 0.16
Age, y 65.4±12.0 68.8±11.6 66.7±11.7 66.2±13.4 67.1±11.4 <0.01
Pre- stroke disability 49 (20%) 114 (20%) 86 (16%) 173 (14%) 61 (16%) 0.01
Baseline National Institutes of Health Stroke score
3 [1– 5] 3 [2– 6] 3 [1– 5] 3 [1– 7] 3 [1– 7] <0.01
Stroke mechanisms <0.01
Large artery atherosclerosis 104 (42%) 237 (42%) 213 (40%) 427 (35%) 129 (33%)
Small- vessel occlusion 63 (25%) 128 (23%) 115 (22%) 235 (19%) 49 (13%)
Cardioembolism 30 (12%) 85 (15%) 97 (18%) 269 (22%) 120 (31%)
Other determined etiology 2 (0.1%) 7 (0.1%) 9 (0.2%) 31 (0.3%) 7 (0.2%)
Undetermined etiology 49 (19%) 103 (18%) 95 (18%) 247 (20%) 82 (21%)
Recanalization treatment 22 (9%) 63 (11%) 63 (12%) 187 (16%) 62 (16%) <0.01
History of stroke 59 (24%) 127 (23%) 121 (23%) 234 (19%) 82 (21%) 0.28
Hypertension 213 (86%) 453 (81%) 433 (82%) 725 (60%) 331 (86%) <0.01
Diabetes mellitus 172 (71%) 283 (51%) 180 (34%) 312 (26%) 92 (24%) <0.01
Dyslipidemia 112 (45%) 238 (43%) 224 (42%) 495 (41%) 134 (35%) 0.06
Habitual smoking 113 (46%) 239 (43%) 223 (42%) 487 (40%) 142 (37%) 0.18
Atrial fibrillation 28 (11%) 85 (15%) 87 (16%) 239 (20%) 108 (28%) <0.01
Hemoglobin 13.8±2.1 13.6±2.1 13.9±1.7 13.6±1.9 13.6±2.0 0.11
Total cholesterol 180±45 177±42 177±41 175±41 175±39 0.56
Blood urea nitrogen 18.7±10.5 17.2±7.2 16.9±8.3 16.2±7.6 16.4±7.4 <0.01
Creatinine 1.31±1.81 1.05±0.85 0.98±0.79 0.95±0.73 0.97±0.79 <0.01
Fasting blood glucose 126±55 120±55 111±39 110±45 109±41 <0.01
SBPe 160±29 153±29 151±27 142±24 148±27 <0.01
DBP 90±17 87±16 86±16 85±16 86±16 <0.01
mRS score 0– 1 at discharge 122 (49%) 242 (43%) 273 (52%) 575 (48%) 191 (49%) 0.08
SBP during the follow- up period 141.7±10.3 136.2±10.4 133.0±10.9 124.6±9.7 128.9±114.4 <0.01
DBP during the follow- up period 80.7±7.6 78.7±8.1 77.4±9.5 74.6±6.6 75.7±7.1 <0.01
Recurrent stroke 42 (17%) 31 (6%) 12 (2%) 81 (7%) 9 (2%) <0.01
Values are presented as means±SDs, medians [interquartile ranges], or frequencies (percentages), respectively. DBP indicates diastolic blood pressure;
mRS, modified Rankin Scale; SBP, systolic blood pressure; and TI, treatment intensification.
abnormal signals in patients’ complaints, laboratory tests, or clinical examinations. As BP is an easily measurable and manageable target for intervention, the TI score can be used as a performance indicator in outpatient clinic settings. However, this contention needs to be verified and validated in a prospective study.
We observed a higher risk of future events in tG4 whose TI score was 0. Subjects with a TI score of 0 may be a heterogeneous group of patients.
Specifically, the TI score will be 0 when there is per- fect antihypertensive prescription when encountering abnormal BP measurements, patients with no hyper- tension or no BP- lowering medication prescription, or patients’ failure to return for follow- up to stroke
clinics possibly because of functional dependency or other reasons.
In the subset of study subjects who regularly re- turned to the clinic, the HRs and statistical signifi- cance diminished altogether in the whole groups (Figure 2D through 2F). Most of the recurrent strokes in groups 1, 2, and 4 occurred in their clinical courses after stroke. Therefore, the validity of our study re- sults cannot be applied to the long- term follow- up of stroke survivors.
A few points in this study need further clarification.
We applied the Joint National Committee VII criteria, as the study subjects were managed between 2011 and 2013. Patients’ adherence to medications was neither recorded nor analyzed, and the TI score for drugs other
Table 3. TI Score Quintile Groups and the Risk of Recurrent Stroke
Quintile Groups of TI Score
G1 G2 G3 G4 G5
Number of cases 248 560 529 1209 387
TI score (mean±SD and range)
−0.78±0.17 [−1 to −0.5)
−0.41±0.08 [−0.5 to −0.25)
−0.17±0.06 [−0.25 to 0)
0 0.24±0.15
(0– 1]
Crude model 13.50 [6.04 to 30.15] 4.51 [1.98 to 10.26] Reference 5.80 [2.67– 12.62] 1.70 [0.63– 4.61]
Multivariable model #1 13.95 [6.24 to 31.16] 4.48 [1.97 to 10.20] Reference 5.97 [2.74– 13.01] 1.72 [0.64– 4.67]
Multivariable model #2 13.43 [5.95 to 30.35] 4.59 [2.01 to 10.46] Reference 6.60 [3.02– 14.45] 1.68 [0.62– 4.56]
Hazard ratios and 95% CIs were calculated using frailty models that considered the clustering effect of the treating hospitals. Multivariable model #1 was adjusted for age, sex, and baseline National Institutes of Health Stroke Scale score. Multivariable model #2 was adjusted for age, sex, baseline National Institutes of Health Stroke Scale score, stroke mechanism, hypertension, diabetes mellitus, dyslipidemia, atrial fibrillation, and prestroke disability. TI indicates treatment intensification.
Figure 2. Sensitivity analyses.
The frailty models adjusted for the clustering effect and for the relevant covariates were repeated with subsets of patients: subjects with hypertension (A), subjects who had prescribed BP- lowering medication (B), subjects without atrial fibrillation (C), those who returned to the outpatient clinic ≥3 (D), ≥4 (E) and ≥5 (F) times, and those who had mRS score 0 to 2 (G) and 3 to 5 (H) at the time of discharge. BP indicates blood pressure; HR, hazard ratio; and mRS, modified Rankin Scale.
than BP- lowering medications was not examined. We do not have information on adverse events possibly related to antihypertensive medications. All the BP measurements were performed at outpatient clinics as routine clinical practice. We focused on patients who visited ≥2 times after discharge, and the follow- up du- ration was limited to 1 year. Overt imbalances in BP levels and other vascular risk factors according to the TI score groups could not be controlled completely de- spite adjustments. Residual confounding may still exist.
The TI score for each physician may be estimated, but this was not possible in our study. Finally, the study subjects were managed by stroke neurologists at spe- cialized academic centers for control of their vascular risk factors, including hypertension. Thus, the gener- alization of our findings to other primary care settings may be limited.
CONCLUSIONS
Using a TI score, a surrogate for physicians’ atti- tudes toward abnormal BP measurements, our study showed that inadequate treatment intensification of el- evated BP might be associated with a higher risk of recurrent stroke. With previous studies emphasizing the importance of TI score compared with medication adherence, our study suggests that the TI score can measure the physician’s performance or attentiveness.
However, the validity of our study for the long- term clinical courses after stroke was not demonstrated in the study. Therefore, this concept should be examined in well- designed prospective studies and clinical trials with a sufficient number of clinic visits for a sufficient length of time.
ARTICLE INFORMATION
Received November 6, 2020; accepted February 26, 2021.
Affiliations
From the Department of Neurology and Cerebrovascular Center, Seoul National University Bundang Hospital, Seoul National University College of Medicine, Seongnam, Republic of Korea (B.J.K., M.H., H.B.); Department of Neurology, Ilsan Paik Hospital, Inje University, Goyang, Republic of Korea (Y.C., K.H.); Department of Neurology, Yeungnam University Hospital, Daegu, Republic of Korea (J.L.); Department of Neurology, Chonnam National University Medical School and Hospital, Gwangju, Republic of Korea (J.K., K.H.C.); Department of Neurology, Seoul Medical Center, Seoul, Republic of Korea (T.H.P., S.P.); Department of Neurology, Eulji General Hospital, Eulji University, Seoul, Republic of Korea (J.P., K.K.); Department of Neurology, Eulji University Hospital, Eulji University, Daejeon, Republic of Korea (S.J.L., J.G.K.); Department of Neurology, Dong- A University College of Medicine, Busan, Republic of Korea (J.C., D.K.); Department of Neurology, Hallym University Sacred Heart Hospital, Anyang, Republic of Korea (B.L., K.Y., M.O.); Department of Neurology, Dongguk University Ilsan Hospital, Goyang, Republic of Korea (D.K., W.R.);
Department of Neurology, Jeju National University, Jeju, Republic of Korea (J.C.C.); Department of Neurology, Ulsan University Hospital, University of Ulsan College of Medicine, Ulsan, Republic of Korea (W.K.); Department of Neurology, Chungbuk National University Hospital, Cheongju, Republic of Korea (D.S.); Department of Neurology, Keimyung University Dongsan Medical Center, Daegu, Republic of Korea (S.I.S., J.H.); Clinical Research
Center, Asan Medical Center, Seoul, Republic of Korea (J.S.L.); Department of Biostatistics, College of Medicine, Korea University, Seoul, Republic of Korea (J.L.); and Davee Department of Neurology, Northwestern University Feinberg School of Medicine, Chicago, IL (P.B.G.).
Sources of Funding
This study was supported by unrestricted research funds from Daiichi- Sankyo Pharmaceuticals, Ltd. However, the sponsor does not have any role in the analysis, interpretation, or publication of the study results.
Disclosures
None.
Supplementary Material
Tables S1– S2 Figure S1
REFERENCES
1. Powers WJ, Rabinstein AA, Ackerson T, Adeoye OM, Bambakidis NC, Becker K, Biller J, Brown M, Demaerschalk BM, Hoh B, et al.
Guidelines for the early management of patients with acute ischemic stroke: 2019 update to the 2018 guidelines for the early management of acute ischemic stroke: a guideline for healthcare professionals from the American Heart Association/American Stroke Association. Stroke.
2019;50:e344– e418. DOI: 10.1161/STR.00000 00000 000211.
2. Takashima N, Arima H, Kita Y, Fujii T, Tanaka- Mizuno S, Shitara S, Kitamura A, Sugimoto Y, Urushitani M, Miura K, et al. Long- term sur- vival after stroke in 1.4 million japanese population: Shiga Stroke and Heart Attack Registry. J Stroke. 2020;22:336– 344. DOI: 10.5853/
jos.2020.00325.
3. Gorelick PB, Qureshi S, Farooq MU. Management of blood pressure in stroke. Int J Cardiol Hypertens. 2019;3:100021. DOI: 10.1016/j.
ijchy.2019.100021.
4. Berlowitz DR, Ash AS, Hickey EC, Friedman RH, Glickman M, Kader B, Moskowitz MA. Inadequate management of blood pressure in a hyper- tensive population. N Engl J Med. 1998;339:1957– 1963. DOI: 10.1056/
NEJM1 99812 31339 2701.
5. Kohok DD, Sico JJ, Baye F, Myers L, Coffing J, Kamalesh M, Bravata DM. Post- stroke hypertension control and receipt of health care ser- vices among veterans. J Clin Hypertens. 2018;20:382– 387. DOI:
10.1111/jch.13194.
6. Roumie CL, Ofner S, Ross JS, Arling G, Williams LS, Ordin DL, Bravata DM. Prevalence of inadequate blood pressure control among veterans after acute ischemic stroke hospitalization: a retrospective cohort. Circ Cardiovasc Qual Outcomes. 2011;4:399– 407. DOI: 10.1161/CIRCO UTCOM ES.110.959809.
7. Glader EL, Sjolander M, Eriksson M, Lundberg M. Persistent use of secondary preventive drugs declines rapidly during the first 2 years after stroke. Stroke. 2010;41:397– 401. DOI: 10.1161/STROK EAHA.109.566950.
8. Rose AJ, Berlowitz DR, Manze M, Orner MB, Kressin NR. Comparing methods of measuring treatment intensification in hypertension care.
Circ Cardiovasc Qual Outcomes. 2009;2:385– 391. DOI: 10.1161/CIRCO UTCOM ES.108.838649.
9. Daugherty SL, Powers JD, Magid DJ, Masoudi FA, Margolis KL, O’Connor PJ, Schmittdiel JA, Ho PM. The association between med- ication adherence and treatment intensification with blood pressure control in resistant hypertension. Hypertension. 2012;60:303– 309. DOI:
10.1161/HYPER TENSI ONAHA.112.192096.
10. Vigen R, Shetterly S, Magid DJ, O’Connor PJ, Margolis KL, Schmittdiel J, Ho PM. A comparison between antihypertensive medication adher- ence and treatment intensification as potential clinical performance measures. Circ Cardiovasc Qual Outcomes. 2012;5:276– 282. DOI:
10.1161/CIRCO UTCOM ES.112.965665.
11. Kim BJ, Park J- M, Kang K, Lee SJ, Ko Y, Kim JG, Cha J- K, Kim D- H, Nah H- W, Han M- K, et al. Case characteristics, hyperacute treatment, and outcome information from the clinical research center for stroke- fifth division registry in South Korea. J Stroke. 2015;17:38– 53. DOI:
10.5853/jos.2015.17.1.38.
12. Stroke. Clinical Research Center for Stroke. Clinical practice guidelines for stroke. Clinical Research Center for. 2009.
13. Sacco RL, Adams R, Albers G, Alberts MJ, Benavente O, Furie K, Goldstein LB, Gorelick P, Halperin J, Harbaugh R, et al. Guidelines for prevention of stroke in patients with ischemic stroke or transient ischemic attack: a statement for healthcare professionals from the American Heart Association/American Stroke Association Council on Stroke: co- sponsored by the Council on Cardiovascular Radiology and Intervention: the American Academy of Neurology affirms the value of this guideline. Stroke. 2006;37:577– 617. DOI: 10.1161/01.STR.00001 99147.30016.74.
14. Chobanian AV, Bakris GL, Black HR, Cushman WC, Green LA, Izzo JL Jr, Jones DW, Materson BJ, Oparil S, Wright JT Jr, et al. Seventh report of the Joint National Committee on prevention, detection, evaluation, and treatment of high blood pressure. Hypertension. 2003;42:1206–
1252. DOI: 10.1161/01.HYP.00001 07251.49515.c2.
15. Aalen OO, Valberg M, Grotmol T, Tretli S. Understanding variation in dis- ease risk: the elusive concept of frailty. Int J Epidemiol. 2015;44:1408–
1421. DOI: 10.1093/ije/dyu192.
16. Kim BJ, Cho Y- J, Hong K- S, Lee J, Kim J- T, Choi KH, Park TH, Park S- S, Park J- M, Kang K, et al. Trajectory groups of 24- hour systolic blood pressure after acute ischemic stroke and recurrent vascular events. Stroke. 2018;49:1836– 1842. DOI: 10.1161/STROK EAHA.118.021117.
17. Ha Il,Do, Noh M, Lee Y. frailtyHL: a package for fitting frailty models with H- likelihood. R J. 2012;4:28. DOI: 10.32614/ RJ- 2012- 010.
18. Rodondi N, Peng T, Karter AJ, Bauer DC, Vittinghoff E, Tang S, Pettitt D, Kerr EA, Selby JV. Therapy modifications in response to poorly con- trolled hypertension, dyslipidemia, and diabetes mellitus. Ann Intern Med. 2006;144:475– 484. DOI: 10.7326/0003- 4819- 144- 7- 20060 4040- 00006.
19. Ho PM, Magid DJ, Shetterly SM, Olson KL, Peterson PN, Masoudi FA, Rumsfeld JS. Importance of therapy intensification and medication nonadherence for blood pressure control in patients with coronary disease. Arch Intern Med. 2008;168:271– 276. DOI: 10.1001/archi ntern med.2007.72.
20. Okonofua EC, Simpson KN, Jesri A, Rehman SU, Durkalski VL, Egan BM. Therapeutic inertia is an impediment to achieving the healthy peo- ple 2010 blood pressure control goals. Hypertension. 2006;47:345–
351. DOI: 10.1161/01.HYP.00002 00702.76436.4b.
21. Rose AJ, Berlowitz DR, Orner MB, Kressin NR. Understanding uncon- trolled hypertension: is it the patient or the provider? J Clin Hypertens.
2007;9:937– 943. DOI: 10.1111/j.1524- 6175.2007.07332.x.
22. Balakumar P, Jagadeesh G. A century old renin- angiotensin system still grows with endless possibilities: AT1 receptor signaling cascades in cardiovascular physiopathology. Cell Signal. 2014;26:2147– 2160. DOI:
10.1016/j.cells ig.2014.06.011.
23. Maddox TM, Ross C, Tavel HM, Lyons EE, Tillquist M, Ho PM, Rumsfeld JS, Margolis KL, O’Connor PJ, Selby JV, et al. Blood pressure tra- jectories and associations with treatment intensification, medication adherence, and outcomes among newly diagnosed coronary artery disease patients. Circ Cardiovasc Qual Outcomes. 2010;3:347– 357.
DOI: 10.1161/CIRCO UTCOM ES.110.957308.
24. Osler W. Aequanimitas: With Other Addresses to Medical Students, Nurses and Practitioners of Medicine. Philadelphia, PA: P. Blakiston’s Son & Co.; 1922.
25. Sinsky C, Colligan L, Li L, Prgomet M, Reynolds S, Goeders L, Westbrook J, Tutty M, Blike G. Allocation of physician time in ambula- tory practice: a time and motion study in 4 specialties. Ann Intern Med.
2016;165:753– 760. DOI: 10.7326/M16- 0961.
26. Ofri D. What Patients Say, What Doctors Hear. Boston, MA: Beacon Press; 2017.
27. Phillips LS, Branch WT, Cook CB, Doyle JP, El- Kebbi IM, Gallina DL, Miller CD, Ziemer DC, Barnes CS. Clinical inertia. Ann Intern Med.
2001;135:825– 834. DOI: 10.7326/0003- 4819- 135- 9- 20011 1060- 00012.
28. Milman T, Joundi RA, Alotaibi NM, Saposnik G. Clinical inertia in the phar- macological management of hypertension: a systematic review and meta- analysis. Medicine. 2018;97:e11121. DOI: 10.1097/MD.00000 00000 011121.
29. Nasothimiou EG, Tzamouranis D, Rarra V, Roussias LG, Stergiou GS.
Diagnostic accuracy of home vs. ambulatory blood pressure monitoring in untreated and treated hypertension. Hypertens Res. 2012;35:750–
755. DOI: 10.1038/hr.2012.19.
30. Rothwell PM. Limitations of the usual blood- pressure hypothesis and importance of variability, instability, and episodic hypertension. Lancet.
2010;375:938– 948. DOI: 10.1016/S0140 - 6736(10)60309 - 1.
31. Josiah Willock R, Miller JB, Mohyi M, Abuzaanona A, Muminovic M, Levy PD. Therapeutic inertia and treatment intensification. Curr Hypertens Rep. 2018;20:4. DOI: 10.1007/s1190 6- 018- 0802- 1.
SUPPLEMENTAL MATERIAL
Category Variable Value
Demographic information Male sex 1485 (54.7%)
Age (years) 67.5 ± 13.3
Pre-stroke disability 480 (17.7%)
Stroke information Onset to arrival (hour) 6.8 [2.0 - 34.3]
Baseline NIHSS score 3 [1 - 9]
Stroke mechanism
Large artery atherosclerosis 823 (37.8%) Small-vessel occlusion 273 (12.5%)
Cardioembolism 512 (23.5%)
Other determined etiology 50 (2.3%)
Undetermined etiology 522 (23.9%)
Recanalization treatment 359 (13.2%)
Vascular risk factors History of stroke 567 (20.9%)
Hypertension 1782 (65.6%)
Diabetes 850 (31.3%)
Dyslipidemia 998 (36.8%)
Habitual smoking 979 (36.1%)
Atrial fibrillation 557 (20.5%)
Laboratory information Hemoglobin (mg/dL) 13.4 ± 2.0 Total cholesterol (mg/dL) 179 ± 43 Blood urea nitrogen (mg/dL) 17.4 ± 10.5
Creatinine (mg/dL) 1.01 ± 1.08
Fasting blood glucose (mg/dL) 119 ± 47 Systolic blood pressure (mm Hg) 144 ± 27 Diastolic blood pressure 85 ± 16 Stroke outcomes mRS score at discharge (n, 2710)
0 820 (30.3%)
1 474 (17.5%)
2 296 (10.9%)
3 321 (11.8%)
4 282 (10.4%)
5 383 (14.1%)
6 134 (4.9%)
mRS score at three months after stroke (N = 2563)
1 446 (17.4%)
2 266 (10.4%)
3 296 (11.5%)
4 228 (8.9%)
5 229 (8.9%)
6 321 (12.5%)
mRS score at one year after stroke (N
= 2367)
0 829 (35.0%)
1 400 (16.9%)
2 199 (8.4%)
3 226 (9.6%)
4 153 (6.5%)
5 103 (4.4%)
6 457 (19.3%)
Recurrent stroke until one year 181 (6.7%)
The effect of TI score quintile groups on recurrent stroke; multivariable model #1 Adjusted HR [95% CI]
G1 of TI score 13.95 [6.24 - 31.16]
G2 of TI score 4.48 [1.97 - 10.20]
G3 of TI score reference
G4 of TI score 5.97 [2.74 - 13.01]
G5 of TI score 1.72 [0.64 - 4.67]
Age (per 1-year increase) 1.02 [1.00 - 1.03]
Male sex 0.93 [0.68 - 1.27]
Baseline NIHSS score (per 1-point increase) 0.99 [0.96 - 1.02]
The effect of TI score quintile groups on recurrent stroke; multivariable model #2 Adjusted HR [95% CI]
G1 of TI score 13.43 [5.95 - 30.35]
G2 of TI score 4.59 [2.01 - 10.46]
G3 of TI score reference
G4 of TI score 6.60 [3.02 - 14.45]
G5 of TI score 1.68 [0.62 - 4.56]
Age (per 1-year increase) 1.01 [1.00 - 1.03]
Male sex 0.93 [0.67 - 1.28]
Baseline NIHSS score (per 1-point increase) 0.98 [0.94 - 1.01]
Stroke mechanism, large artery atherosclerosis reference
Stroke mechanism, small vessel occlusion 0.72 [0.45 - 1.14]
Stroke mechanism, cardioembolism 1.08 [0.61 - 1.90]
Stroke mechanism, others 0.83 [0.53 - 1.28]
Hypertension 1.39 [0.93 - 2.07]
Diabetes 1.27 [0.91 - 1.78]
Dyslipidemia 1.13 [0.81 - 1.57]
Atrial fibrillation 1.49 [0.87 - 2.57]
Prestroke dependency 0.82 [0.53 - 1.24]
Sensitivity analysis; diagnosed of hypertension (n, 2155)
Adjusted HR [95% CI]
G1 of TI score 16.37 [6.32 - 42.41]
G3 of TI score reference
G4 of TI score 7.79 [3.09 - 19.62]
G5 of TI score 2.27 [0.75 - 6.88]
Age (per 1-year increase) 1.02 [1.00 - 1.04]
Male sex 0.94 [0.65 - 1.35]
Baseline NIHSS score (per 1-point increase) 0.97 [0.94 - 1.01]
Stroke mechanism, large artery atherosclerosis reference
Stroke mechanism, small vessel occlusion 0.93 [0.55 - 1.56]
Stroke mechanism, cardioembolism 1.50 [0.79 - 2.87]
Stroke mechanism, others 0.88 [0.52 - 1.48]
Hypertension Not included in the model
Diabetes 1.29 [0.88 - 1.88]
Dyslipidemia 1.09 [0.75 - 1.57]
Atrial fibrillation 1.28 [0.69 - 2.38]
Prestroke dependency 0.84 [0.54 - 1.31]
Sensitivity analysis; Prescribed BP-lowering drugs (n, 2155)
Adjusted HR [95% CI]
G1 of TI score 10.55 [5.11 - 21.78]
G2 of TI score 3.41 [1.63 - 7.11]
G3 of TI score reference
G4 of TI score 4.25 [2.13 - 8.47]
G5 of TI score 1.03 [0.41 - 2.57]
Age (per 1-year increase) 1.01 [0.99 - 1.03]
Male sex 0.89 [0.62 - 1.27]
Baseline NIHSS score (per 1-point increase) 0.99 [0.96 - 1.03]
Stroke mechanism, large artery atherosclerosis reference
Stroke mechanism, small vessel occlusion 0.65 [0.38 - 1.11]
Stroke mechanism, cardioembolism 1.00 [0.51 - 1.96]
Stroke mechanism, others 0.76 [0.46 - 1.27]
Hypertension 1.15 [0.68 - 1.94]
Diabetes 1.29 [0.89 - 1.87]
Dyslipidemia 1.10 [0.76 - 1.60]
Atrial fibrillation 2.02 [1.07 - 3.82]
Prestroke dependency 1.12 [0.72 - 1.74]
N.B. Identical numbers of sensitivity analysis datasets from diagnosed of
Sensitivity analysis; No atrial fibrillation (n, 2386)
Adjusted HR [95% CI]
G1 of TI score 34.49 [8.21 - 144.92]
G2 of TI score 14.72 [3.50 - 61.93]
G3 of TI score reference
G4 of TI score 16.62 [4.03 - 68.65]
G5 of TI score 3.90 [0.75 - 20.34]
Age (per 1-year increase) 1.01 [1.00 - 1.03]
Male sex 0.96 [0.66 - 1.38]
Baseline NIHSS score (per 1-point increase) 0.98 [0.94 - 1.02]
Stroke mechanism, large artery atherosclerosis reference
Stroke mechanism, small vessel occlusion 0.70 [0.44 - 1.11]
Stroke mechanism, cardioembolism 1.16 [0.60 - 2.23]
Stroke mechanism, others 0.82 [0.51 - 1.31]
Hypertension 1.38 [0.87 - 2.18]
Diabetes 1.18 [0.80 - 1.73]
Dyslipidemia 1.12 [0.76 - 1.63]
Atrial fibrillation Not included in the model
Prestroke dependency 0.87 [0.53 - 1.41]
Sensitivity analysis; Number of visits ≥3 (n, 2154)
Adjusted HR [95% CI]
G1 of TI score 2.54 [1.09 - 5.93]
G2 of TI score 2.02 [0.97 - 4.22]
G3 of TI score reference
G4 of TI score 2.32 [1.17 - 4.61]
G5 of TI score 0.86 [0.35 - 2.16]
Age (per 1-year increase) 1.00 [0.98 - 1.02]
Male sex 1.37 [0.84 - 2.25]
Baseline NIHSS score (per 1-point increase) 1.01 [0.96 - 1.05]
Stroke mechanism, large artery atherosclerosis reference
Stroke mechanism, small vessel occlusion 0.81 [0.40 - 1.63]
Stroke mechanism, cardioembolism 1.93 [0.88 - 4.22]
Hypertension 1.57 [0.82 - 3.01]
Diabetes 1.43 [0.88 - 2.34]
Dyslipidemia 1.10 [0.68 - 1.78]
Atrial fibrillation 1.11 [0.51 - 2.41]
Prestroke dependency 0.91 [0.49 - 1.69]
Sensitivity analysis; Number of visits ≥4 (n, 1860)
Adjusted HR [95% CI]
G1 of TI score 1.54 [0.52 - 4.56]
G2 of TI score 1.75 [0.78 - 3.95]
G3 of TI score reference
G4 of TI score 1.77 [0.84 - 3.72]
G5 of TI score 0.86 [0.33 - 2.22]
Age (per 1-year increase) 1.00 [0.97 - 1.02]
Male sex 1.26 [0.71 - 2.25]
Baseline NIHSS score (per 1-point increase) 1.02 [0.96 - 1.07]
Stroke mechanism, large artery atherosclerosis reference
Stroke mechanism, small vessel occlusion 0.85 [0.36 - 2.00]
Stroke mechanism, cardioembolism 1.82 [0.70 - 4.74]
Stroke mechanism, others 0.91 [0.40 - 2.08]
Hypertension 1.30 [0.61 - 2.77]
Diabetes 1.22 [0.68 - 2.20]
Dyslipidemia 1.34 [0.77 - 2.35]
Atrial fibrillation 1.39 [0.55 - 3.48]
Prestroke dependency 1.41 [0.72 - 2.77]
Sensitivity analysis; Number of visits ≥5 (n, 1684)
Adjusted HR [95% CI]
G1 of TI score 2.12 [0.59 - 7.59]
G2 of TI score 1.97 [0.70 - 5.52]
G3 of TI score reference
G4 of TI score 1.50 [0.56 - 4.04]
G5 of TI score 1.24 [0.41 - 3.78]
Male sex 1.24 [0.60 - 2.57]
Baseline NIHSS score (per 1-point increase) 1.05 [0.99 - 1.11]
Stroke mechanism, large artery atherosclerosis reference
Stroke mechanism, small vessel occlusion 1.72 [0.65 - 4.57]
Stroke mechanism, cardioembolism 2.62 [0.80 - 8.57]
Stroke mechanism, others 0.98 [0.32 - 2.99]
Hypertension 0.93 [0.39 - 2.25]
Diabetes 1.26 [0.60 - 2.64]
Dyslipidemia 1.32 [0.66 - 2.67]
Atrial fibrillation 1.04 [0.33 - 3.28]
Prestroke dependency 1.65 [0.71 - 3.82]
Sensitivity analysis; mRS score at discharge, 0 - 2 (n, 1924)
Adjusted HR [95% CI]
G1 of TI score 11.22 [4.23 - 29.78]
G2 of TI score 6.01 [2.31 - 15.64]
G3 of TI score reference
G4 of TI score 6.19 [2.44 - 15.72]
G5 of TI score 1.68 [0.51 - 5.60]
Age (per 1-year increase) 1.00 [0.99 - 1.02]
Male sex 0.90 [0.61 - 1.32]
Baseline NIHSS score (per 1-point increase) 0.97 [0.92 - 1.02]
Stroke mechanism, large artery atherosclerosis reference
Stroke mechanism, small vessel occlusion 0.64 [0.38 - 1.09]
Stroke mechanism, cardioembolism 0.83 [0.41 - 1.67]
Stroke mechanism, others 0.64 [0.36 - 1.13]
Hypertension 1.35 [0.84 - 2.18]
Diabetes 1.45 [0.96 - 2.18]
Dyslipidemia 1.13 [0.75 - 1.70]
Atrial fibrillation 1.86 [0.93 - 3.74]
Prestroke dependency 0.95 [0.52 - 1.73]
Sensitivity analysis; mRS score at discharge, 3 - 5 (n, 1009)
Adjusted HR [95% CI]
G2 of TI score 1.25 [0.21 - 7.55]
G3 of TI score reference
G4 of TI score 6.94 [1.62 - 29.67]
G5 of TI score 1.44 [0.24 - 8.79]
Age (per 1-year increase) 1.03 [1.00 - 1.06]
Male sex 0.97 [0.55 - 1.72]
Baseline NIHSS score (per 1-point increase) 0.98 [0.93 - 1.03]
Stroke mechanism, large artery atherosclerosis reference
Stroke mechanism, small vessel occlusion 0.85 [0.33 - 2.20]
Stroke mechanism, cardioembolism 2.33 [0.85 - 6.39]
Stroke mechanism, others 1.39 [0.66 - 2.93]
Hypertension 1.53 [0.72 - 3.23]
Diabetes 0.98 [0.54 - 1.78]
Dyslipidemia 0.84 [0.48 - 1.48]
Atrial fibrillation 0.85 [0.36 - 2.02]
Prestroke dependency 0.81 [0.44 - 1.51]