EVALUATION OF “INCREASING TREND” IN SEAWIFS-OBSERVED ANGSTROM EXPONENT DURING 1998-2006 OVER EAST-ASIAN WATERS
Hajime Fukushima
1, Kazunori Ogata
1, and Liping Li
2Graduate School of High-technology for Human Welfare, Tokai University
1, 410-0395, Numazu, Japan, [email protected]
Department of Physics, Ocean University of China, Qingdao, China
2ABSTRACT: Monthly mean data of Angstrom exponent and Aerosol optical thickness (AOT) from Sea-viewing Wide Field-of-view Sensor (SeaWiFS) measurements over the East Asian waters were analyzed. Increasing trend of the satellite-derived Angstrom exponent was found over 1998-2006 while AOT mean was observed stable during the same period. Statistical test showed that annual increase in Angstrom exponent of about 0.01 is statistically significant over three study sub-areas out of six surrounding waters of Japan. Comparison with Aqua/MODIS-derived Angstrom exponent time series over June 2002 through June 2008 showed consistent correlation, with similar statistical significance. The trend of Angstrom exponent was interpreted as increase in fraction of small aerosol particles to give quantitative estimates on the variability of aerosols. The mean increase is evaluated to be about +0.35%/yr or more in terms of the contribution of small particles to the total AOT, or sub-micron fraction (SMF).
KEY WORDS: Angstrom coefficient, Temporal variability of aerosol, Anthropogenic effect, MODIS
1. INTRODUCTION
Aerosols, with great spatial and temporal variability in species and concentrations, play an important role in Earth’s radiation budget. Aerosols would influence radiative forcing directly through scattering and absorbing effects in the, and also indirectly by modifying cloud albedo, lifetime, precipitation and extent.
Knowledge of aerosol property would effectively help to improve the accuracy of radiative forcing.
East Asian area is supposed to be one of the strongest source regions of anthropogenic aerosols due to the rapid growing economy. In addition, natural aerosols (such as Asian dust or non-farming biomass burning products), are also affected by the human activities, which further enhance the complexity of aerosols in this region. Temporal and spatial variability of aerosol loadings in East Asia are still poorly understood, especially the area over the ocean, where field measurements are hard to perform routinely, although various campaigns such as ACE-Asia have been carried out recently in this area.
SeaWiFS-derived aerosol data were used in this paper to study the temporal variability of aerosols above ocean in East Asia. Seven year time series of monthly mean AOT and Ångström exponent for 6 sub-areas were analyzed. While the AOT time series did not show any significant inter-annual trend, increasing trends in Angstrom exponent were observed in most of the study areas. To evaluate statistical significance of the trend, we subtracted the seasonal variation from the time series and the resulted anomaly data was subject to t-test. We also compared the SeaWiFS-derived time series with MODIS
Angstrom exponent anomaly time series to study the consistency of the observation. Other possible error source for the observation were also discussed.
2. DATA AND PROCESSING METHOD
SeaWiFS, launched in 1997, has generated more than 10-year global aerosol (over the ocean) and ocean color data simultaneously. SeaWiFS was primarily designed for global ocean color measurement and thus has very high signal-to-noise characteristics. It has 8 bands, centered at 412, 443, 490, 510, 555, 670, 765 and 865nm, with bandwidth of 20nm for the first six and 40nm for the last two NIR bands.
SeaWiFS Global Area Coverage (GAC) data with spatial resolution of 4km were used in this study and were processed with SeaWiFS Data Analysis System (SeaDAS 4.8) [Baith et al, 2001], a comprehensive image analysis package that employs Gordon and Wang’s [1994] method for atmospheric correction to estimate and correct the aerosol effect. Local variance method was applied to mask the cloud pixels, with the threshold of 0.02 for the 3*3 local variance of AOT at 490nm. This method is less strict compared to the SeaWiFS standard cloud mask algorithm, leaving enough data even under higher aerosol loadings.
For the standard atmospheric correction and the aerosol retrieval implemented by SeaDAS, a set of 12 non-absorptive or weakly absorptive aerosol models, including oceanic, maritime, coastal and tropospheric models with different relative humidity (RH), is adopted in the calculation of aerosol lookup tables [Wang, 2000].
Most of these aerosol models are from Shettle and Fenn
[1979], representing aerosols usually present in the ocean environment. Two-band approach (765 and 865nm) is used in SeaWiFS atmospheric correction method. By using the candidate aerosol models, the spectral variation of aerosol reflectance at the SeaWiFS two NIR bands can be evaluated. Two most adjacent aerosol models with their interpolating weights are determined by comparing the model reflectance to the observed NIR reflectance.
The AOT and Angstrom exponent are then retrieved based on the two aerosol models, their weights and the SeaWiFS measurement [Gordon and Wang, 1994].
The target region of the present analysis is focused on the East Asian Pacific, which is supposed to be under the significant influence of natural and anthropogenic aerosols from Asian continent. We selected 6 sub-areas as indicated in Figure 1 to study the temporal variability of aerosols.
As a measure of aerosol abundance, values of AOT at visible and near-infrared wavelength were determined first based on the observations of SeaWiFS at the two near infrared bands. Ångström exponent is then
calculated based on the definition
α (490,865) = ln( τ
a490 / τ
a865) / ln(865 / 490) . (1) AOT at 490nm was used in data analysis in this paper since 500nm is often regarded as a reference wavelength for visible band.
3. RESULT
Figure 2 provides the time series of monthly mean AOT and Angstrom exponent for each sub-area. It is interesting to observe some sporadic event such as the sudden peak of AOT in 2003 caused by the Siberian fire smoke as well as seasonal dependencies with different magnitude over the six study areas. Although it is not necessarily apparent, the Angstrom exponent time series in some area seemingly shows increasing trend.
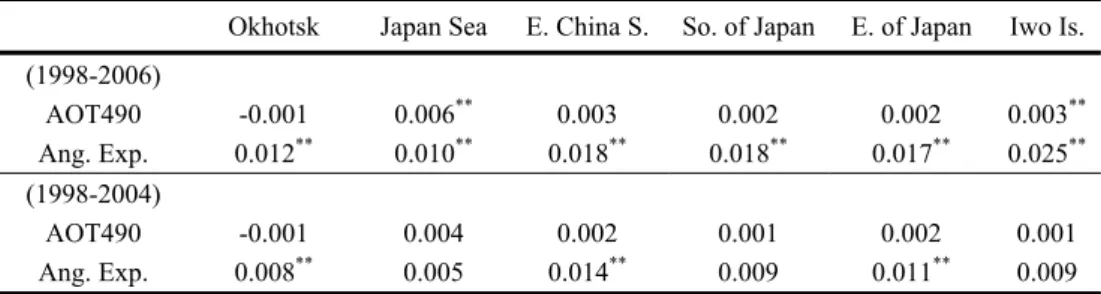
To verify the potential trend, we conducted statistical test (t- test) after removing seasonal dependency. Considering the possibility of more residual calibration error in and after 2005 (Eplee et al., 2007) the analysis was made against two different study periods of January 1998 – December 2006 and of January 1998 – December 2004. The results are summarized in Table 1, showing 1% significant positive trend in Angstrom exponent in all the six sub-areas as well as AOT increase in Japan Sea and in East of Iwo Island. For the shortened period of 1998-2004, the magnitude of the trend is significantly weakened, yet showing statistically significant Angstrom uptrend in Okhotsk-north Japan Sea, in East China Sea, and in East of Japan.
Since Angstrom exponent is an indicator of aerosol size distribution, this uptrend derived from satellite data can be interpreted as increasing in fraction of small aerosol particles in this area. An empirical relationship was chosen to estimate the sub-micron fraction (SMF) of AOT at 550nm from α (450,700),
SMF = −0.0512 α
2+ 0.5089 α + 0.02, (2) which was originally obtained from C-130 measurements conducted throughout the ACE-Asia campaign [Anderson et al., 2005]. Here SMF represents the fraction of AOT caused by actual aerosol that exists at low-RH aerodynamic diameters smaller than 1 µm. Although the wavelength used to derive Angstrom exponent in Eq. 2 is a little different from the one we used in this study, it Figure 1. The geographic location of the
selected sub-areas in this study. 1) Okhotsk- North Japan, 2) Sea of Japan, 3) East China Sea, 4) South of Japan, 5) East of Japan, 6) East of
l d
Table 1. SeaWiFS-derived mean annual increase in aerosol parameters.
Okhotsk Japan Sea E. China S. So. of Japan E. of Japan Iwo Is.
(1998-2006)
AOT490 -0.001 0.006
**0.003 0.002 0.002 0.003
**Ang. Exp. 0.012
**0.010
**0.018
**0.018
**0.017
**0.025
**(1998-2004)
AOT490 -0.001 0.004 0.002 0.001 0.002 0.001 Ang. Exp. 0.008
**0.005 0.014
**0.009 0.011
**0.009
**
1% significance
Figure 2. Time series of monthly mean AOT (gray line) and Angstrom exponent (solid line) derived from SeaWiFS for sub-areas shown in Fig. 1.
Figure 3. Angstrom exponent anomaly time series of SeaWiFS (solid line) in comparison
with that of Aqua/MODIS (grey line). All the April-June data were excluded to reduce
the effect of any sporadic events such as of Asian dust or Siberian fire smoke.
would not influence the result much larger if the absorption of aerosols is not very strong. Thus, applying this to the retrieved results shown in Table 1, we can interpret the 0.01/yr Angstrom exponent increase as 0.35% annual increase in SMF.
4. COMPARISON WITH MODIS-DERIVED TIME SERIES
For further comparison, we also analyzed the monthly mean data collected by Aqua/MODIS, a different sensor whose observation period overlaps with that of SeaWiFS. MODIS Level-3 monthly mean values (1x1 degree grid) of Angstrom exponent were used, which are publicly available from NASA via MODIS Online Visualization and Analysis System (MOVAS). To compare the MODIS-derived time series with that of SeaWiFS, we applied similar “deseasonalization” against MODIS monthly mean Angstrom exponent data during June 2002-June 2008 over the corresponding six study areas. We also eliminated all the April-June data from both the SeaWiFS and the MODIS date set, to avoid the effect of some sporadic aerosol event, which are often observed in these months.
Figure 3 shows the resulted Angstrom anomaly time series for SeaWiFS (solid line) and for MODIS (grey line), indicating very good consistency in the monthly time series. Table 2 provides mean annual Angstrom exponent increase derived from SeaWiFS (98-06 period) and from MODIS (02-08 period) with April-June data excluded. It is interesting to observe that the slope of SeaWiFS-derived mean Angstrom exponent is almost the same as 98-04 trend shown in Table 1, also with similar statistical significance. MODIS-derived Angstrom slope also showed consistent statistical significance, with much higher increasing rate in the Angstrom exponent trend.
5. CONCLUSION
In this paper we reported the observed fact related to the temporal variability of aerosol, that is, the fraction of
small aerosol particles in the atmosphere (SMF) is slightly increasing over the ocean in recent years. The rate of increase is evaluated to be +0.35% based on the SeaWiFS data analysis. MODIS time series confirms this uptrend although it shows twice high or higher trends in several study areas. Since MODIS time series shows highest discrepancy from the SeaWiFS data in near Iwo- Jima Island where AOT is comparatively more stable with minimum effect of Asian continent, further analysis will be required especially regarding calibration status of the satellite sensors.
ACKNOWLEDGMENTS
The authors thank Mr. G. Eplee and others at the SeaWiFS Project, for discussing the calibration issues of SeaWiFS. They are also grateful to NASA Ocean Biology Processing Group for their providing the SeaWiFS data set, GES-DISC DAAC for providing MODIS data via GES-DISC Interactive Online Visualization and Analysis Infrastructure (Giovanni).
This work was supported by funds from Japan Aerospace Exploration Agency (JAXA). L. Li is supported by the China Scholarship Council (CSC).
REFERENCES
Baith, K., et al., 2001: SeaDAS, a data analysis system for ocean-color satellite sensors. EOS, 82, 202.
Gordon, H. R., and M. Wang (1994), Retrieval of water- leaving radiance and aerosol optical thickness over the oceans with SeaWiFS: A preliminary algorithm, Appl.
Opt., 33, 443– 452.
Shettle, E. P., and R. W. Fenn (1979), Models for the aerosols of the lower atmosphere and the effect of humidity variations on their optical properties, Rep.
AFGL-TR-79-0214, U.S. Air Force Geophys. Lab., Hanscom Air Force Base, Mass.
Wang, M. (2000), The SeaWiFS atmospheric correction algorithm updates, SeaWiFS Postlaunch Tech. Rep. Ser., Vol 9, NASA Tech. Memo. 2000-206892. pp. 57-63, NASA Goddard Space Flight Cent., Greenbelt, Md.
Table 2. Mean annual slope in Angstrom exponent derived from SeaWiFS and Aqua/MODIS data.
Okhotsk Japan Sea E. China S. So. of Japan E. of Japan Iwo Is.
SeaWiFS (98-06) 0.009
**0.006
*0.012
**0.009
**0.011
**0.010
*MODIS/Aqua 0.017
*0.012
**0.018
**0.034
**0.028
**0.041
****