RADARSAT/SAR 영상을 이용한 한강 하구역 퇴적상의 경년 변동
특성 조사
INTERANNUAL CHANGES OF BAR MORPHOLOGY IN THE HAN RIVER ESTUARY USING RADARSAT/SAR IMAGES
양찬수 Chan-Su Yang
한국해양연구원 해양위성연구단
요약
The Han River is divided into North and South Korea by NLL(Northern Limit Line) and its area has been blocked by CCL(Civil Control Line) since the Korean War in 1950. Satellite remote sensing, therefore, is uniquely suited to monitoring bar transformation in the region. In river with bar, the characteristics of its physical conditions have a close relationship with bar morphology. In this paper, a monitoring approach of bar transformation in the Han River Estuary is presented using RADARSAT/SAR images from 2000 to 2005 and spatial patterns of bar morphology are presented. it could be said that in the estuary vegetated area and natural levees are developed well, but bars are shifted after an event like a flood. It is also showed that suspended solids such as silt transported through the estuary could contribute highly to a sedimentation environment around Incheon.
1. Introduction
The Korean Peninsula is divided to South Korea on the southern half and North Korea to the north with 238 km of border running along the Demilitarized Zone (DMZ).
However, the sea boundary with North Korea is NLL (Northern Limit Line) in the Han River and its estuary as shown in Fig. 1.
The Han River located in South Korea, is the
confluence of the South Han River and the North Han, and flows through Seoul to empty into the Yellow Sea. The Imjin River (Figs. 1 and 2), a tributary of the Han flows through both North Korea and South Korea and forms an estuary with the Han River. The major rivers flow north to south or east to west and empty into the Yellow Sea or the Korea Strait. They tend to be broad and
1
shallow and to have wide seasonal variations in water flow. Within Seoul limits, the river is more than 1 km wide.
The Han River Estuary (Figs. 1 and 2) has a free connection with the Yellow Sea and
within which seawater mixes with fresh water from the Han River. The estuary encompasses the Yellow Sea to the west, the Yeseong River flowing to the south and the Imjin River, a tributary of the Han River. The key feature in the waters is that the typical tidal range is about 8 to 10 m and then a tide is a force to maintain a dynamic relationship at the meeting between the two waters.
The estuary is often characterized by sedimentation of silt carried in from terrestrial runoff. About two-thirds of the annual precipitation occurs between June and
September.
For the past half century, the Han River Estuary has preserved because its area is blocked by CCL(Civil Control Line) as shown in Fig. 2. In this paper, bar
transformation and silt transportation in a natural river are investigated from 2000 to 2005 using Radarsat-1 SAR imagery. The work presented in this paper focuses on temporal and spatial changes of bar morphology.
2. Data / Method
RADARSAT-1 satellite SAR data were acquired and processed at the Korea Earth Observation Center (KEOC) as shown in Table 1. SAR image is calibrated to geophysical (sigma naught) values of radar cross section
123oE 126oE 129oE 34oN
37oN 40oN
126oE 30' 127oE
30'
38oN
30'
126oE 30' 127oE
30'
38oN
30'
Fig. 1 Research area for the Han River Estuary, Korea. The estuary is connected to the Yellow Sea, the Yeseong River and the Imjin River. An image in the left figure is produced from SPOT-5
multispectral data to produce a base map.
2
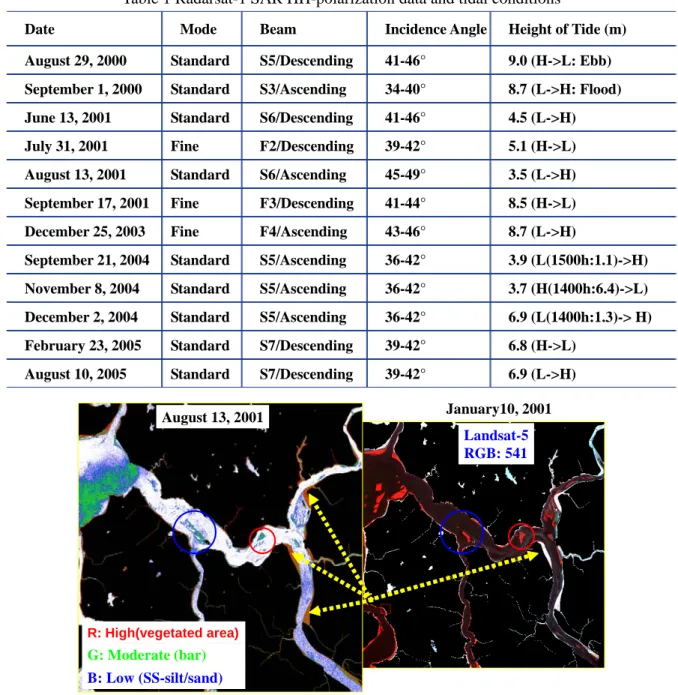
Table 1 Radarsat-1 SAR HH-polarization data and tidal conditions
Date Mode Beam Incidence Angle Height of Tide (m)
August 29, 2000 Standard S5/Descending 41-46° 9.0 (H->L: Ebb) September 1, 2000 Standard S3/Ascending 34-40° 8.7 (L->H: Flood) June 13, 2001 Standard S6/Descending 41-46° 4.5 (L->H) July 31, 2001 Fine F2/Descending 39-42° 5.1 (H->L) August 13, 2001 Standard S6/Ascending 45-49° 3.5 (L->H) September 17, 2001 Fine F3/Descending 41-44° 8.5 (H->L) December 25, 2003 Fine F4/Ascending 43-46° 8.7 (L->H)
September 21, 2004 Standard S5/Ascending 36-42° 3.9 (L(1500h:1.1)->H) November 8, 2004 Standard S5/Ascending 36-42° 3.7 (H(1400h:6.4)->L) December 2, 2004 Standard S5/Ascending 36-42° 6.9 (L(1400h:1.3)-> H) February 23, 2005 Standard S7/Descending 39-42° 6.8 (H->L)
August 10, 2005 Standard S7/Descendin g 39-42° 6.9 (L->H)
August 13, 2001 January10, 2001
Landsat-5 RGB: 541
R: High(vegetated area) G: Moderate (bar) B: Low (SS-silt/sand)
Fig. 2 Comparison of SAR(August 13, 2001) and Landsat-5 RGB(541) image(January 10, 2001)
(RCS) even if data numbers (DN) on these detected images can be viewed as indicating relative radar backscatter intensities.
Incheon with a tidal level measurement site has a large tidal range, which amounts to over 9 meters in height. Rainfall is on an average 103 days a year, the rainy season starts in July and
tapers off in August. The heights of tide at each data acquisition are listed in Table 1.
The principle for classification of river topography is based on the backscatter values, and the methods use a processing chain consisting of calibration, land masking, thresholding, and classification. A base map
3
was produced using SPOT-5 fusion image and was referred for georeferencing SAR data.
For validation of SAR classification, optical data, Landsat-7 with a resolution of 30m, was used because the river area is impossible to get in-situ data. As shown in SAR classification, Landsat-5 revealed clearly vegetated areas and bars even though two data have a time difference of about 8 months.
3. Results
Temporal changes of bars and vegetation zones: Since the heights of tide at the time of the SAR overpass are more than 3.5 m with an average height of 7.0 m, silt or mud bars do not appear distinctly different from vegetated areas.
August to September 2000: Daily flows during the period of SAR acquisition are 2 to 4 times as high as daily means. In addition to that, tidal heights range from 8.7 m to 9.0 m. But the measurement site is located more than 50 km away from the center of research area. Masked images were used to generate four different values as follows:
Vegetated area: high reflectance Sand or silt bar: medium reflectance
Suspended substance or flowing silts: low reflectance
Water area
The left image of Fig. 2 shows comparatively low values under a high tide, while the right one explains morphology of the Han River Estuary just after several days of heavy rains.
August 2001: Heavy rains (about 173 mm)
from July 30 to August 1 caused floods and mudslides. Waters originated from flood made very bright returns throughout all channel than the right image acquired under normal conditions.
Multi-temporal color composite of Radarsat- 1 SAR imagery is shown in Fig. 6 using the following images: Red: August 10, 2005, Green: August 13, 2001, Blue: September 1, 2000.
Based on SAR signatures for bars, bar transformation is investigated from 2000 to 2005, and monitoring of suspended-silt transportations from terrestrial runoff is tried to understand the morphology during the events of severe rain storm. SAR data did not reveal clearly the bar locations because of most of data acquisitions during high tides from 6.8 m to 9.0 m. Even though the problem, it could be said that in the estuary vegetated area and natural levees are developed well, but bars are shifted after an event like a flood. It is also showed that suspended solids such as silt transported through the estuary could contribute highly to a sedimentation environment around Incheon.
ACKNOWLEDGEMENTS
This work was supported by the Basic Research Project, “Development of Management and Restoration Technologies for Estuaries” of KORDI and the Public Benefit Project of Remote Sensing, “Satellite Remote Sensing for Marine Environment” of Korea Aerospace Research Institute.
4