An Overview of Bootstrapping Method Applicable to Survey Researches in Rehabilitation Science
Bong-sam Choi, PhD, MPH, PT
Dept. of Physical Therapy, College of Health and Welfare, Woosong University
Abstract
Background: Parametric statistical procedures are typically conducted under the condition in which a sample distribution is statistically identical with its population. In reality, investigators use inferential statistics to estimate parameters based on the sample drawn because population distributions are unknown. The uncertainty of limited data from the sample such as lack of sample size may be a challenge in most rehabilitation studies.
Objects: The purpose of this study is to review the bootstrapping method to overcome shortcomings of limited sample size in rehabilitation studies.
Methods: Articles were reviewed.
Results: Bootstrapping method is a statistical procedure that permits the iterative re-sampling with replacement from a sample when the population distribution is unknown. This statistical procedure is to enhance the representativeness of the population being studied and to determine estimates of the parameters when sample size are too limited to generalize the study outcome to target population. The bootstrapping method would overcome limitations such as type II error resulting from small sample sizes.
An application on a typical data of a study represented how to deal with challenges of estimating a parameter from small sample size and enhance the uncertainty with optimal confidence intervals and levels.
Conclusion: Bootstrapping method may be an effective statistical procedure reducing the standard error of population parameters under the condition requiring both acceptable confidence intervals and confidence level (i.e., p=.05).
Key Words: Bootstrap; Error; Measurement; Population; Sample size.
Introduction
Bootstrapping, the word itself saying, is pulling oneself up by one’s bootstraps over a fence. It is somewhat an analogous term to a self-sustaining process that performs an impossible task without ex- ternal helps. From a statistical standpoint, boot- strapping is a procedure that permits the iterative re-sampling with replacement from a sample when the population distribution is unknown (Efron, 1979).
The method eventually allows setting confidence in- tervals and estimating significance levels from the re-sampled distribution. The method appears to be
unrealistically promising to estimate population param- eters using the re-sampling method over time, how- ever it actually allows optimal estimates of population distribution (Kulesa et al, 2015). After the method was first introduced to statistical sciences by Efron (1979) and computer technologies was updated, the procedure has become widespread because it provides methodo- logical reasoning for inferential statistics.
In inferential statistics, sample statistics such as
mean and standard deviation are to estimate pop-
ulation parameters with some acceptable variations,
which would later be used in evaluating the margin
of errors. These statistics often vary from sample to
Corresponding author: Bong-sam Choi [email protected]
sample. More specifically, one would like to inves- tigate the magnitude of these variations around the corresponding population parameter under assump- tions with which the variation of sample would be similar to that of population. The overall sense of all possible values of a sample statistic may be pre- sented with respect to a possible distribution which may closely be matched to the population studied.
This is called a sampling distribution. Based on the sampling distribution, sample statistics may later be determined to infer population parameters. However, in many cases, one is unable to determine how the population would be distributed, thus its parameters are commonly estimated by sample data only. This uncertainty resulting from the lack of representative- ness of the population being studied in relation to small sample size may lead to a shortcoming of in- ferential statistics. Therefore obtaining optimal sam- ple size may be critical to determine stable estimates of population parameters and to select realistic stat- istical procedures. (Pedhazur and Schmelkin, 1991;
Tabachnick and Fidell, 1996; Wolf et al, 2013).
Efron (1979) introduced and developed the boot- strap method drawing repeated samples from the population studied and obtaining the overall sense of idea about the sampling distribution. The primary concept of the method is based on which a simulated distribution of population estimators obtained by bootstrap method is able to provide the closest ap- proximation to the parameter distribution (Efron, 2012;
Efron and Tibshirani, 1993). The stochastic method applicable to literally any type of sample statistic leads to a surrogate population approximating the sampling distribution of a statistic. The sample summary sta- tistic is then computed on each of the bootstrap samples. This values may be transferred to a histo- gram and referred to as the bootstrap distribution of the sample statistic. Bootstrapping is the most widely accepted method for overcoming the limitations re- sulting from small sample sizes and the unreality of parametric statistical procedures.
Most, if not all, of researches in rehabilitation fields
have been focus on meaningful treatment effects an- choring the empirical results to evidence-based practice.
These studies are often carried out in healthy or pa- tient cohorts using the different phases of clinical trials.
To be determined if any changes in the treatment ef- fects are meaningful “clinically-important changes” or
“minimal detectable changes”, which can be determined by standard error of measurement (SEM) (Page, 2014;
Wyrwich, 2004). In addition the changes, effect size indicating clinical significance in measurements be- tween groups and statistical power indicating the likelihood of detecting an effect if the effect actually exists are interrelated with the issues of sample size (Cohen, 1988). Due to the reason, the most challeng- ing aspect of many rehabilitation researches is con- veniently drawing a small sample from the target patient population to which the outcomes drawn would be generalized. These small samples may typ- ically be biased or not representative to the target patient population. This may also lead to type II er- ror on a greater risk of small sample being unusual just by chance. That is, the possibility of getting type II error increases because statistical hypothesis testing with small samples may results in accepting the null hypothesis when it is false (Banerjee et al, 2009; Banerjee and Chaudhury, 2010).
The purpose of this study is to review the boot- strapping method to overcome shortcomings of lim- ited sample size in rehabilitation researches.
Bootstrapping
Theoretical Basis
In the bootstrapping method, one may draw a large
number of repeated samples, in other word “ghost
samples”, from the corresponding population and
postulate a sampling distribution of a specific sta-
tistic from the repeated samples to obtain a Monte
Carlo distribution describing for translating un-
certainties in model inputs into uncertainties in model
outputs (Wolf et al, 2013). The newly obtained dis-
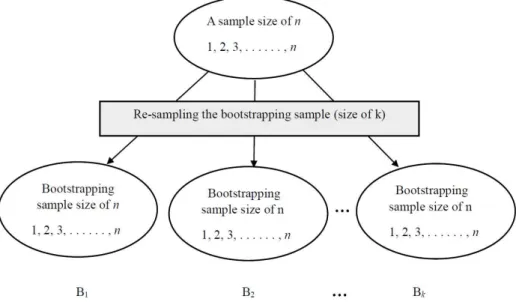
Figure 1. Framework of the bootstrapping sample.
tribution is referred to as the bootstrap distribution of the statistic. The method may also be used only when the distributions is unable to be estimated analytically. Theoretically, the method is based on central limit theorem, which assumes a bell shaped normal distribution curve with μ for mean and σ/
for standard deviation. Hence, the sampling dis- tribution of ( -μ)/SE (standard error of the mean) with SE=σ/ will be approximated by the boot- strap distribution of ( - )/ with
=bootstrap sample mean and =s/ .
For example, we typically accept samples when the sampling distribution of the estimates is able to esti- mate its population parameters. That is, the dis- tribution representing a symmetrically bell-shaped with μ at the center and σ/ for standard deviation can approximate the population distribution. The esti- mates of sample mean or median may randomly be bootstrapped by which the repeated samples repre- sents the same statistic from the population. The bootstrap distribution now better approximates to the sampling distribution with which the statistical func- tion is of the form of (
- )/ where is the estimate of the SE of and
is the mean of bootstrap sample based on bootstrap central limit
theorem (Singh, 1981). The method includes; 1) treating a sample of size n from a population as a virtual population, 2) re-sampling k samples of size n by permitting replacement (i.e., bootstrapping sam- ple), 3) creating a simulated distribution for the pa- rameters such as mean, SEs and confidence intervals (CIs). It should be noted that identical measurements may be selected over time in the bootstrapping sample due to allowing replacement. At extreme cases, all measurements selected can be identical (Figure 1).
Bias correction by bootstrap
The mean value of sampling distribution of often differs from its true mean because the estimator of is a function of individual data (i.e., X
1, X
2, X
3, ..., X
n).
That is, the difference between the estimator and true mean is determined by large n, which replaces the population by the empirical population of the sample.
This is so called bias correction by bootstrap. In addi- tion, the SE of the estimator can be computed by the simple bootstrap sample as the sample varies on all possible samples (Efron, 2012; Singh and Xie, 2003).
Bootstrap confidence interval (CI)
The CI, a sample based range, are often provided
for the unknown mean of as an estimator of pop- ulation parameter. This is a property that true mean values would fall into within the range with a speci- fied probability with respect to all possible samples depending on how the samples are drawn. That is, the CI is asymptotically determined by sampling dis- tribution of the estimator of true mean as the sample size is approximate to infinity (i.e., n→∞). In boot- strap method, one may draw 1,000 bootstrap re- plicated estimators for true mean, rank from the lowest to the highest, and determine the CI at 95%
when choosing 95% CI. For example, when the re- plicated estimators of true means ( ) are denoted by
, Individual bootstrap values are denoted by
1,
2
, ...,
1000. The CI for the bootstrap samples at 95%
would be
25,
975. Since it should be noted that the sampling distribution of - is symmetrically distributed. Hence, the sampling distribution of - is approximated by the bootstrap distribution of -
B
, which is contrary to the bootstrap concept and could now be approximated by the bootstrap dis- tribution of
B- .
Bootstrap-t method
For better accuracy, it is possible to bootstrap a statistical function of the form t=( - )/, where
is a sample estimate of the standard error of . In other words, Edgeworth correction by the boot- strap (Hall, 1988; Hall, 1992). The bootstrap-t is analogous to t-statistic where the SE of population mean is unknown, in most cases, and the standard deviation of the sample is replaceable for the un- known SE (i.e., =s/ ). Likewise the bootstrap-t is denoted by t
B=
B- /
Bwhere
Bis exactly like the SE as previously discussed under the boot- strap CI. Additionally the tB statistic can be obtained from the bootstrap sample and considered within the bootstrap CI. For instance, the would lies between
-t
B .975SE and -t
B .025SE when tB statistic from 1,000 bootstrap replicated estimators is denoted by (
- )/ . This range for is the bootstrap-t CI obtained by bootstrap-t method at the 95% probability.
Such an interval is now known to believe better ac- curacy in comparison to the traditional methods. It should be noted that the bootstrap-t method.
Sample size issues in healthcare research Of the factors affecting quality sampling, selecting an optimal sample size is a matter of falsely imply- ing no significant difference. In other words, the probability of accepting the null hypothesis when it is false (i.e., type II error) depends on the sample size. In addition, the sample size is often too small to give a reliable test. Accepting the null hypothesis leads to further considerations such as whether the null is true or false in the real situation. Needless to say, investigators may consider accepted methods to determine how large a sample size should be such as power analyses or differently design the study to compare parameters between different populations.
Most, if not all, researches in health care settings are typically conducted to demonstrate treatment ef- fects in the forms of treated versus control group or survey design in which the numbers of subject are always limited by realities. The reason for that would be limited time and cost, or high drop-out rate. Consequently, it is difficult to recruit an ample sample size in health care researches, despite de- termining the optimal sample size with accepted methods (Anderson and Vingrys, 2001).
An application of bootstrap method on a real data
Several simulation studies emphasized that sample statistics are sensitive to sample size (Claudy, 1972;
Pernet et al, 2015) and the ratio of sample size versus
the number of variable around 5:1∼10:1 was recom-
mended as for stable results (Green, 1991). In boot-
strapping method, an alternative of stably estimating
the parameters is recommended as empirical evi-
dences are unable to provide a standard but merely
a compendious guideline for the determination of
sample size. The method practically regards a virtual
population as a sample of n measurements from pop-
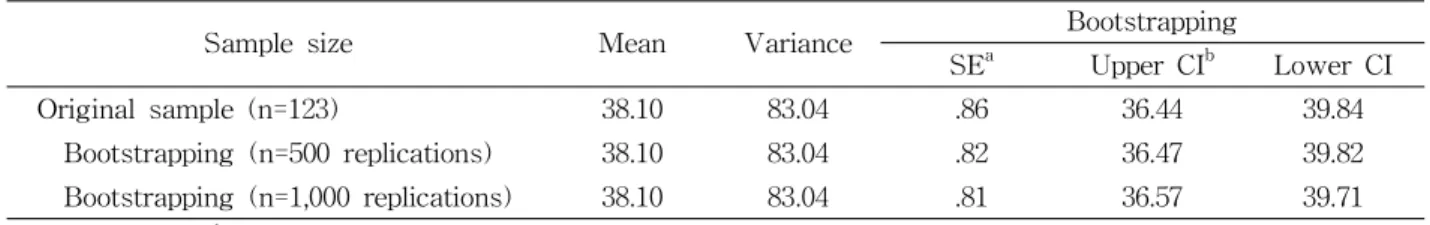
Sample size Mean Variance Bootstrapping
SE
aUpper CI
bLower CI
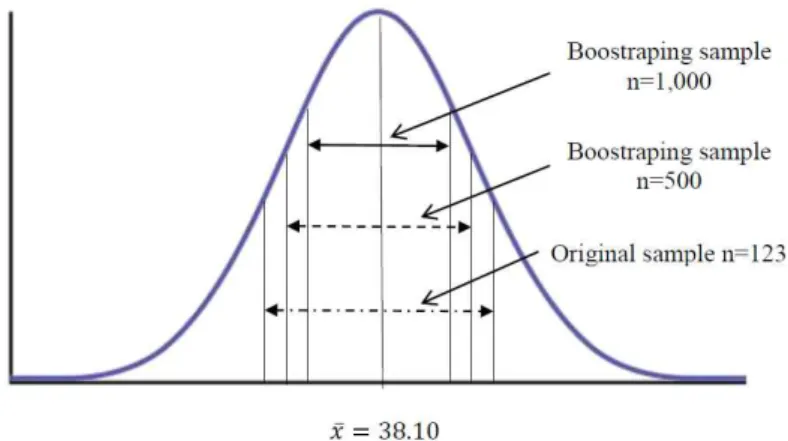
Original sample (n=123) 38.10 83.04 .86 36.44 39.84
Bootstrapping (n=500 replications) 38.10 83.04 .82 36.47 39.82 Bootstrapping (n=1,000 replications) 38.10 83.04 .81 36.57 39.71
a