Ahmed N. Alhakimi *, Mohamad M. E. Shakdofa , S. El-Sayed Saeed , Adel M. E. Shakdofa, Maged S. Al-Fakeh†, Ashwaq M. Abdu†,$, and Ibrahim A. Alhagri†,‡
†Department of Chemistry, College of Science, Qassim University, Buraidah-51452, Saudi Arabia.
*E-mail: [email protected]
‡Department of Chemistry, Faculty of Science, Ibb University, Ibb, Yemen.
§Department of Chemistry, College of Science and Arts, Khulais, University of Jeddah, Saudi Arabia.
#Inorganic Chemistry Department, National Research Center, P.O. 12622, El-bohouth St., Dokki, Cairo, Egypt.
¶Department of Chemistry, Faculty of Science, Menoufia University, Shebin El-Kom, Egypt.
$Key Laboratory of Applied Surface and Colloid Chemistry, MOE/School of Chemistry and Chemical Engineering, Shaanxi Normal University, Xi’an 710062, China.
(Received December 5, 2020; Accepted January 26, 2021)
ABSTRACT. Mononuclear Cu(II), Ni(II), Co(II), Mn(II), Zn(II), Fe(III), Ru(III) , and UO2(II) complexes of 2-hydroxy-4-(p- tolyldiazenyl)benzylidene)-2-(p-tolylamino)acetohydrazide (H2L) were prepared by direct method. The ligand and its complexes were isolated in solid state and characterized by analytical techniques such as elemental and thermal analyses, molar conductance, magnetic susceptibility measurements and spectroscopic techniques such as UV-Visible, IR, 1H-NMR and 13C-NMR. The spectral data indicated that the ligand acted as neutral/monobasic bidentate or monobasic/dibasic tridentate ligand bonded to the metal ions through the oxygen atom of ketonic or enolic carbonyl group, azomethine nitrogen atom and deprotonated/protonated pheno- lic oxygen atom forming either tetragonally distorted octahedral or octahedral. Antimicrobial activities of the ligand and its com- plexes were evaluated against Escherichia coli, Bacillus subtilis and Aspergillus niger by well diffusion method. The results of antifungal activity showed that the Fe(III) complex (10) exhibited higher antifungal against Aspergillus niger than the other com- plexes. However, the results of antibacterial activity revealed that Cu(II) complex (4) is the most active against Escherichia coli while the Cu(II) complex (5) and Fe(III) complex (10) exhibited higher antibacterial effect on Bacillus subtilis than the other complexes.
Key words: Antimicrobial, Azo-Hydrazone, Acetohydrazide, Azo-aldehyde, Metal complexes
INTRODUCTION
Hydrazones are firstly prepared by Emil Fischer in 1884, It is characterized by a structure R2R1C=N-N-CR=O.1 They represent a branch of Schiff base which play an import- ant role in several field as well as It have enormous attention because of its versatility as coordination ligands for the preparation and development of new transition metal com- plexes. Hydrazones display keto-enol tautomerism and exhibit several modes as neutral, monoanionic or dianionic forms to metal ions with a wide variety of coordination numbers.
They form mononuclear, binuclear, trinuclear and tetranu- clear metal complexes depending on factors such as additional donor atoms (N or O) in a suitable position for chelation, the nature of the hydrazone ligand, the identity and oxi- dation state of the metal, the metal-ligand ratio, and the pH of the medium. Hydrazones and their complexes play an important role in various fields such as pharmaceutics, enzyme
inhibitors,2 antioxidant,3 antibacterial,4 antidiabetic,5 anti- viral,6 antifungal,7 antimicrobial,8 anti-inflammatory,9 anti- tuberculosis,10 anticoagulants,11 antitumor,12 anticonvulsant,11 antiproliferative13 and antimalarial agents.14 The addition of azo-linkage (–N=N–) to the skeleton of hydrazone gives it applied capabilities in more fields such as coloring in fibers,15 photoelectronic,16 printing materials,17 optical technology,18 dyeing in textile,19 anti-corrosion,20 and also in biological fields,21 In addition, the compounds incorporating both hydra- zone and azo linkage have been attracted numerous research- ers’ attention because of their important and effective role in different fields.13,18b,22 The presence of aryl acetohydrazide moiety linked with the azo systems in their structural lead the ligand also exhibits a wide spectrum of colors and there- fore they found to alternate the applications in various fields such as the textile industry,15 designing of optical storage devices.23 Both azo compounds and hydrazone are also important compounds in medicinal and biological fields.22b
It has been suggested that the azomethine linkage might be responsible for the biological activity achieved by Schiff base.13,22a,22b,24 Lawrence et al. emphasizes the common synthetic routes, several useful applications of hydrazones and azo compounds, as well as their common voltametric properties under oxidative and reductive conditions, with an emphasis on non-aqueous media.25 Because of the broad applications of the compounds incorporating hydrazone and/or azo linkage, this study directed to synthesize a new azo-hydrazone of named, 2-hydroxy-4-(p-tolyldiazenyl)ben- zylidene)-2-(p-tolylamino)acetohydrazide and its mono- nuclear Cu(II), Ni(II), Co(II), Mn(II), Zn(II), Fe(III), Ru(III), and UO2(II) complexes. The structure of the prepared com- pounds was investigated by spectral and analytical techniques such as IR, NMR, and electronic absorption spectra as well as elemental and thermal analyses in addition to the mag- netic and molar conductance measurements for complexes.
The work was extended to investigate the in-vitro bacte- ricidal and fungicidal activities of the prepared compounds toward bacterial strains Escherichia coli and Bacillus sub- tilis as well as fungal strain Aspergillus niger by agar well diffusion method.
EXPERIMENTAL Chemicals
All used reagents employed for the preparation of the ligand and its complexes were of the analytical grade and used without further purification, 2-hydroxy-4-((4-methylphe- nyl)diazinyl) benzaldehyde and 2-(p-toluidino) acetohydra- zide were prepared by published methods.26 DMSO (assay and absolute ethanol (assay ≥99.8%) were used. Metal salts:
CuCl2·2H2O, Cu(SO4)·5H2O, Cu(NO3)2·3H2O, Cu(CH3COO)2· H2O, FeCl3·6H2O Co(CH3COO)2·4H2O, Zn(CH3COO)2·2H2O, Mn(CH3COO)2·4H2O, and Ni(CH3COO)2·4H2O were provided from SIGMA-ALDRICH company. RuCl3·3H2O, UO2(CH3COO)2·2H2O, were provided from American-Ele- ments. TLC confirmed the purity of all prepared compounds.
Physical Measurements
The elemental analysis (C, H, N) of prepared compounds were analyzed in the Micro-Analytical Laboratory, Cairo University, Egypt. The metal and chloride ions content were analyzed by Standard analytical methods.27 IR spectra of the acetohydrazide and its metal complexes were measured in the 400-4000 cm-1 range with KBr discs technique on Per- kin–Elmer 1430 infrared spectrophotometer. The Electronic absorption spectra in the 200-800 nm regions were recorded using 1-cm quartz cells using DMSO as a solvent. on a on
UV-6100PCS double-beam spectrometer. The JEOL EX- 400 MHz FT-NMR spectrometer was used to measure the NMR spectra in deuterated dimethyl sulfoxide (DMSO-d6) as a solvent. The Shimadzu DT-30 thermal analyzer was used to carry out the thermal analysis (TG) from room tempera- ture to 800 °C at a heating rate of 10 °C/min. Gouy Matthey Balance was used to measure the magnetic susceptibilities at 25 °C and were calculated by published equation.28 Diamag- netic corrections were estimated from Pascal’s constant.29 Tacussel type CD6NG conductivity bridge was used to record the molar conductivity of 10-3 M solutions (DMF). The resis- tance measured in ohms and the molar conductivities were calculated by published equation.30
Synthesis of the ligand, 2-hydroxy-4-(p-tolyldiazenyl)- benzylidene)-2-(p-tolylamino)acetohydrazide (H2L) (1) The azo hydrazone (1), 2-hydroxy-4-(p-tolyldiazenyl)ben- zylidene)-2-(p-tolylamino) acetohydrazide (H2L) (1) was prepared by adding the ethanolic solution of 2-hydroxy-4- ((4-methylphenyl) diazinyl) benzaldehyde (240 mg, 1 mmol in 20 mL) to ethanolic solution of 2-(p-toluidino)acetohy- drazide (179 mg, 1 mmol, in 20 mL). The mixture was refluxed while stirring for one hour. The formed solid product was filtered, washed with cold ethanol, followed by crystallization from ethanol. Finally dried under vacuum over anhydrous CaCl2 (Scheme 1). The formed ligand (1) C23H23N5O2 (FW = 401.19), yield; 90%, color; dark red. Elemental Anal.
Calcd. % C, 68.81; H, 5.77; N, 17.44. Found% C, 69.09; H, 5.48; N, 17.66. FTIR (KBr, cm-1); 3415(w) υ(OH), 3358 υ(7NH), 3251 (11NH), 1690 υ(9C=O), 1615 υ(13C=N), 1483, υ(N=N), 1257 υ(15C-OH), 970 υ(N-N) cm-1. 1H-NMR (DMSO-d6, 400 MHz): δ = 11.23 (s, 1H, OH), 10.27 (s, H,
11NH), 7.87 (s, 1H, 7NH), 8.34 (s, 1H, N=C-H), 6.43-8.19 ppm (m, 11 H, aromatic protons) δ = 2.29 (s, 6H, 29&30CH3), δ = 4.11 (s, 2H, 8CH2). 13C-NMR (DMSO-d6, 90 MHz): δ = 169.6 (C=O), δ = 165.1 (C-OH), δ = 150.2 (17C-N=N), δ
= 147.2 (23C-N=N), δ = 145.1 (C=N), δ = 141.1 (1C-NH), δ = 111.4-139.1 (aromatic carbon), δ = 50.3 ppm (8CH2), δ
= 21.3 ppm (29CH3) δ = 20.6 ppm (30CH3).
Preparation of the Metal Complexes
The metal complexes (2-3) and (5-11) were prepared by mixing a hot ethanolic solution of the metal salts: CuCl2
·2H2O, Cu(NO3)2·3H2O, Cu(CH3COO)2·H2O, Cu(SO4)·5H2O Co(CH3COO)2·4H2O, Mn(CH3COO)2·4H2O, Ni(CH3COO)2· 4H2O Zn(CH3COO)2·2H2O, FeCl3·6H2O or RuCl3·3H2O (1 mmol, in 30 mL of ethanol) with a suitable amount of a hot ethanolic solution of the ligand (1) (401 mg 1 mmol, 30 mL ethanol). The mixture was then refluxed for 3 hours.
The formed precipitates were filtered, washed with ethanol, then with diethyl ether and dried under vacuum over anhy- drous CaCl2. The Cu(II) and UO2(II) complexes (4) and (12) were prepared by mixing a hot ethanolic solution of the metal acetate: Cu(CH3COO)2·H2O or UO2(CH3COO)2 (1 mmol, in 30 mL of ethanol) with a suitable amount of a hot ethanolic solution of the ligand (1) (801 mg, 2 mmol, 30 mL ethanol). The mixture was then refluxed for 3 hours.
The formed precipitates were filtered, washed with ethanol, then with diethyl ether and dried under vacuum over anhy- drous CaCl2. The physical properties, elemental analysis and the spectroscopic data of the prepared complexes as shown as follow:
Copper(II) complex (2): [Cu(HL)Cl(H2O)2]. C23H26- CuN5O4Cl (FW = 535.49), yield; 85%, M.P.>300; color;
green, molar conductance (Λ) = 12.4 Ω-1cm2mol-1. Elemen- tal Anal. Calcd. %; C, 51.59, H, 4.89; N, 13.08 Cu, 14.86;
(Found) % C, 51.88, H, 4.78; N, 13.39; Cu, 14.57. FTIR (KBr, cm-1), υ(H2O), 3420(br) υ(7NH), 3358(br) υ(11NH), 3251 υ(NH), 1669 υ(9C=O), 1608 υ(13C=N), 1465 υ(N=N), 1312 υ(15C-O)ph, 1014 υ(N-N), 592 υ(Cu-O), 508 υ(Cu←O), 475 υ(Cu←N).
Copper(II) complex (3): [Cu(HL)(NO3)(H2O)2] C23H26- CuN6O7 (FW = 562.04), yield; 75%, M.P. >300. Its color is olive and Λ = 15.1 Ω-1cm2mol-1. Elemental Anal. Calcd. %;
C, 49.15; H, 4.66; N, 14.95; Cu, 14.15. Found %: C, 49.32;
H, 4.82; N, 14.65; Cu, 14.00. FTIR (KBr, cm-1); 3420(br) υ(H2O/OH), 3298 υ(7NH), 1609 υ(C=N), 1539, 1306 υ(N=C- O), 1466υ(N=N), 1253 υ(15C-OH), 1036υ(N-N), 593 υ (Cu-O), 512 υ(Cu←O), 475 υ(Cu←N), 1422, 1383 cm-1
(Δ=39) υ(NO3).
Copper(II) complex (4); [Cu(H2L)2(CH3COO)2], C50H52- CuN10O8 (FW = 984.57), yield; 77%, melting points (M.P.)
>300. Its color is brown, Λ = 15.3 Ω-1cm2 mol-1. Elemental Anal. Calcd. %; C, 61.22; H, 5.58; N, 15.52, Cu, 8.08. Found%;
C, 60.99; H, 5.45; N, 15.25 Cu, 7.78. FTIR (KBr, cm-1);
3430υ(OH): 3363, 3261, υ(NH), 1693 υ(C=O), 1610 (C=N), 1474 υ(N=N), 1257 υ(15C-OH), 995 υ(N-N), 500 υ(Cu←O), 465 υ(Cu←N), 1562,1376 cm-1 (Δ=186) υsyCH3COO, υasyCH3COO.
Copper(II) complex (5); [Cu(L)(H2O)3], C23H27CuN5O5 (FW = 517.05), yield; 72%, M.P.>300. Its Color is olive and Λ = 11.9 Ω-1cm2mol-1. Elemental Anal. Calcd. %; C, 53.43; H, 5.26; N, 13.55; Cu, 14.45; Found %; C, 53.60.;
H, 5.49; N, 13.25; Cu, 14.09. FTIR (KBr, cm-1); 4450(br) υ(H2O), 3388 (7NH), 1604 υ(C=N), 1537, 1373 υ(N=C- O), 1465 υ(N=N), 1308 υ(C-O)ph, 1014 υ(N-N), 594, 510 υ (Cu-O), 475 υ(Cu←N).
Cobalt(II) complex (6); [Co(HL)(CH3COO)(H2O)2], C25H29CoN5O6 (FW = 554.47), yield; 63%, M.P.>300. Color is reddish brown, Λ = 10.2 Ω-1cm2 mol-1. Elemental Anal.
Calcd. %; C, 54.16; H, 5.27; N, 12.63; Co, 13.51; Found
% C, 54.39.; H, 5.50; N, 12.88; Co, 13.65; FTIR (KBr, cm-1);
3435(br) υ(H2O), 3294 υ(NH), 1604 υ(C=N), 1525, 1314 υ(N=C-O), 1254 υ(15C-OH), 1038 υ(N-N), 594 υ(Co-O), 511υ(Co←O), 473 υ(Co←N), 1542, 1371 (Δ=171) υsyCH3COO, υasyCH3COO.
Manganese(II) complex (7); [Mn(HL)(CH3COO)(H2O)2] C25H29MnN5O6 (FW = 550.47), yield; 77%, M.P.>300. Color is dark yellow and Λ = 9.6 Ω-1cm2 mol-1. Elemental Anal.
Scheme 1. Preparation of the ligand, 2-hydroxy-4-(p-tolyldiazenyl)benzylidene)-2-(p-tolylamino)acetohydrazide.
Calcd. %; C, 54.55; H, 5.31; N, 12.72; Mn, 13.57; Found:
C, 54.52.; H, 5.56; N, 12.44; Mn, 13.18; FTIR (KBr, cm-1);
3445 (br) υ(H2O/OH), 3388 υ(NH), 1610 υ(C=N), 1590 υ(N=C-O), 1465 υ(N=N), 1315 υ(N=C-O), 1250 υ(15C-OH), 1009 υ(N-N), 580 υ(Mn-O), 506 υ(Mn←O), 487 υ(Mn←N), 1540, 1340 cm-1 (Δ=200) υsyCH3COO, υasyCH3COO.
Zinc(II) complex (8); [Zn(HL)(CH3COO)(H2O)2], C25H29ZnN5O6 (FW = 560.92),yield; 58%, M.P.>300. Color is pale yellow; Λ = 11.50 Ω-1cm2 mol-1. Elemental Anal.
Calcd. %; C, 53.53; H, 5.21; N, 12.49; Zn, 14.51; Found %;
C, 53.30.; H, 5.30; N, 12.41; Zn, 14.09. FTIR (KBr, cm-1);
3430(br) υ(H2O/OH), 3284 υ(NH), 1600 υ(C=N), 1585 υ (N=C-O), 1490 υ(N=N), 1300 υ(N=C-O), 1253 υ(15C-OH), 1013 υ(N-N), 582 υ(Zn-O), 532 υ(Zn←O), 458 υ(Zn←N), 1545, 1335 cm-1 (Δ=210) υsyCH3COO, υasyCH3COO. 1H- NMR (DMSO-d6, 400 MHz): δ = 11.94 (s, 1H, OH), 8.34 (s, 1H, 7NH), 8.91 (s, 1H, N=C-H), 6.59-8.15 ppm (m, 11 H, aromatic protons) δ = 2.33 (s, 6H, 29$30CH3), δ = 4.27 (s, 2H, 8CH2), δ =1.55 (s, 3H,CH3COO); 13C-NMR (DMSO- d6, 90 MHz): δ = 167.1(C=O), δ =160.4(C-OH), δ =150.1 (17C-N=N), δ =147.6 (23C-N=N), δ = 142.3 (C=N), δ =141.0 (1C-NH), δ = 111.9-130.4 (aromatic carbon), δ = 48.8 ppm (8CH2), δ = 23.4 ppm (29CH3) δ = 21.7 ppm (30CH3), δ = 172.3, 14.4(CH3COO).
Nickel complex (9); [Ni(HL)(OAc)(H2O)2] C25H29NiN5O6
(FW = 554.23), yield; 77%, M.P.>300. Color is brown, Λ
= 15.3 Ω-1cm2 mol-1. Elemental Anal. Calcd. %; C, 54.18;
H, 5.27; N, 12.64; Ni, 13.48; Found % C, 54.12.; H, 4.97; N, 12.55; Ni, 13.16. FTIR (KBr, cm-1); 3435(br) υ(H2O/OH), 3287 υ(NH), 1604 υ(C=N), 1588 ν(N=C-O), 1465 ν(N=N), 1321 υ(N=C-O), 1249 υ(15C-OH), 1018 υ(N-N), 566 (Ni-O), 506 υ(Ni←O), 489 υ(Ni←N), 1556, 1346 cm-1 (Δ=210) υsyCH3COO, υasyCH3COO.
Iron(III) complex (10); [Fe(L)Cl(H2O)2] C23H25Fe- ClN5O4 (FW = 526.78), Yield: 65%, M.P.>300. Its color is dark brown and Λ = 16.5 Ω-1cm2 mol-1. Elemental Anal.
Calcd. % C; 52.44; H, 4.78; N, 13.29, Cl, 6.73, Fe, 15.16.
Found %; C, 52.67; H, 4.77; N, 13.50, Cl, 6.33, Fe, 15.20.
FTIR (KBr, cm-1); 3435 υ(H2O), 3360 υ(NH), 1608 υ(C=N), 1531, 1370 υ(N=C-O), 1466 υ(N=N), 1317 υ(C- O)ph, 999 υ(N-N), 567 υ(Fe-O), 507 υ(Fe←N).
Ruthenium(III) complex (11); [Ru(HL)Cl2(H2O)]·
2H2O, C23H28RuCl2N5O5 (FW = 626.07), yield; 73%, M.P.>300. Its color is dark brown and Λ = 17.5 Ω-1cm2 mol-1. Elemental Anal. Calcd. %; C, 44.01; H, 4.51; N, 11.18; Cl, 11.32; Ru, 19.98; Found % C, 44.22.; H, 4.26; N, 11.29; Cl, 11.00; Ru, 19.83. FTIR (KBr, cm-1); 3440 υ(H2O), 3358, 3251 υ(NH), 1680 υ(C=O), 1583 υ(C=N), 1485 υ(N=N), 1280 υ(C-O)ph, 970 υ(N-N), 562 υ(Ru←O), 513 υ(Ru←O),
480 υ(Ru←N).
Uranium (VI) complex (12); [UO2(HL)2(H2O)2] C49H48 UO2N10O6 (FW = 1106.93), yield 65%, and M.P.>300. Color is orange; Λ = 10.5 Ω-1cm2 mol-1. Elemental Anal. Calcd. %;
C, 49.91; H, 4.33; N, 12.65, U, 25.84; Found % C, 49.38.;
H, 4.52; N, 12.97, U, 25.43. FTIR (KBr, cm-1); 3400(br), υ(H2O/OH), 3300(w) υ(NH), 1614 υ(C=N), 1547, 1375 υ(N=C-O), 1470, υ(N=N), 1318 υ(C-O)ph, 1015 υ(N-N), 956 υ(O=U=O), 512 υ(U-O), 472 cm-1υ(U←N).
In-vitro Antimicrobial Activity
The assessment of the antimicrobial activities of all compounds (1-8) were tested against different strains of Gram-Positive and Gram-negative bacteria as well as fungal strains by agar well diffusion method.31 The tested strains were Escherichia coli (E. coli), Bacillus subtilis (B. subtilis) and, Aspergillus niger (A. niger). The bacteria and filamen- tous fungi were cultured on Mueller-Hinton agar medium and Czapek Dox’s agar (CDA) medium, respectively at pH 7.4. The agar plates were incubated at 37 °C for 24 h (bac- teria) and at 28 °C for 4 days (fungi). Tetracycline (Sigma, USA) was used for the bacteria while amphotericin B (Sigma, USA) was used for the fungi. A negative control (DMSO; 2% v/v) was also included to compare the activity.
The appearance of zones of inhibition was regarded as positive for the presence of antimicrobial action in the test substance. Subsequently, each value was the average of three independent replicates and the activity index for the com- plexes was calculated by following formula.32
Activity index =
×100 RESULTS AND DISCUSSION
The reaction of 2-(p-toludino) acetohydrazide with 2- hydroxy-4-((4-methylphenyl) diazinyl) benzaldehyde in 1:1 mole ratio led to the formation of ligand (H2L,1), as shown in Scheme 1. The reaction of the ligand (1) with metal salts using (1:1) molar ratio, it gives complexes; (2-3), and (5-11) while complexes (4) and (12) was prepared in molar ratio 1M:2L. All prepared compounds are intensely colored, crystalline solids, stable at room temperature and do not decompose after prolonged storage. The complexes are insol- uble in water, ethanol, methanol, benzene, toluene acetonitrile, and chloroform, but completely soluble in dimethylforma- mide (DMF) or dimethyl sulfoxide (DMSO). The molar con- ductivity values of synthesized metal complexes are in the
Diameter of inhibation zone by test compound Diameter of inhibation zone by standard
6.6–25.5 Ω-1cm2mol-1 range indicating their non-electro- lytic nature.33 Analytical and spectral data are compatible with the suggested structures as shown in Figs. 1-3. The elemental analyses confirmed that the complexes (2-3), (5-10) and (11) were composed in molar ratio 1 Ligand:1 Metal, whereas the complexes (4) and (12) were found to be formed in molar ratio 2 L : 1 M. Many attempts were made to grow single crystal but unfortunately, they failed.
1H- and 13C-NMR Spectra of Ligand
The 1H-NMR spectrum of the ligand in DMSO-d6 as a solvent (Supp. 1) showed signals, which are consistent with the proposed structure. The spectrum of the ligand showed the absence of the signal of the amino group (−NH2) characteristic to the starting material (hydrazide).
The spectrum showed several signals, the chemical shifts
observed as a singlet at 11.23 (s, 1H), 10.27 (s, H), 7.87 (s, 1H), 8.34 may be assigned to the protons of the hydroxyl (OH) (11NH), and (7NH) respectively.34 The appearing of these proton resonances at high δ values could be due to their connection to extremely electronegative atoms oxygen and nitrogen. This assignment was assured by considerably decreasing intensity of these bands in the deuterated spectra.
The situation of these signal in the downfield region indi- cates the probability of hydrogen bonding formation by these hydrogen atoms.35 The azomethine proton (H-C=N) was appeared at 8.34 ppm.34b,35−36 This assignment con- firmed by the deuterated spectra in which the intensity of these bands is considerably decreased. The multiples which were appeared in the 6.47–8.46 (m, 11H) ppm range, may be attributed to the aromatic protons. It was clear from the
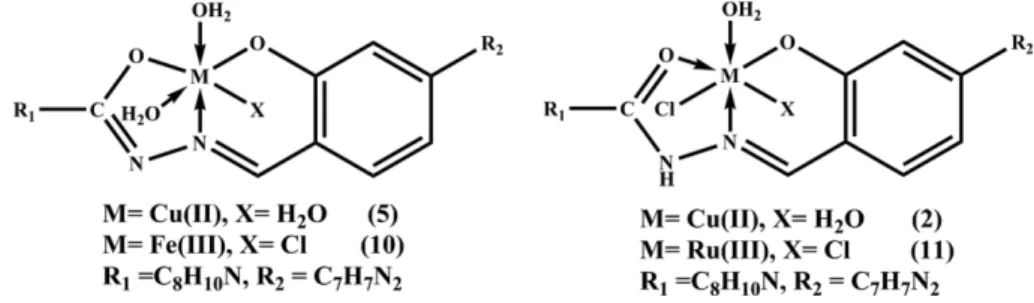
1H-NMR spectrum of the ligand that it exhibits the keto Figure 1. The structure representation of Cu(II), Fe(III), Ru(III) complexes.
Figure 2. The structure representation of Cu(II), Co(II), Mn(II), Zn(II) and Ni(II) complexes.
Figure 3. The structure representation of Cu(II), and UO2(II) complexes.
form only and no evidence for the presence of the enol form.
This result was confirmed from the appearance of the sig- nal of the (NH) and phenolic (OH) only and the absence of the (OH) signal of the enolic form which was reported by many authors.34b The 1H NMR spectrum of Zn(II) complex (8) verified that the proton of amide group CO-NH is missed denoting to the bonding of the ligand (H2L) with the Zn(II) ion in its enolic form. while phenolic protons shifted to low field at δ = 11.84 ppm, which could be due to intramolecular hydrogen bonding with the carbonyl group, since the carbonyl group is chelated with the metal ion. On the other hand, the significant downfield shift of the azome- thine (8.91 ppm) and phenolic (11.94 ppm) protons signals in the complex relative to the corresponding free ligand con- firmed the coordination of the azomethine nitrogen and phenolic oxygen atoms to the Zn(II) ion. Aromatic protons appeared in the δ = 6.59-8.15 ppm range and the singlet for methyl groups appeared at δ = 2.33 ppm. While the singlet which appeared at 1.55 ppm could be assigned to the proton of acetate group.37 The 13C-NMR spectrum of the ligand (Supp. 3) showed signal at 169.1 ppm which could be assigned to carbon atom of the carbonyl group (9C=O) while the chem- ical shift which observed at 165.1 ppm assigned to the car- bon atom attached to a hydroxyl group (15C-OH).35−36,38 While the chemical shifts of the carbons C16, C18, C24, C26, (δ = 111.3, 116.7, 123.9, 124.3 ppm) are typical values of N=N group connected to C17 (δ = 150.2 ppm) and C23 (δ = 147.2 ppm).39 The chemical shift appeared at 145.1, 141.1 ppm were assignable to the azomethine carbon (13C=N) and the aromatic carbon attached to amine group (1C-NH).35−36,38a However, the peaks observed in the 113.4-139.1 ppm range were assigned to the other aromatic carbons.38a The chem- ical shift appeared at 50.3, 21.3 and 20.5 ppm could be belonging to the proton’s methylene –CH2-N and methyl groups, respectively.40 In the 13CNMR spectrum of Zn(II) complex (Supp. 4), the carbon atoms of carbonyl, phenolic and azomethine signals shifted to up-field by about 2.5-4.7 ppm in comparing with the parent ligand. This up-field shift may be due to the movement of electron density from carbonyl δ(C=O) and azomethine linkages to the Zn(II) ion upon chelation that could have caused the carbon nuclei to be de-shielded because of the up-field shifts.41 In addition, this spectrum also shows two signal at 172.4 and 14.4 ppm which was referred to the carbon atoms of acetate group.37 FTIR Spectra
The bonding mode of the ligand in the metal complexes has been deduced from their IR spectra. The important spec- tral bands of the ligand and its metal complexes are pre-
sented in the experimental part. The spectrum of the ligand (Supp. 5) showed a medium band at 3251 cm-1 which may be assigned to the ν(11NH) group, whereas the strong band at 1690 cm-1 due to the carbonyl group of the hydrazide moiety.34c This observation indicates that the ligand is pres- ent in the ketonic form in the solid-state.42 The spectrum showed a sharp band in the 3415 cm-1, which may be assigned to the stretching vibration of the phenolic hydroxyl group.34c The relatively strong and medium bands, which located at 3358, 1615, 1483 and 970 cm-1 corresponded to the amine groups (7NH), azomethine,43 azo,44 and ν(N-N) groups42 respectively. The band, which appeared at 1257 cm-1 is due to the ν(C-OH) of the phenolic moiety.42 The bonding of the ligand can be predicted by comparison the IR spectra of the complexes (Supp 6-12) with that of the free ligand.
The IR spectra data obtained for complexes showed that the ligand (H2L) behaves as either of the following evi- dence:
1) Neutral bidentate as in case of complex (4) in which the ligand coordinated to metal ions via protonated hydroxyl group and the azomethine nitrogen atom. This mode of coordination can be suggested by the following evidence:
i) The bands characteristic to υ(11NH) and carbonyl groups were still present in the same position indicating that the carbonyl group did not take part in the coordination. ii) The bands characteristic to the azomethine and hydroxyl groups were shifted and appeared as week band. At the same time, the band due to υ(N-N) was shifted to a higher frequency. This shift refers to the increase in the double bond character is off-setting the loss of electron density via elec- tron donation to the metal ions and further confirmation of the coordination of the ligand via the azomethine and hydroxyl groups.43
2) Monobasic bidentate as in complex (12) in which the ligand bonded to the metal ions through the enolic carbonyl oxygen (C-O), and azomethine nitrogen (C=N) atoms. This bonding behavior was confirmed by: (i) the bands char- acteristic to the carbonyl ν(C=O), and ν(NH) groups van- ished referring that the ligand bonded in its enolic form via enolic carbonyl oxygen, which is further assured by the occur- rence of new peaks in the 1547, 1375 cm-1 attributing to the ν(N=C-O) and ν(C-O), respectively.45 (ii) The characterized frequency of the azomethine group lowered whereas the characterized frequency of ν(N-N) increases and appear- ing at 1014 cm-1. The increment in the frequency of ν(N-N) band is an obvious reference to the increasing in the double bond property is off-setting the lack of electron density via electron donation to the metal ions and further confirmed that the azomethine group participate in the chelation pro-
the ligand (1) bonded to the metal ions in its enolic form via enolic carbonyl oxygen atom, which is further supported by the appearance of new bands in the 1525-1595 and 1300-1321 cm-1 ranges corresponding to the υ(N=9C-O) and υ(9C-O), respectively.45 ii) The characteristic bands of azomethine and hydroxyl groups band υ(C=N) shifted or appeared as a week band in 1600-1610 and 1247-1257 cm-1. At the same time, the band due to υ(N-N) was shifted to a higher frequency and appeared in 1009-1038 cm-1 range.
This shift refers to the increase in the double bond character is off-setting the loss of electron density via electron dona- tion to the metal ions and further confirmation of the coor- dination of the ligand via the azomethine group.43
4) Dibasic tridentate as in complex (5) and (10) in which the ligand (1) bonded to the copper and ferric ions through the enolic carbonyl oxygen (C-O), deprotonated hydroxyl oxygen and azomethine nitrogen atoms. This bonding behaviour was supported by the next evidences: i) the bands characteristic to the carbonyl and ν(11NH) groups vanished referring that, the ligand (1) bonded via its enolic carbonyl oxygen atom, which is furthermore confirming by the occur- rence of new bands at 1537, 1531; 1373, 1370 cm-1 referring to the ν(N=9C-O), and ν(9C-O), respectively.45 (ii) The band characteristic to ν(C=N) group lowered to 1604 and 1608 respectively where the peak belongs ν(N-N) shifted to a higher frequency and appearing at 1014, 999 cm-1. The increment in the frequency of ν(N-N) bond is an obvious reference to the increasing in the double bond property is off-setting the lack of electron density via electron donation to the metal ions and further confirmed that the azomethine group takes part in the chelation.43 (iii) The shifting in the peak characteristic to phenolic hydroxy group and disappearing of the peak assigned to hydroxyl proton indicating that the deprotonated phenolic oxygen atom participates in the bonding. The appearance of new bands in the 507-594, 500-532 and 458-507 cm-1 ranges for the prepared complexes may be assigned to υ(M—O), υ(M←O) υ(M←N). Also, appearance of new bands in 458–513 cm-1 range may be assigned to υ(M←N) respectively. These peaks confirm that linkage between ligand and metal ions occurred via oxygen atoms of the enolic/ketonic, protonated/deprotonated phenolic hydroxyl groups as well as azomethine nitrogen atom.44−46 The nitrate
plex (3) showed (Δν) value equal to 39 cm which is a typical value for a unidentate nitrates bonding. In acetate com- plexes, the acetate ion may be coordinate to the metal ion in unidentate, bidentate or bridging bidentate behavior.47 The νas(CO2) and νs(CO2) of the free acetate ion is ca. 1560 and 1416 cm-1, respectively. In unidentate acetate complexes ν(C=O) is higher than νs(CO2) and ν(C-O) is lower than νas(CO2). As a consequence, the isolation between the two ν(CO) is higher in unidentate than in free ion but in bidentate the isolation is lower than in the free ion whilst in bridging bidentate the two n(CO) is closer to the free ion.47b In com- plexes (4) and (6-9) the presence of two new peaks in the 1540-1562 and 1335-1376 cm-1 ranges are imputed to the symmetric and asymmetric stretching vibration of the acetate group. The coordination mode of acetate group was deduced from the value of the observed separation (Δ) between the νasy(COO) and νsy(COO). The (Δ) values between νasy(COO) and νsy(COO) in (4) and (6-9) complexes were in the 171- 210 cm-1 range supporting the coordination of acetate group in a monodentate fashion.47b,47c,48 The IR spectrum of the UO2)II) complex showed a peak at 956 cm-1 which could be imputed to ν(O=U=O).49
Magnetic Moment
The magnetic moments of the (2-7) and (9-11) complexes were measured at room temperature and were presented in Table 1. The values of magnetic moment indicating that these complexes are paramagnetic. The copper(II) complexes (2-5) showed values in the 1.70-1.80 Bohr Magnetons (B M) range, which are appropriate with one unpaired electron sys- tem in octahedral environment.34b Cobalt(II) complex (6) shows value 4.33 indicating a low spin cobalt(II) complex.50 Nickel(II) complex (9) shows the value of 3.2 BM, which is consistent with two unpaired electrons system of the octahedral nickel(II) complex.51 The magnetic moment val- ues of manganese(II) (7) and iron(III) (10) complexes are 5.88 and 5.90 BM, respectively. This suggests octahedral geometry around the manganese(II) and octahedral iron(III) complexes.52 The magnetic moment value of the ruthe- nium(III) complex (11) is 1.71 BM, which is characteristic of d5 low spin ruthenium(III) complex.45,50
Electronic Spectra
The electronic absorption spectral data of the ligand (1) and its metal complexes in DMF solutions (Supp. 13) are localized in Table 1. The structure of the ligand revealed that, the two lone pairs of electrons for the azo group is not the only interacting non-bonding electrons, since the hydrazone moiety of the ligand contains carbonyl and azomethine which represents an extra source of lone pair of electrons.
Thus other ν→π* transitions is expected to take place from these non-bonding orbitals to different molecular orbital extending over such a large molecules.53 The data revealed that, the ligand comprised three sets of peaks in the UV and visible regions. The first set of the shortest wavelengths appeared at 261 and 295 nm may be assigned to the π→π*
transitions in the intra ligand and benzenoid moiety.34b,38a The second set observed at 321 and 360 nm may be assigned to n→π* transitions of the azomethine and carbonyl groups.34b,38a The third set comprise of two bands: the first one located at 383 nm, which could be attributed to π→π*
transition involving the π electron of the azo group.53−54 Whereas the second band located in the visible region at 440 nm could be assigned to π→π* transition involving the whole electronic system of the compounds with a con- siderable charge transfer character arising mainly from the phenolic moiety.53−54 The spectrum of copper complexes (2-5) showed a broad band centered in the 520–670 nm range. The position as well as the broadness of this band
indicated that copper(II) complexes have a tetragonally distorted octahedral geometry (Figs. 1-3). This broad band consists of three superimposed transitions 2B1g→2Eg, 2B1g
→2A1g and 2B1g→2B2g transition.47c,55 The cobalt(II) com- plex (6) showed bands at 500, 555, 850 nm, which could imputed to (υ3)4T1g(F)→4T2g(P), (υ2)4T1g(F)→4A2g(F) (υ1)4T1g(F)→4T2g(F) transitions respectively, referring to high spin cobalt(II) octahedral complex (Fig. 2).45,55b The υ2/υ1 ratio for the complex is 1.44 which is lower than the regular range for octahedral cobalt(II) complexes (1.95–2.48), referring that this Cobalt(II) complex has a distorted octa- hedral geometry.56 Manganese(II) complexes (7) displays week absorption bands at 460, 490, 555 and 670 nm assigned to 6A1g→4T1g(4G)(υ1), 6A1g→4Eg(4G)(υ2), 6A1g→4Eg(4D)(υ3) and 6A1g→4T1g(4p)(υ4) transitions respectively, which charac- teristic to manganese(II) in an octahedral geometry (Fig.
2).55b,57 Nickel(II) complex (9) exhibits three bands located at 500, 555, 800 nm which may be assigned to 3A2g(F)→
3T1g(P)(υ3), 3A2g(F)→3T1g(F)(υ2) and 3A2g(F)→3T2g(F)(υ1) spin allowed transitions, which are characteristic to nickel(II) ion in an octahedral structure (Fig. 2).55b,57−58 The υ2/υ1 ratio for the complex is 1.31 which is less than the usual range (1.5-1.75), indicating a distorted octahedral nickel(II) complex.58a Iron(III) complex (10) revealed two bands at 530 and 650 nm which may be assigned to 6A1g→4T2g and
6A1g→4T1(G) transitions. These bands are characteristic of an octahedral iron(III) complex (Fig. 1).55b,59 The ground Table 1. UV-Vis. spectra of the ligand (H2L) and its metal complexes
No Bands in DMF Electronic transition μeff (BM) Geometry
1 261,295, 321, 360 383, 440 n →π*
π →π* ---- ---
2 280, 320, 350, 380, 435, 670
(ν3) 2B1g→2Eg, (dx2-y2→dxy) (ν2) 2B1g→2B2g (dx2-y2→dyz dxz) (ν1) 2B1g→2A1g (dx2-y2→dz2)
1.70
Tetragonally distorted octahedral
3 270, 320, 345, 375, 415, 520 1.80
4 270, 345, 375, 430, 460, 550 1.78
5 285, 300, 315, 345, 400, 440, 640 1.75
6 245, 320, 385, 415, 440, 500, 555, 850
4T1g (F)→4T1g(P)
4T1g(F)→4A2g
4T1g(F)→4T2g(F)
4.33 Distorted
octahedral
7 280, 345, 375, 430, 460, 490, 555
(υ1)6A1g→4T1g(4G) (υ2)6A1g→4Eg(4G) (υ3)6A1g→4Eg(4D) (υ4)6A1g→4T1g(4p)
5.88 Octahedral
8 257, 270, 336, 366, 395, 420 LMCT Dia. --
9 250, 285, 340, 385, 415, 460, 500, 555, 800
3A2g(F)→3T1g(P)(υ3)
3A2g(F)→3T1g(F)(υ2) 3A2g(F)→3T2g(F)(υ1) 3.2 Distorted octahedral 10 255, 298, 326, 373, 390, 433, 480, 530, 650
6A1g→4T2g
6A1g→4T1(G) 5.90 Octahedral
11 250, 293, 339, 377, 400, 455, 510, 620 LMCT
2T2g→2A2g 1.71 Octahedral
12 270, 287, 345, 365, 390, 440, 490 LMCT Dia. --
observed for other octahedral ruthenium(III) complex (Fig. 1).55b,60 The electronic absorption spectrum of UO22+
complex (12) showed one band at 490 nm which may be acribed to ligand to uranium charge transfer.61 The diamag- netic complexes zinc(II) (8) does not show d-d transitions.
The bands observed are due to intra-ligand transitions.
Thermal Analysis
To obtain further information about the thermal stability as well as the nature of water molecules in the complexes structure the TG analysis of complexes (2), (4-5) and (9-11) were recorded in temperature 25-800 °C range (Supp. 14- 17). The results of the thermal analysis are shown in Table 2.
The thermal data revealed that the weight loss of the cal- culating and proposed formulae is agreeable and referred that the complexes are mostly decomposed in two, three or four stages that can be interpreted as following:
1. Dehydration process as in complex (11) which took place in the 22-80 °C range with losing in weight equal to 5.87(5.75)% corresponding to removal of two water molecules (Table 2).
2. In the TG of complexes (2), (5) and (9-11) there is a step occurred in the temperature ranged 95 to 225 °C with
plexes through departure of the organic part in the 210- 720 °C leaving the metal oxide which can be confirmed from the percentage of weight loss (Table 2).
In-vitro Antimicrobial Activity
Well Diffusion Method at 10 mg/mL concentration in DMSO was used to measure the antimicrobial activity against E. coli, B. subtilis and A. niger. The results (Table 3) showed that complex (12) is inactive against all used strains while the other synthesized complexes were more active than ligand but less than standard drug with IZ ranged from 11-14 mm and AI ranged from 65-82%. The most active complex was the iron(III) complex (10) with 14 mm inhi- bition zone (AI=82%), and the second was manganese com- plex (7) with 13 mm inhibition zone (AI=76%). The order of antifungal activity is (10)>(7)>(3)=(9)=(11)>(2)=(6) >
(1)=(4)=(8) as shown in Fig. 4. In the case of antibacterial activity against E. coli, the complex (3) is inactive, while the ligand and other complexes showed low activity in compar- ison with Tetracycline as an antibacterial standard drug.
The order of antibacterial activity against E. coli is (7)>
(10)>(5)>(6)=(9)>(11)>(2)=(4)>(Ligand)=(8) as shown in Fig. 4. While in the case of antibacterial activity against Table 2. The thermal analysis (TG) of some complexes
No. Temp. range (oC)
Weight Loss (%)
Found (calcd.) Assignment Composition of
the residue (2)
105-170 170-230 230-532
6.92(6.73) 6.45 (6.62) 69.77 (71.80)
Los of coordinated water molecules (2H2O) Loss of chloride ions (Cl)
Decomposition of the complex forming CuO
[Cu(HL)Cl]
[Cu(HL)]
CuO (4) 270-310
320-620
11.77(12.07) 79.20 (79.85)
Loss of two acetate ions (2CH3COOH) Decomposition of the complex forming CuO
[Cu(H2L)2] CuO (5) 145-220
220-430
33.50(33.64) 51.89(52.02)
Los of three coordinated water molecules and C8H10N2 Decomposition of the complex forming CuO
[Cu(L- C8H10N2)]
CuO (9)
175-225 230-330 330-445
5.96 (6.50) 17.00(16.17) 63.01(63.89)
Los of coordinated water molecules (2H2O) Loss of acetate ions (CH3COOH) and 2CH3 Decomposition of the complex forming NiO
[Ni(HL)(OAc)]
[Ni(HL-2CH3)]
NiO (10)
95-145 160-190 220-600
6.34 (6.84) 6.51 (6.73) 69.00(71.27)
Los of coordinated water molecules (2H2O) Loss of chloride ions (HCl)
Decomposition of the complex forming Fe2O3
[Fe(L)Cl]
[Fe(L)]
Fe2O3
(11)
22-80 80-120 120-245 250-690
6.06(5.75) 2.61(2.88) 11.30 (11.33) 60.00 (60.07)
Dehydration process (2H2O)
Los of coordinated water molecules (H2O) Loss of chloride ions (2HCl)
Decomposition of the complex forming Ru2O3
[Ru(HL)Cl2(H2O)]
[Ru(HL)Cl2] [Ru(HL)]
Ru2O3
B. subtilis, the ligand and complex (8) are inactive, while the other complexes showed low activity in comparison with Tetracycline as an antibacterial standard drug. The anti- bacterial activity order against B. subtilis is (5)=(10)>(2)>
(6)=(9)=(11)>(4)>(7)>(3) as shown in Fig. 4. The variation
in the activity of different complexes against different micro- organisms depend either on the impermeability of the microbial cells or differences in the ribosomes of microbial cells. The increased activity of the metal complexes can be explained based on Overtone’s and Tweedy’s theories. It Figure 4. Antimicrobial activities of ligand and its complexes against A. flavus, C. albicans, E. coli and S. aureus.
Table 3. Biological activities of the ligand and its metal complexes against bacteria and fungus
Compounds
Inhibition zone (IZ/mm)/Activity index (AI/%)
A. niger E. coli B. subtilis
IZ(mm) AI(%) IZ(mm) AI(%) IZ(mm) AI(%)
DMSO 0 0 0 0 0
Amphotericin B 17 100 -- -- -- --
Tetracycline -- 35 100% 38 100%
Ligand 10 59% 8 23% 0 0%
Complex (2) 11 65% 9 26% 16 42%
Complex (3) 12 71% 0 0% 8 21%
Complex (4) 10 59% 9 26% 14 37%
Complex (5) 0 0% 15 43% 18 45%
Complex (6) 11 65% 14 40% 15 39%
Complex (7) 13 76% 18 51% 13 34%
Complex (8) 10 59% 8 23% 0 0%
Complex (9) 12 71% 14 40% 15 39%
Complex (10) 14 82% 17 49% 18 47%
Complex (11) 12 71% 10 29% 15 39%
the lipophilic character of the metal chelate and favors its permeation through the lipoid layer of the organism mem- brane. There are other factors which also increase the activity, which are the number of coordination sites, size of complex, solubility, conductivity and the bond lengths between the metal and the coordinated ligand atom.62
CONCLUSION
Cu(II), Ni(II), Co(II), Mn(II), Zn(II), Fe(III), Ru(III), and UO2(II) complexes of a azo-hydrazone ligand, 2-hydroxy-4- (p-tolyldiazenyl) benzylidene)-2-(p-tolylamino) acetohy- drazide (H2L) were synthesized by a direct method. The new synthesized compounds were characterized by elemental and thermal analyses IR, NMR, and electronic absorption spectra as well as molar conductivity, magnetic moment.
The data of various analyses revealed that the ligand che- lated to the metal ions as a neutral/monobasic bidentate, monobasic/dibasic tridentate fashion through azomethine nitrogen, protonated/deprotonated phenolic hydroxyl group and/or ketonic/enolic carbonyl group Forming distorted octahedral or octahedral geometry around the centre metal ions. The thermal analysis confirmed that complexes (2), (4-5) and (9-11) were decomposed in two, three or four stages starting with dehydration process, removal of coordination water molecules and/or elimination of anions and ended with complete degradation of the complexes with the forma- tion metal oxide. The antimicrobial activity of prepared compounds E. coli, B. subtilis and A. sniger showed that these compounds exhibit a low activity in comparing with standard antifungal and antibacterial drugs.
Acknowledgments. Publication cost of this paper was supported by the Korean Chemical Society.
REFERENCES
1. Fischer, E., Verbindungen des Phenylhydrazins mit den Zuckerarten. 1884, 17, 579.
2. (a) Barakat, A.; Soliman, S. M.; Ali, M.; Elmarghany, A.;
Al-Majid, A. M.; Yousuf, S.; Ul-Haq, Z.; Choudhary, M.
I.; El-Faham, A. Inorg. Chim. Acta 2020, 503, 119405;
(b) Li, Y.; Li, Y.; Liu, X.; Yang, Y.; Lin, D.; Gao, Q. J.
J. Organomet. Chem. 2020, 914, 121225.
5. Szklarzewicz, J.; Jurowska, A.; Matoga, D.; Kruczała, K.;
Kazek, G.; Mordyl, B.; Sapa, J.; Papież, M. Polyhedron 2020, 185, 114589.
6. Sreepriya, R. S.; Kumar, S. S.; V, S.; S, B.; Meena, S. S.
J. Mol. Struct. 2020, 1201, 127110.
7. El-Barasi, N. M.; Miloud, M. M.; El-ajaily, M. M.; Moha- patra, R. K.; Sarangi, A. K.; Das, D.; Mahal, A.; Parhi, P. K.;
Pintilie, L.; Barik, S. R.; Amin Bitu, M. N.; Kudrat-E- Zahan, M.; Tabassum, Z.; Al-Resayes, S. I.; Azam, M. J.
Saudi Chem. Soc. 2020, 24, 492.
8. Çınarlı, M.; Yüksektepe Ataol, Ç.; Çınarlı, E.; İdil, Ö. J.
Mol. Struct. 2020, 1213, 128152.
9. Chimmalagi, G. H.; Kendur, U.; Patil, S. M.; Gudasi, K.
B.; Frampton, C. S.; Budri, M. B.; Mangannavar, C. V.;
Muchchandi, I. S. Appl. Organomet. Chem. 2018, 32, e4337.
10. Hegde, Ganesh S.; Sandeep P. Netalkar.; and Vidyanand K. Revankar. Applied Organometallic Chemistry, 2019, 33, e4840.
11. Dehestani, L.; Ahangar, N.; Hashemi, S. M.; Irannejad, H.; Honarchian Masihi, P.; Shakiba, A.; Emami, S. Bio- org. Chem. 2018, 78, 119.
12. Heydari, R.; Motieiyan, E.; Aliabadi, A.; Abdolmaleki, S.; Ghadermazi, M.; Yarmohammadi, N. Polyhedron 2020, 181, 114477.
13. Patel, A. K.; Jadeja, R. N.; Roy, H.; Patel, R. N.; Patel, S.
K.; Butcher, R. J.; Cortijo, M.; Herrero, S. Polyhedron 2020, 186, 114624.
14. Popiołek, Ł.; Patrejko, P.; Gawrońska-Grzywacz, M.;
Biernasiuk, A.; Berecka-Rycerz, A.; Natorska-Chomicka, D.; Piątkowska-Chmiel, I.; Gumieniczek, A.; Dudka, J.;
Wujec, M. Biomedicine & Pharmacotherapy 2020, 130, 110526.
15. Benkhaya, S.; M'Rabet, S.; El Harfi, A. Inorg. Chem. Com- mun. 2020, 115, 107891.
16. Aljamali, N. M.; Habeab, A. A.; Alfatlawi, I. O. Int. J.
Chem-inf. Res. 2019, 5, 41.
17. Benkhaya, S.; M'Rabet, S.; El Harfi, A. Heliyon 2020, 6, e03271.
18. (a) Aamoum, A.; Waszkowska, K.; Taboukhat, S.; Płóci- ennik, P.; Bakasse, M.; Boughaleb, Y.; Strzelecki, J.; Kor- cala, A.; Sofiani, Z.; Zawadzka, A. Optical and Quantum Electronics 2019, 52, 35; (b) Abdel-Rahman, L. H.; Abu- Dief, A. M.; Moustafa, H.; Abdel-Mawgoud, A. A. H.
Arab. J. Chem. 2020, 13, 649.
19. Ghanavatkar, C. W.; Mishra, V. R.; Sekar, N. Spectrochim.
Acta Part A Mol. Biomol. Spectrosc. 2020, 230, 118064.
20. Mallikarjuna, N. M.; Keshavayya, J.; Prasanna, B. M.;
Praveen, B. M.; Tandon, H. C. J. Bio- and Tribo-Corrosion 2019, 6, 9.
21. (a) Alhakimi, A. N. Egypt. J. Chem. 2020, 63, 1509; (b) Aly, S. A.; Fathalla, S. K. Arab. J. Chem. 2020, 13, 3735.
22. (a) Patel, A. K.; Jadeja, R. N.; Butcher, R. J.; Kesharwani, M. K.; Kästner, J.; Muddassir, M. Polyhedron 2021, 195, 114969; (b) Abu-Dief, A. M.; El-Metwaly, N. M.; Alz- ahrani, S. O.; Bawazeer, A. M.; Shaaban, S.; Adam, M.
S. S. J. Mol. Liquids 2021, 322, 114977; (c) Mohamad, A. D. M.; Abualreish, M. J. A.; Abu-Dief, A. M. J. Mol.
Liquids 2019, 290, 111162.
23. Traven, V. F.; Cheptsov, D. A.; Mamirgova, Z. Z.; Solov- jova, N. P.; Martynenko, V. M.; Dolotov, S. M.; Kray- ushkin, M. M.; Ivanov, I. V. J. Photochem. Photobiol. B Biol. 2020, n/a.
24. (a) Said, M. A.; Al-unizi, A.; Al-Mamary, M.; Alzahrani, S.; Lentz, D. Inorg. Chim. Acta 2020, 505, 119434; (b) Almáši, M.; Vilková, M.; Bednarčík, J. Inorg. Chim. Acta 2021, 515, 120064; (c) Bera, P.; Aher, A.; Brandao, P.;
Manna, S. K.; Bhattacharyya, I.; Pramanik, C.; Mandal, B.; Das, S.; Bera, P. J. Mol. Struct. 2021, 1224, 129015;
(d) Fathi, A. M.; Mandour, H. S.; HassaneAnouar, E. J.
Mol. Struct. 2021, 1224, 129263; (e) Sun, Y.; Lu, Y.;
Bian, M.; Yang, Z.; Ma, X.; Liu, W. Eur. J. Med. Chem.
2021, 211, 113098.
25. Lawrence, M. A. W.; Lorraine, S. C.; Wilson, K.-A.; Wil- son, K. Polyhedron 2019, 173, 114111.
26. (a) Liu, J. N.; Wu, B. W.; Zhang, B.; Liu, Y. Turk. J.
Chem. 2006, 30, 41; (b) Shakdofa, M. M. E.; El-Saied, F.
A.; Al-Hakimi, A. N. Main Group Chem. 2012, 11, 189.
27. (a) Jeffery, G. H.; Bassett, J.; Mendham, J.; Denney, R.
C., Vogel's Textbook of Quantitative Chemical Analysis.
5th ed.; John Wiley & Sons Inc: 1989; (b) Svehla, G., Vogel’s textbook of macro and semi micro Quantitative inorganic analysis. 5th ed.; Longman Inc.: New York, 1979; p 617.
28. Shakdofa, M. M. E.; El-Saied, F. A.; Rasras, A. J.; Al- Hakimi, A. N. Appl. Organomet. Chem. 2018, 32, e4376.
29. Lewis, L.; Wilkins, R. G., Modern Coordination Chem- istry. Interscience: New York, 1960.
30. Boggess, R. K.; Zatko, D. A. J. Chem. Educ. 1975, 52, 649.
31. (a) Collee, J. G.; Mackie, T. J.; McCartney, J. E., Mackie
& McCartney practical medical microbiology. 14 ed ed.;
Churchill Livingstone: New York, 1996; p 978; (b) Holder, I. A.; Boyce, S. T. Burns 1994, 20, 426.
32. Zaky, R. R.; Ibrahim, K. M.; Gabr, I. M. Spectrochim.
Acta Part A Mol. Biomol. Spectrosc. 2011, 81, 28.
33. Geary, W. J. Coord. Chem. Rev. 1971, 7, 81.
34. (a) Al-Ne’aimi, M. M.; Al-Khuder, M. M. Spectrochim.
Acta Part A Mol. Biomol. Spectrosc. 2013, 105, 365; (b) Gup, R.; Kirkan, B. Spectrochim. Acta Part A Mol. Bio- mol. Spectrosc. 2005, 62, 1188; (c) Maurya, M. R.; Khu- rana, S.; Schulzke, C.; Rehder, D. Eur. J. Inorg. Chem. 2001, 779.
35. Bessy Raj, B. N.; Prathapachandra Kurup, M. R.; Suresh,
E. Spectrochim. Acta Part A Mol. Biomol. Spectrosc.
2008, 71, 1253.
36. (a) Hosseini Monfared, H.; Kheirabadi, S.; Asghari Lalami, N.; Mayer, P. Polyhedron 2011, 30, 1375; (b) Bayoumi, A. H.; Alaghaz, M. A. A. N.; Aljahdali, M. S.
Int. J. Electrochem. Sci. 2013, 8, 9399.
37. Azam, M.; Al-Resayes, S. I.; Pallepogu, R.; Firdaus, F.;
Shakir, M. J. Saudi Chem. Soc. 2016, 20, 120.
38. (a) Kurtoǧlu, M.; Ispir, E.; Kurtoǧlu, N.; Serin, S. Dyes Pigm. 2008, 77, 75; (b) Aly, S. A.; Fathalla, S. K. Arab.
J. Chem. 2020.
39. Mohamad M. E. Shakdofa; El-tabl, A. S.; Al-hakimi, A.
S.; Wahba, M. A.; Morsy, N. Ponte 2017, 73, 52.
40. Han, H. O.; Kim, S. H.; Kim, K. H.; Hur, G. C.; Joo Yim, H.; Chung, H. K.; Ho Woo, S.; Dong Koo, K.; Lee, C. S.;
Sung Koh, J.; Tae Kim, G. Bioorg. Med. Chem. Lett.
2007, 17, 937.
41. Andrew, F. P.; Ajibade, P. A. J. Mol. Struct. 2018, 1170, 24.
42. Xu, G. C.; Zhang, L.; Liu, L.; Liu, G. F.; Jia, D. Z. Poly- hedron 2008, 27, 12.
43. Samanta, B.; Chakraborty, J.; Shit, S.; Batten, S. R.; Jen- sen, P.; Masuda, J. D.; Mitra, S. Inorg. Chim. Acta 2007, 360, 2471.
44. Bhosale, J. D.; Shirolkar, A. R.; Pete, U. D.; Zade, C. M.;
Mahajan, D. P.; Hadole, C. D.; Pawar, S. D.; Patil, U. D.;
Dabur, R.; Bendre, R. S. J. Pharm. Res. 2013, 7, 582.
45. Singh, B.; Srivastava, P. Transition Met. Chem. 1987, 12, 475.
46. El-Wahab, Z. H. A.; Mashaly, M. M.; Salman, A. A.; El- Shetary, B. A.; Faheim, A. A. Spectrochim. Acta Part A Mol. Biomol. Spectrosc. 2004, 60, 2861.
47. (a) Chandra, S.; Gupta, L. K. Spectrochim. Acta Part A Mol. Biomol. Spectrosc. 2005, 61, 1181; (b) Nakamoto, K., Infrared and Raman Spectra of Inorganic and Coor- dination Compounds, Part B, 6th ed.; John Wiley & Sons INC: USA, 2009; (c) El-Tabl, A. S.; Shakdofa, M. M. E.;
Shakdofa, A. M. E., J. Serb. Chem. Soc. 2013, 78, 39.
48. Gupta, L. K.; Bansal, U.; Chandra, S. Spectrochim. Acta Part A Mol. Biomol. Spectrosc. 2007, 66, 972.
49. El-Dissouky, A.; Fahmy, A.; Amer, A. Inorg. Chim. Acta 1987, 133, 311.
50. Fouda, M. F. R.; Abd-Elzaher, M. M.; Shakdofa, M. M.;
El-Saied, F. A.; Ayad, M. I.; El Tabl, A. S. J. Coord.
Chem. 2008, 61, 1983.
51. (a) Al-Hakimi, A. N.; Shakdofa, M. M. E.; El-Seidy, A.
M. A.; El-Tabl, A. S. J. Korean Chem. Soc. 2011, 55, 418;
(b) Al-Hazmi, G. A. A.; Metwally, N. E. Arab. J. Chem.
2017, 10, S1003.
52. Shakdofa, M. M.; Al-Hakimi, A. N.; Elsaied, F. A.; Alas- bahi, S. O.; Alkwlini, A. M. Bull. Chem. Soc. Ethiop. 2017, 31, 75.
53. Rageh, N. M.; Mawgoud, A. M. A.; Mostafa, H. M. Chem.
Pap. 1999, 53, 107.
54. Gup, R.; Giziroglu, E.; Kirkan, B. Dyes Pigm. 2007, 73,
24, 113.
58. (a) El-Tabl, A. S.; El-Enein, S. A. J. Coord. Chem. 2004, 57, 281; (b) Graham, B.; Spiccia, L.; Skelton, B. W.;
White, A. H.; Hockless, D. C. R. Inorg. Chim. Acta 2005, 358, 3974.
59. Tiliakos, M.; Cordopatis, P.; Terzis, A.; P. Raptopoulou, C.; Perlepes, S. P.; Manessi-Zoupa, E. Polyhedron 2001,
2001, 26, 96.
62. (a) Creaven, B. S.; Duff, B.; Egan, D. A.; Kavanagh, K.;
Rosair, G.; Thangella, V. R.; Walsh, M. Inorg. Chim. Acta 2010, 363, 4048; (b) Tümer, M.; Köksal, H.; Sener, M.
K.; Serin, S. Transition Met. Chem. 1999, 24, 414; (c) Tweedy, B. G. Phytopathology 1964, 55, 910.