Sino-Globalization Network of Chinese Migrants, Students, and
Travellers
Yupeng Zhu1, Hyejin Park2, Han Woo Park3*
1Blockchian Policy Research Center, Cyber Emotions Rsearch Institute, YeungNam University
2Department of Educational Theory and Practice, State University of New York at Albany
3Interdisciplinary Program of Digital Convergence Business, East Asian Cultural Studies, Department of Media and Communication, YeungNam University
중국 이민자, 유학생, 여행자를 통해서 본 세계화 네트워크
주우붕1, 박혜진2, 박한우3*
1영남대학교 사이버감성연구소 블록체인정책연구센터, 2뉴욕주립대학교 알바니,
3영남대학교 언론정보학과, 디지털융합비즈니스학 대학원, 동아시아문화학 대학원
Abstract This study examined Sino-globalization through the network analysis of Chinese immigrants, international students, and travelers. The data were collected from the United Nations for immigrants, UNESCO for international students, and Ministry of Culture and Tourism of China for travelers.
Consequently, Chinese immigrants and international students' favorite destinations were advanced Western countries, and Chinese travelers showed a high preference for Asian regions. Specifically, Thailand was the most popular destination for traveling, while the U.S. appeared to be the main destination for Chinese immigrants and students. The QAP analysis results showed a statistically significant correlation between the immigrant network and international student network. MR-QAP analysis found a causal relationship between the two networks. These findings may serve as empirical evidence for the Chinese government to review potential opportunities and problems related to Sino-globalization and provide the basis for preparing policy measures for other countries. Subsequent studies should compensate for research limitations by analyzing specific factors affecting national choice of Chinese immigrants, students, and travelers. The economic, social, and cultural impacts of China's globalization on other countries need to be discussed using qualitative research.
요 약 이 연구는 중국인이 세계화로 편입되는 상황에서 나타나는 이민자, 유학생, 여행자의 네트워크 분석을 통해 중국 세계화 현황을 살펴보는 것을 목적으로 한다. 글로벌 네트워크에서 중국 이민자, 유학생, 여행자의 연관성을 제시하였다.
분석 방법은 UN의 이민자 데이터와 UNESCO의 유학생 데이터, 중국문화여행부의 여행자 데이터를 이용하여 중국 세계 화의 관점에서 네트워크 및 QAP분석을 이용하였다. 분석결과 첫째, 이민이나 유학은 선진국으로 향하는 경향이 강했고, 여행은 아시아 지역에 대한 선호도가 높은 것으로 나타났다. 국가별로 태국은 여행자 네트워크에서, 미국은 이민자와 유학생 네트워크의 주요 목적지로 나타났다. 둘째, QAP 기반 통계적 상관관계 분석결과 중국 이민자들과 유학생들로 구성된 매트릭스 간 상관관계가 유의미한 것으로 나타났다. MR-QAP 분석을 통해 유학생과 이민자 네트워크가 높은 결정계수를 보여 두 변수 간 인과관계가 높은 것으로 나타났다. 이 분석을 통해 중국의 세계화에 따른 기회와 문제점을 검토하고 각국별 정책적 대책을 마련할 수 있는 실증적 근거를 제시하였다. 후속 연구에서는 중국 유학생과 중국 이민자 의 국가 선택 요인, 중국의 세계화가 다른 나라들에 미치는 경제적, 사회적, 문화적 영향을 다각도로 분석하여 이 연구의 제한점을 보완할 것이다.
Keywords : China, Migrant, Traveller, Oversea Student, Sino-Globalization, Network Analysis
This work was supported by the 2020 Yeungnam University Research Grant
*Corresponding Author : Han Woo Park(Yeungnam Univ.) email: hanpark@ynu.ac.kr
Received May 25, 2020 Revised July 20, 2020 Accepted September 4, 2020 Published September 30, 2020
1. Introduction
In December, 1978, Chinese government implemented China’s reform and opening-up policy. It had gradually departed from the full planned economy and developed good ties with other countries based on the Five Principles of Peaceful Coexistence at the National Congress of the Communist Party of China that was held in 1987[1]. Since 1992, it had confirmed socialist market economy with the increasing private enterprises and globalization in various areas including business, culture, and tourism.
Especially, as China joined World Trade Organization(WTO), a wide range of areas such as trade, economy, culture, tourism, scholarly research was developed worldwide between China and other countries[2]. In 2013, Chinese government proposed the Belt and Road Initiative(BRI) that means the Silk Road Economic Belt and 21st Century Maritime Silk Road. China’s BRI aims at having effective platforms between China and collaborating countries to develop economic cooperation based on the concept of the Silk Road in the Han Dynasty of China, which is to establish the cross-continental community in diverse areas including politics, economy, culture[3,4]. Until January in 2020, China concluded cooperation with 138 countries including South Korea and 30 international organizations[5]. Europe is an important continent for the BRI, while Italy is the country that firstly joined the BRI among the EU countries[6]. China, in the forefront of trade and economy in the world, became an influencer that changed the worldwide economic situation and affected various fields such as politics, culture, and science and technology. Researchers insisted that the world structure will change having either one superpower, two superpowers, or multiple potential superpowers in ten years[7].
Particularly, the current globalization process is facing resistances against globalization, while
U.S.-centric world system is unfavorable for cultural diversity and impartial trade. In this situation, countries such as Iran and Pakistan provide better symbiotic development platforms than China, expecting global cooperation in line with search for common features with China and complement of different features with it. Also, uncertainty in EU countries aligned with Brexit, the United Kingdom’s withdrawal from the EU, influences the direction of the globalization. In particular, due to the increasing COVID-19 positive cases and deaths, the present world economy is unstable and under the process of potential revolution. Therefore, it is time to investigate China-centric globalization and global network. This research aims to examine the China-centric globalization process and features of its networks by analyzing immigrant network, international student network, and traveler network.
2. Research Method and Design
2.1 Data Collection and FormatThe present research investigated the datasets of migrants, international students, and travelers.
The data of migrants was obtained from United Nations[8], international student data from UNESCO Institute for Statistics[9], and traveler data from Ministry of Culture and Tourism of the People’s Republic of China[10], respectively. The datasets of migrants, students and travelers were collected in February, 2020. As a mater of act, all three datasets were not in network format. To make matters worse, both migration and student flow data were not composed in a networked way. Since automated parsing techniques can not be employed, it took a quite long time to manually configure the collected data for network analysis.
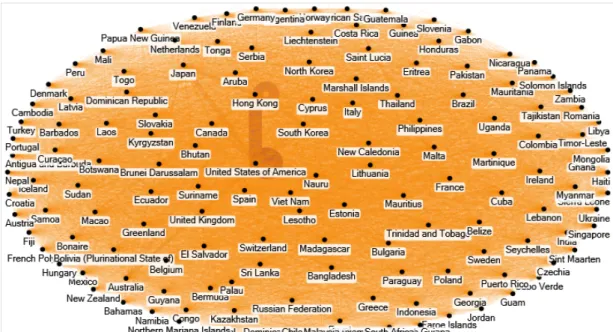
More specifically, the migrants data included 143 countries by the year of 2019. For the
Fig. 1. International network of immigrants international student data, the number of the Chinese students studying in 78 other countries in 2017 was retrieved from the UNESCO. Lastly, the travelers’ data had 30 countries where people traveled between January and September in 2019 from China and the other rest of the World. The data was converted into a n x n matrix format for network analysis. During this period, standard matrix mutiplication algorithm based on the sums of cross-products, embedded in the UCInet software, was employed after log transformation[11]. The values between specific countries (regarded as nodes in network analysis), indicated in a cell in n x n matrix, show the relationship between them in terms of the international flows from a perspective of China[12, 13].
2.2 Network Analysis
This paper uses a social network analysis that is an effective way to grasp relations between China and each country at a glance[14-16]. In addition, eigenvector centrality measures were used to examine the networked positions of
individual countries[17]. Network diagrams were created using the NodeXL.
Finally, the QAP (Quadratic Assignment Procedure) was conducted to compare the structural similarity among matrices. QAP is an algorithm that test the correlation between networks through two steps. In the first step, it measures Pearson’s correlation coefficient between corresponding cells in matrices. In the second step, it randomly arranges rows and columns in a matrix and calculates correlation, which is followed by hundreds times of iteration to further measure the ratio of the cases that the correlation coefficient in the second step is larger than that in the first step. The significance below 0.05 indicates strong relationship between matrices[18]. The present research adopted the significance below 0.005 in order for conducting much stricter statistical analysis. Multiple regression quadratic assignment procedures (MR-QAP) embedded in the UCInet was also tested to examine the multiple linear regression between square matrices[19].
3. Results
3.1 Sino-Globalization network of Chinese Migrants
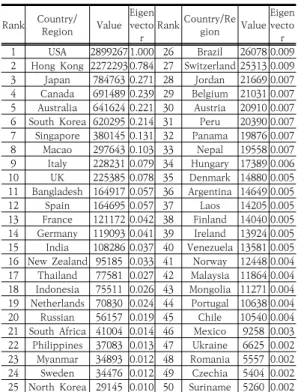
Chinese emigrated to 143 countries. As shown in Table 1, the top countries that had over 0.5 million Chinese immigrants included United States of America (2899267 immigrants), Hong Kong (2272293), Japan (784763), Canada (691489), Australia (641624), and South Korea (620295). European countries such as Italy (228231), United Kingdom (225385), Spain (164695), France (121172), or Germany (119093) also received immigrants from China. It illustrates that America, Asia, Oceania, and Europe were the popular continents where Chinese emigrated; on the other hand, Africa was not popular destination of their emigration.
Rank Country/Region Value Eigen vecto
r Rank Country/Region ValueEigen vecto 1 USA 2899267 1.000 26 Brazil 26078 0.009r 2 Hong Kong 2272293 0.784 27 Switzerland 25313 0.009 3 Japan 784763 0.271 28 Jordan 21669 0.007 4 Canada 691489 0.239 29 Belgium 21031 0.007 5 Australia 641624 0.221 30 Austria 20910 0.007 6 South Korea 620295 0.214 31 Peru 20390 0.007 7 Singapore 380145 0.131 32 Panama 19876 0.007 8 Macao 297643 0.103 33 Nepal 19558 0.007 9 Italy 228231 0.079 34 Hungary 17389 0.006 10 UK 225385 0.078 35 Denmark 14880 0.005 11 Bangladesh 164917 0.057 36 Argentina 14649 0.005 12 Spain 164695 0.057 37 Laos 14205 0.005 13 France 121172 0.042 38 Finland 14040 0.005 14 Germany 119093 0.041 39 Ireland 13924 0.005 15 India 108286 0.037 40 Venezuela 13581 0.005 16 New Zealand 95185 0.033 41 Norway 12448 0.004 17 Thailand 77581 0.027 42 Malaysia 11864 0.004 18 Indonesia 75511 0.026 43 Mongolia 11271 0.004 19 Netherlands 70830 0.024 44 Portugal 10638 0.004 20 Russian 56157 0.019 45 Chile 10540 0.004 21 South Africa 41004 0.014 46 Mexico 9258 0.003 22 Philippines 37083 0.013 47 Ukraine 6625 0.002 23 Myanmar 34893 0.012 48 Romania 5557 0.002 24 Sweden 34476 0.012 49 Czechia 5404 0.002 25 North Korea 29145 0.010 50 Suriname 5260 0.002 Table 1. Top 50 countries in terms of number of
Chinese immigrant
Table 1 shows that the U.S. held the higher values in eigenvector centrality indicator than other countries, followed by Hong Kong, Japan, South Korea, Canada, and Australia. Overall, the top 10 countries are developed economically and located in North America, Asia, and Oceania. The countries ranked below 10 include developing countries. Fig. 1 shows that central nodes such as the U.S. and Hong Kong were located in the center of network diagram as the thickness of lines between them indicate the strength of their relations. The network was visualized using Harel-Koren Fast Multiscale algorithm available in the NodeXL.
3.2 Sino-Globalization network of Chinese international students
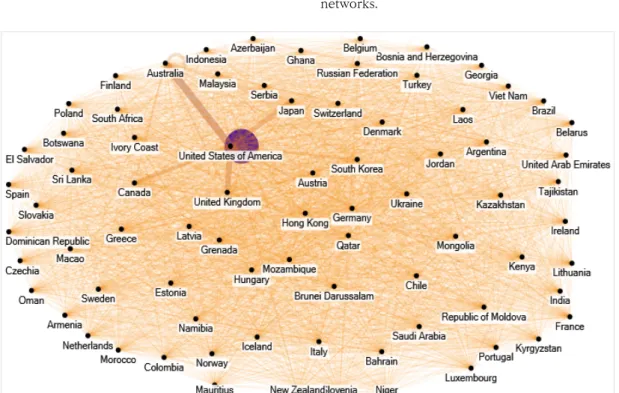
It was found that students from China studied in 78 oversea countries. United States of America was the primary country where Chinese students studied the most, the total of which was more than the sum of the students studying in Australia and United Kingdom. The top 50 countries that received Chinese students are displayed in Table 2. As indicated, Chinese students studied mostly in America, Asia, Oceania, and Europe were the major continents than Africa, which is the similar phenomena found in migrants data.
Table 2 shows that the U.S. had the higher values in eigenvector centrality indicators than other countries, followed by Australia, United Kingdom, Japan, Canada, and South Korea.
Overall, the top 10 countries are developed economically and located in North America, Asia, and Oceania. The countries ranked below 10 include developing countries. In general, the top 20 countries were developed countries located in North America, Asia, Australia, and Europe. And Fig. 2 is an international network of overseas students.
Fig. 2. International network of overseas students Rank Country/Region Value Eigen
vecto r
Rank Country/Regi
on ValueEigen vecto r 1 USA 321624.8 1.000 26 Denmark 1107 0.003 2 Australia 128498 0.400 27 Mongolia 969 0.003 3 UK 96543 0.300 28 Poland 937 0.003 4 Japan 79375 0.247 29 Saudi Arabia 862 0.003 5 Canada 66161 0.206 30 Indonesia 630 0.002 6 South Korea 44163 0.137 31 Belgium 607 0.002 7 Hong Kong 28736.77 0.089 32 Austria 576.5 0.002 8 Germany 27765 0.086 33 Argentina 566 0.002 9 France 24788 0.077 34 Portugal 488 0.002 10 New Zealand 17645.97 0.055 35 Norway 468 0.001 11 Italy 14531 0.045 36 USA 424 0.001 12 Macao 14013 0.044 37 Jordan 355 0.001 13 Russian 11950 0.037 38 Brazil 319 0.001 14 Malaysia 10880 0.034 39 Kyrgyzstan 270 0.001 15 Netherlands 4929 0.015 40 Czechia 251 0.001 16 Sweden 2396 0.007 41 South Africa 192 0.001 17 Spain 2211 0.007 42 India 177 0.001 18 Ireland 2012 0.006 43 Laos 125 0.000 19 Finland 1738 0.005 44 Estonia 109 0.000 20 Switzerland 1678 0.005 45 Luxembourg 84 0.000 21 Hungary 1574 0.005 46 Azerbaijan 76 0.000 22 Turkey 1517 0.005 47 Sri Lanka 73 0.000 23 Belarus 1507 0.005 48 Morocco 57 0.000 24 Kazakhstan 1377 0.004 49 Lithuania 45 0.000 25 Ukraine 1252 0.004 50 Greece 43 0.000 Table 2. Top 50 countries in terms of number of
Chinese students 3.3 Sino-Globalization Network of Chinese
travelers
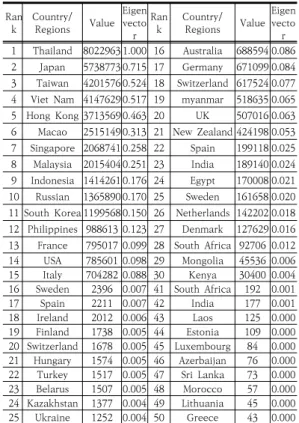
Table 3 shows top 30 countries that Chinese travel. They often travel Asian countries including Thailand, Japan, Taiwan, Viet Nam, Hong Kong, Macao, Singapore, Malaysia, Indonesia, South Korea, and Philippines. Many of them also travel European countries such as Russian Federation and Italy and United States of America.
Fig. 3 is an international network of overseas travellers. It uncovered that the traveler network was different from the immigrant and international student networks. The traveler network found Thailand had higher values in eigenvector centrality indicators than other countries, followed by Japan, Taiwan, Vietnam, and Hong Kong. Most of the top 10 countries on the list were Asian countries, and countries in Europe, North America, and Australia appeared afterward. This finding means that the centrality indicators in the traveler network centralized to Asia, unlike the migrant and international student networks.
Fig. 3. International network of overseas travelers Rank Country/
Regions Value Eigen vecto r
Rank Country/
Regions Value Eigen vecto r 1 Thailand 8022963 1.000 16 Australia 688594 0.086 2 Japan 5738773 0.715 17 Germany 671099 0.084 3 Taiwan 4201576 0.524 18 Switzerland 617524 0.077 4 Viet Nam 4147629 0.517 19 myanmar 518635 0.065 5 Hong Kong 3713569 0.463 20 UK 507016 0.063 6 Macao 2515149 0.313 21 New Zealand 424198 0.053 7 Singapore 2068741 0.258 22 Spain 199118 0.025 8 Malaysia 2015404 0.251 23 India 189140 0.024 9 Indonesia 1414261 0.176 24 Egypt 170008 0.021 10 Russian 1365890 0.170 25 Sweden 161658 0.020 11 South Korea 1199568 0.150 26 Netherlands 142202 0.018 12 Philippines 988613 0.123 27 Denmark 127629 0.016 13 France 795017 0.099 28 South Africa 92706 0.012 14 USA 785601 0.098 29 Mongolia 45536 0.006 15 Italy 704282 0.088 30 Kenya 30400 0.004 16 Sweden 2396 0.007 41 South Africa 192 0.001 17 Spain 2211 0.007 42 India 177 0.001 18 Ireland 2012 0.006 43 Laos 125 0.000 19 Finland 1738 0.005 44 Estonia 109 0.000 20 Switzerland 1678 0.005 45 Luxembourg 84 0.000 21 Hungary 1574 0.005 46 Azerbaijan 76 0.000 22 Turkey 1517 0.005 47 Sri Lanka 73 0.000 23 Belarus 1507 0.005 48 Morocco 57 0.000 24 Kazakhstan 1377 0.004 49 Lithuania 45 0.000 25 Ukraine 1252 0.004 50 Greece 43 0.000 Table 3. Top 30 countries in terms of number of
travelers (N=30) 3.2 Comparing Sino-Globalization network
Table 4. QAP correlations (N=16)
Student Traveler
Immigrant 0.7356* (p=0.0018) 0.04046 (p=0.4349)
Student 0.1340 (p=0.3201)
*Significant at p<0.005
Table 5. MR-QAP Results (N=16) Dependent
variable Independe
nt variable R-Square Adj R-Sqr P-value Model 1 Immigrant Student 0.5411 0.5392 0.0025
The present study conducted QAP analysis to test statistical relationships between Chinese immigrant, international student, and traveler networks. Table 4 shows the correlations between the networks. As a result, immigrant network and international student network had the strongest relationship (r=0.7356, n=16, p<0.005). This example showed statistically
meaningful relationships between the networks with p values less than 0.005, while the other network relationships had p values over 0.005.
In order to further test if there is causal relationship between the immigrant and international student networks, MR-QAP was conducted. The result shows that in Model 1, international student network predicted 54.11%
of the variance in immigrant network, with the p values less than 0.005, respectively (see Table 5).
4. Conclusion
This study used a social network method to analyze the globalization of China from three aspects: immigration, overseas student flows, and international tourism. As results, Chinese people emigrated to some 143 countries. The U.S. was the most popular nation-state for Chinese immigrants. On the other hand, Africa was not popular destination. The U.S. held the highest value in eigenvector centrality indicator than other countries, followed by Hong Kong, Japan, South Korea, Canada, and Australia. In a similar vein, Chinese students studied mostly in America, Asia, Oceania, and Europe than Africa. However, the structure of traveler network was different from immigrant and international student networks. In traveler network, Thailand had the highest value in centralities than other countries, followed by Japan, Taiwan, Vietnam, and Hong Kong. The top ten countries on the traveller’s list were mostly Asian countries. Europe, North America, and Australia appeared afterward. The reason why tourism is concentrated in Asia probably because the Asian culture and geographical location are closer to China, especially the film and television works shot in Thailand, Japan and other Asian countries make many audiences have the idea of destination tourism[20]. The present study conducted a QAP technique to test statistical relationships between
Chinese immigrant, international student, and traveler networks. Immigrant network and international student network had the strongest relationship. International student network predicted 54.11% of the variance in immigrant network, with the p value less than 0.005.
Through the results of this study, Chinese government can further develop a policy program to take advantage of some opportunities in terms of Sino-globalization, by addressing some possible problems and issue in China's 'One Belt, One Road' initiative. For example, a public diplomacy program may help some relevant countries expand the enrollment of Chinese oversea students to attract talented Chinese immigrants. In addition, we plan to make an in-depth study of the specific factors of Chinese students studying abroad and Chinese immigrants in the future, as well as the impact of Sino-globalization on other countries in terms of economy, policies, culture and life. The present study has its limitation in the fact that international students information of some countries including Singapore is not shared in the international students data of UNESCO[21].
References
[1] J. Lu, “China’s International Positioning and Its Diplomacy since Reform and Opening up,” China Int’l Stud., Vol.74, pp.33–54, 2019. Available From:
http://www.ciis.org.cn/gyzz/2019-03/05/content_4067 8817.htm
[2] X. S. Cao and S. C. Li, “Spatio-temporal eVolution of port opening in China’s 40 years of reform and opening-up period,” Plos One, Vol.14, No.8, pp.20, Aug. 2019.
DOI: https://doi.org/10.1371/journal.pone.0220912 [3] Y. C. Chang, “The ‘21st Century Maritime Silk Road
Initiative’ and naval diplomacy in China,” Ocean &
Coastal Management, Vol.153, pp.148–156, Mar. 2018.
DOI: https://doi.org/10.1016/j.ocecoaman.2017.12.015 [4] Q. Fatima and I. Naseer, “A New Era of
Multiculturalism and the Role of China’s Belt and Road Initiative (BRI) in 21 st Century,” South Asian Studies (1026-678X), Vol.34, No.1, pp.37–60, 2019.
Available From:
https://www.prdb.pk/article/a-new-era-of-multicultur alism-and-the-role-of-china-s-belt-5651
[5] BRI, “List of countries that have signed BRI cooperation documents with China,” 2020. Available From:
https://www.yidaiyilu.gov.cn/info/iList.jsp?tm_id=126
&cat_id=10122&info_id=77298 (accessed Apr. 5, 2020) [6] G. Watts, “There is no place like Rome for President
Xi,” Asia Times, March, 2019. Available From:
https://asiatimes.com/2019/03/there-is-no-place-like -rome-for-xi (accessed Apr. 10, 2020)
[7] Y. J. Sheng, “On the relationship between China and ASEAN in the changing world pattern,” China-Today Forum, Vol.10, pp.155-156+158, 2012. (in Chinese) [8] United Nations, “International migrant stock 2019,”
2020. Available From:
https://www.un.org/en/development/desa/population /migration/data/estimates2/estimates19.asp (accessed March 10, 2020)
[9] UNESCO Institute for Statistics, “Inbound internationally mobile students by region of origin,” 2020. Available From:
http://data.uis.unesco.org/Index.aspx (accessed March 10, 2020)
[10] Ministry of Culture and Tourism of the People’s Republic of China, “Statistics on outbound travel in the third quarter of 2019,” 2020. Available From:
http://zwgk.mct.gov.cn (accessed Mar. 12, 2020) [11] P. Bonacich, “Technique for analyzing overlapping
memberships,” Sociological methodology, Vol.4, pp.176–185, 1972.
DOI: https://doi.org/10.2307/270732
[12] H. W. Park, “Examining YouTube Channel in North Korea: A Case of ‘North Korea Today’ using User Response and Text Analyses,” Journal of The Korean Data Analysis Society, Vol.20, No.5, pp.2581–2592, Oct. 2018.
DOI: http://doi.org/10.37727/jkdas.2018.20.5.2581 [13] H. W. Park and S. J. Park, “Big Data Analysis of
Cryptocurrencies : Evidence from Top Cryptocurrency Websites,” Journal of The Korean Data Analysis Society, Vol.20, No.2, pp.923–936, Apr. 2018.
DOI: http://doi.org/10.37727/jkdas.2018.20.2.923 [14] Y. S. Lim, “Considering YouTube Video Network
Centrality Indices,” Journal of The Korean Data Analysis Society, Vol.21, No.6, pp.3169–3178, Dec.
2019.
DOI: http://doi.org/10.37727/jkdas.2019.21.6.3169 [15] J. C. Chung, G. A. Barnett, Y. S. Lim, J. H. Kim, S. I.
Moon, and H. W. Park, “A Structural Analysis of International Migration: Focusing on Social, Cultural, and Historical Factors,” Journal of The Korean Data Analysis Society, Vol.18, No.2, pp.671–684, 2016.
[16] M. Chong and H. W. Park, “The World of Top 1%
Researchers: Analysis of 2017 Highly Cited
Researchers with a Particular Focus on South Korea,”
Journal of The Korean Data Analysis Society, Vol.20, No.5, pp.2593–2604, Oct. 2018.
DOI: http://doi.org/10.37727/jkdas.2018.20.5.2593 [17] Y. P. Zhu and H. W. Park, “Evaluating Blockchain
Research Trend using Bibliometrics-based Network Analysis,” Journal of Digital Convergence, Vol.17, No.6, pp.219–227, Jun. 2019.
DOI: https://doi.org/10.14400/JDC.2019.17.6.219 [18] H. L. Xu and L. Cheng, “The QAP weighted network
analysis method and its application in international services trade,” Physica a-Statistical Mechanics and Its Applications, Vol.448, pp.91–101, Apr. 2016.
DOI: https://doi.org/10.1016/j.physa.2015.12.094 [19] D. Dekker, D. Krackhardt, and T. A. B. Snijders,
“Sensitivity of MRQAP tests to collinearity and autocorrelation conditions,” Psychometrika, Vol.72, No.4, pp.563–581, Aug. 2007.
DOI: https://doi.org/10.1007/s11336-007-9016-1 [20] H. Wen, B. M. Josiam, D. L. Spears, and Y. Yang,
“Influence of movies and television on Chinese tourists perception toward international tourism destinations,” Tourism management perspectives, Vol.28, pp.211-219, Oct. 2018.
DOI: https://doi.org/10.1016/j.tmp.2018.09.006 [21] G. A. Barnett, M. Lee, K. Jiang, and H. W. Park, “The
flow of international students from a macro perspective: a network analysis,” Compare-a Journal of Comparative and International Education, Vol.46, No.4, pp.533–559, 2016.
DOI: https://doi.org/10.1080/03057925.2015.1015965
Yupeng Zhu [Regular member]
• Aug. 2014 : Keimyung Univ., Mechanical and Automotive Engineering, B.S.
• Aug. 2016 : Keimyung Univ., Mechanical Engineering, MEng.
• Aug. 2020 : Yeungnam Univ., Digital Convergence Business, Ph.D.
• Aug. 2018 ∼ current : Yeungnam Univ., Blockchian Policy Research Center, Cyber Emotions Rsearch Institute, Researcher
<Research Interests>
Webometrics, Bigdata, Blockchain, Network Analysis, Scientometrics, Social Network
Hyejin Park [Regular member]
• Aug. 2010 : Yeungnam Univ., Media & Communication, Business Administration, B.A.
• Aug. 2012 : International Graduate School of English, English Language Teaching Materials Development, M.A.
• Sep. 2012 ∼ Feb. 2016 : UNIST, Language Education Center, Research Assistant
• Mar. 2016 ∼ Dec. 2016 : UNIST, Language Education Center, Staff
• Jan. 2017 ∼ current : State Univ. of New York at Albany, Dept. of Educational Theory & Practice, Ph.D. Candidate
• Jan. 2017 ∼ current : State Univ. of New York at Albany, The Technology and Co-Creativity in Learning Lab, Team member
<Research Interests>
Learning Sciences, Computer-Supported Collaborative Learning, Knowledge Building, Learning Analytics, Network Analysis
Han Woo Park [Life member]
• Feb. 1995 : Hankuk Univ.,of Foreign Studies, Media &
Communication, B.S.
• Feb. 1997 : Seoul National Univ., Media &
Communication, M.A.
• June 2002 : State Univ. of New York at Buffalo, Communication in Informatics School, Ph.D.
• Mar. 2003 ∼ current : Yeungnam Univ., Dept. of Digital Convergence Business, East Asian Cultural Studies, Dept. of Media & Communication, Professor
<Research Interests>
Webometrics, Scientometrics, Social network analysis, Social media analytics, Triple Helix