I. Introduction
Ultrasonography is often used in the diagnosis of acute ap- pendicitis in children, particularly in those cases with an atypical or equivocal clinical presentation. The role of medi- cal imaging in clinical decision making can be complex because the information provided on imaging referrals may lack comprehensive clinical history, leaving sonographers and radiologists with an incomplete clinical context [1-4].
Clinicians performing ultrasound examinations may glean information through discussions with patients and their par- ent/carer, who may have limited knowledge of clinical data,
Bayesian Approach to Predicting Acute
Appendicitis Using Ultrasonographic and Clinical Variables in Children
Tristan Reddan1,2, Jonathan Corness1, Fiona Harden3, Wenbiao Hu4, Kerrie Mengersen2
1Medical Imaging and Nuclear Medicine, Queensland Children’s Hospital, South Brisbane, Australia
2Faculty of Science and Engineering, Queensland University of Technology, Brisbane, Australia
3Hunter Industrial Medicine, Maitland, Australia
4Faculty of Health, Queensland University of Technology, Brisbane, Australia
Objectives: Ultrasound has an established role in the diagnostic pathway for children with suspected appendicitis. Relevant clinical information can influence the diagnostic probability and reporting of ultrasound findings. A Bayesian network (BN) is a directed acyclic graph (DAG) representing variables as nodes connected by directional arrows permitting visualisation of their relationships. This research developed a BN model with ultrasonographic and clinical variables to predict acute appen- dicitis in children. Methods: A DAG was designed through a hybrid method based on expert opinion and a review of litera- ture to define the model structure; and the discretisation and weighting of identified variables were calculated using principal components analysis, which also informed the conditional probability table of nodes. Results: The acute appendicitis target node was designated as an outcome of interest influenced by four sub-models, including Ultrasound Index, Clinical History, Physical Assessment, and Diagnostic Tests. These sub-models included four sonographic, three blood-test, and six clinical variables. The BN was scenario tested and evaluated for face, predictive, and content validity. A lack of similar networks com- plicated concurrent and convergent validity evaluation. Conclusions: To our knowledge, this is the first BN model developed for the identification of acute appendicitis incorporating imaging variables. It has particular benefit for cases in which vari- ables are missing because prior probabilities are built into corresponding nodes. It will be of use to clinicians involved in ul- trasound examination of children with suspected appendicitis, as well as their treating clinicians. Prospective evaluation and development of an online tool will permit validation and refinement of the BN.
Keywords: Appendicitis, Ultrasonography, Bayesian Prediction, Pediatrics, Emergency Medicine
Healthc Inform Res. 2019 July;25(3):212-220.
https://doi.org/10.4258/hir.2019.25.3.212 pISSN 2093-3681 • eISSN 2093-369X
Submitted: March 12, 2019 Revised: May 7, 2019 Accepted: May 26, 2019 Corresponding Author Tristan Reddan
Medical Imaging and Nuclear Medicine, Queensland Children’s Hos- pital, 501 Stanley St, South Brisbane, QLD 4101, Australia. Tel: +61- 7-3068-3112, E-mail: [email protected] (https://
orcid.org/0000-0003-1843-1602)
This is an Open Access article distributed under the terms of the Creative Com- mons Attribution Non-Commercial License (http://creativecommons.org/licenses/by- nc/4.0/) which permits unrestricted non-commercial use, distribution, and reproduc- tion in any medium, provided the original work is properly cited.
ⓒ 2019 The Korean Society of Medical Informatics
such as blood test results and vital signs. Advanced integra- tion of Electronic Health Records (EHRs) and information systems can obviate this lack of clinical information and bet- ter inform radiology findings by enabling consideration of the broader clinical picture [5]. As access to EHRs increases, large amounts of data now available present clinicians with additional challenges regarding optimal integration with information obtained during medical imaging. Sonogra- phers evaluating right lower quadrant pain in children may now have access to relevant clinical data that may not have previously been provided by referrers. The development of a predictive model incorporating traditional sonographic vari- ables and relevant clinical information will facilitate a clearer understanding of the role of ultrasound in the diagnosis of appendicitis in children and a more systemic approach to in- corporating imaging findings into a broader clinical context.
A Bayesian network (BN) is a directed acyclic graph (DAG) that depicts variables as nodes, with relationships between nodes indicated by connecting directional arrows or arcs that connect them, making visualisation of complex associa- tions between variables possible [6]. The variables denoted by nodes can be continuous, but they are commonly discre- tised into a smaller number of possible states for network and computing simplicity. Care needs to be taken during this reduction of states to avoid oversimplification and the loss of useful information to the model. The states may represent categorical variables (positive/negative), ordered variables (a Likert scale), or thresholds of a continuous variable (temper- ature). The states attributed to each node can be defined by automated learning through analysis of a dataset, informa- tion in publications, standards of practice, and expert opin- ion, permitting flexibility in BN design [7]. The likelihood of a node’s state is quantified by a conditional probability table (CPT) that is calculated using existing clinical datasets, other data, published studies, and/or expert opinion. The condition of a preceding or parent node will influence the likelihood of a child node’s state; since the network is acyclic, the relationship between nodes can only be in one direction.
Nodes without parents are known as root nodes, and their CPT determined by their prior probability or the probability of its various states in the relevant population. These CPTs can then be multiplied through the network structure to ob- tain the overall probability of the outcome of interest. More- over, quantification of various scenarios can be tested on the outcome of interest node through the application of Bayes’
theorem to the network node states and their conditional probabilities [8].
Development of a BN as a predictive model for the diagno-
sis of acute appendicitis in children will permit the inclusion of important ultrasound variables familiar to sonographers.
These may be combined with clinical variables made avail- able through increased access to EHRs. This will provide a more complete representation of important variables, including ultrasound data, and a graphical depiction of the broader clinical context of children with suspected appendi- citis referred for ultrasound. There is potential to further de- velop a paediatric appendicitis BN as a platform for machine learning and artificial intelligence to make use of available EHR data and streamline triage for children with right lower quadrant pain by informing the BN with their clinical data and identifying patients for whom there is a higher probabil- ity of requiring urgent treatment.
Bayesian modelling incorporating medical imaging to in- form clinical decision support incorporating medical imag- ing has previously been applied to a variety of clinical areas and imaging modalities, such as mammographic diagnosis of breast cancer [9], ultrasound diagnosis of thyroid nod- ules [10], and computed tomography diagnosis of chronic obstructive pulmonary disease [11]. Although BNs have also previously been used to model the diagnosis of acute appendicitis [12], to our knowledge, this study is the first to incorporate ultrasonographic variables.
II. Methods
Where possible, data used to quantify numerical parameters for the nodes were obtained from a prior study conducted in an Australian paediatric hospital (Human Research Ethics Committee Approval No. HREC/15/QRCH/125) [13]. Chil- dren up to 16 years of age referred for ultrasound investiga- tion of the right lower quadrant were recruited with written informed consent from their parent/guardian. Data were collected on study worksheets by sonographers perform- ing the 230 eligible ultrasound studies and collated by the principal investigator. These data included the following ul- trasonographic variables: appendix diameter, appearance of peri-appendiceal mesentery, appendiceal wall hyperaemia, and the presence of an appendicolith. Other variables, in- cluding clinical history (duration of symptoms, nausea, and temperature), and blood test results (C-reactive protein lev- els, white blood cell, and neutrophil counts), were collected through review of enrolled patients’ EHRs by the principal investigator. All collected data were stored and coded in a spreadsheet.
Some variables of interest were not captured in this study (anorexia, pain migration, and rebound tenderness), and
some variables suffered from large amounts of missing data, particularly with respect to patient history and availability of blood test results. This made automated learning of the network structure and parameters impractical; therefore, the DAG was designed through a hybrid learning method [14,15]. This hybrid approach included an initial manual de- sign process based on the elicitation of expert opinion as well as a review of the relevant literature and published data used to define the model structure, sub-models, and variables se- lected [16,17]. The outcome of interest in the model was the likelihood of a child referred for ultrasound of suspected ap- pendicitis, designated the target node acute appendicitis. The target node was influenced by four sub-models: Ultrasound Index, Clinical History, Physical Assessment, and Diagnostic Tests. Clinical variables not included in the prior study were determined via review of appendicitis scoring systems used in children including the Paediatric Appendicitis Score (PAS) and the Alvarado Score [18,19]. The second design stage involved the discretisation and weighting of the identified variables, which were calculated using principal components analysis where sufficient data were available, which also in- formed the conditional probability table of nodes.
The Ultrasound Index comprised important primary and secondary sonographic criteria. The primary sonographic criteria consisted of those that necessitated direct visualisa- tion of the appendix: Appendix Diameter (mean outside diameter in mm), ‘Xmod’ and Wall Hyperaemia (absent, pres- ent), ‘Xwall’. Secondary sonographic signs included Mesentery Appearance (echogenic, normal), ‘Xmes’ and Appendicolith (present, absent) , ‘Xlith’.
The Clinical History sub-model was based on prior pub- lications and important factors identified in the PAS [19].
Nodes included Anorexia (present/absent), ‘Xanor’, Nausea (present/absent), Pain Migration to the right iliac fossa (present/absent), ‘Xmigr’; and Duration of Symptoms, which was a continuous variable (hours), ‘Xdur’. The Physical As- sessment sub-model included a patient’s temperature with a binary febrile threshold of 38°C (normal/elevated), ‘Xfeb’ and rebound tenderness (absent/present), ‘Xtend’. The Diagnostic Tests sub-model included neutrophil count with a threshold of 7.5 × 10⁹/L (normal/elevated), ‘Xneut’, white cell count with a threshold of 10 × 109/L (normal /elevated), ‘Xwcc’, and C-re- active protein with a threshold of 3 mg/L (normal/elevated),
‘Xcrp’ [19-22].
The CPT values for the four sub-model indices were cal- culated by analysing their respective contributing parent variables using principal components analysis (PCA) for the Diagnostic Tests sub-model with only continuous variables
(Xwcc, Xneut, and Xcrp). Categorical principal components analyses (CATPCA) were conducted for the remaining sub- models [23,24]. The CPT of the target acute appendicitis node was calculated by allocating equal importance to each of the four parent nodes and a 90% diagnostic accuracy considering a possible 5% false-positive and false-negative error rate [25]. GeNIe Modeler version 2.2 software (Bayes- Fusion LLC, Pittsburgh, PA, USA) was used to create a DAG that visually represents the BN. All statistical analysis was performed with IBM SPSS Statistics version 22 (IBM Corp., Armonk, NY, USA).
Confidence in model validity was considered, with BN structure, parameterisation, and network behaviour evalu- ated to ensure they were appropriate for the scope of the model [26]. The model was then assessed for the following:
nomological validity (the model fits in the broader topic domain in the literature), face validity (the model structure, node discretisation, and parameters fit with expert opin- ion), content validity (the model consists of relevant factors and relationships and reflects all known possibilities from experts and the literature), concurrent validity (the BN or a sub-section may behave in an identical way to part of anoth- er network), convergent validity (similarities exist between models that are in similar domains), discriminant validity (differences exist between models of very different domains), and predictive validity (predictive behaviour of the model is similar to that of the system that it is modelling) [26]. Op- portunities for potential applications and adaptations of the model were then considered for future projects.
Dimension2
Dimension 1 0.0
1.0
0.8
0.6
0.4
0.0
0.6 0.4
0.2 0.8
0.2 0.2
Appendicolith
MOD Echo Mes
1.0 Hyperaemia
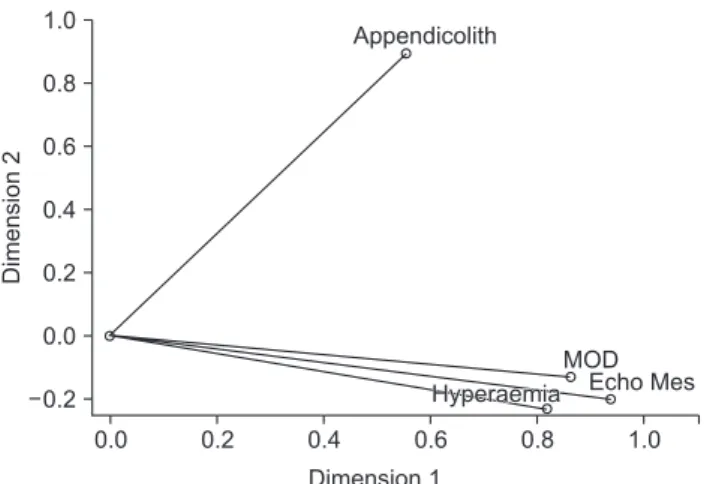
Figure 1. Two-dimensional biplot of the Ultrasound Index sub- model CATPCA components and their loadings that informed the conditional probability table of that node in the Bayesian network. CATPCA: categorical principal components analysis, MOD: mean outside diameter.
III. Results
To determine the CPT for the Ultrasound Index sub-model, a CATPCA was performed using data collected for the four identified primary and secondary ultrasound examination variables. Using varimax rotation and Kaiser normalisation, the first component of the two-dimensional model had an internal consistency coefficient (Cronbach’s alpha) of 0.783 and yielded an eigenvalue of 2.372, indicating that 59.30%
of the variance was accounted for by this component. The second component had an internal consistency coefficient of 0.352 and an eigenvalue of 1.158, accounting for 28.95% of variance. Together, the two components explained 88.25% of variance (Figure 1). The appendix diameter variable (Xmod) was discretised from a continuous variable into five catego- ries: <2.5 mm, 2.7–5.0 mm, 5.2–7.4 mm, 7.5–10 mm, and 10.4–19.0 mm. To improve the face and content validity of the discretisation, these were rounded to the nearest mil- limetre to reflect empirical values in the BN node (<3 mm, 3–6 mm, 6–8 mm, 8–10 mm, >10 mm). Component load- ings from the two CATPCA components were used to cal-
culate the CPT values for the Ultrasound Index sub-model = 0.74 (0.820Xwall + 0.940Xmes + 0.555Xlith + 0.864Xmod) + 0.26 (–0.230Xwall – 0.203Xmes + 0.892Xlith – 0.131Xmod).
The CPT for the Clinical History sub-model was deter- mined using published literature. Duration of symptoms (Xdur) was considered a binary variable using a cut-off at 36 hours, with the relatively brief timeframe of appendicitis pathogenesis in children and the risk of perforation increas- ing after that time period [19,27-30]. Other nodes were in- formed through the PAS scoring system [19]. They included anorexia (present/absent), ‘Xanor’, nausea (present/absent),
‘Xnaus’, and pain migration to the right iliac fossa (present/
absent), ‘Xmig’ [25]. Their respective positive and negative predictive values (PPV and NPV) from the literature were used to determine the latent probability of each variable to calculate CPT for the sub-model = log[CHppv(0.94Xnaus + 0.69Xdur + 0.70Xmigr + 0.88Xanor) – CHnpv(0.73Xnaus + 0.13Xdur + 0.97Xmigr + 0.89Xanor) + 4].
The CPT for the Physical Assessment sub-model was calcu- lated by running a CATPCA on the two identified variables, Xtend and Xfeb. The first component of the two-dimensional
Wall hyperaemia
Absent 78%
Present 22%
Mesententary appearance
Appendicolith
White cell count
Neutrophil count Normal 74%
Absent 93%
Normal 64%
Normal 60%
Echogen 26%
Present 7%
Elevated 36%
Elevated 40%
C-reactive protein
Diagnostic tests
Normal 58%
Suspicious 42%
Ultrasound index
Normal 66%
Suspicious 34%
Appendix diameter
Between 8 10 mm 13%
Greater than 10 mm 11%
Between 3 6 mm 46%
Between 6 8 mm 30%
Less than 3 mm 0% Duration of symptoms
Less than 35 h 36%
More than 35 h 64%
Clinical history
Normal 53%
Suspicious 47%
Acute appendicitis
Negative 53%
Positive 47%
Physical assessment
Normal 46%
Suspicious 54%
Nausea
Absent 53%
Present 47%
Anorexia
Absent 16%
Present 84%
Pain migration
Absent 60%
Present 40%
Rebound tenderness
Absent 59%
Present 41%
Febrile
Normal 34%
Elevated 66%
Normal 49%
Elevated 51%
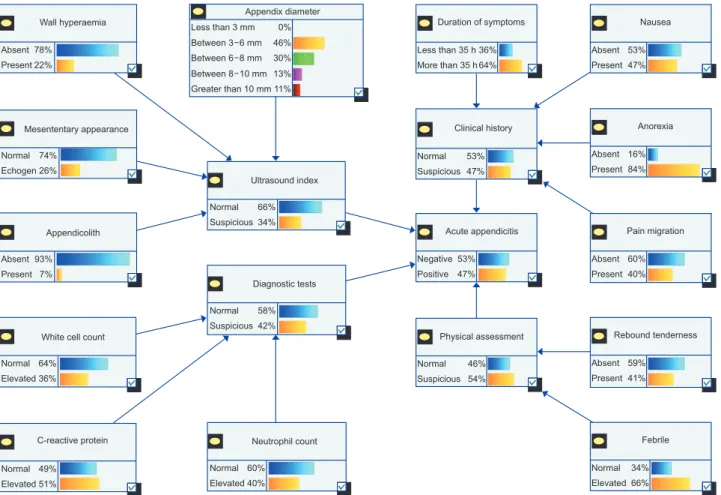
Figure 2. The structure of the Bayesian network used to model the likelihood of acute appendicitis in children referred for ultrasound examination—with conditional probabilities set to standard conditions.
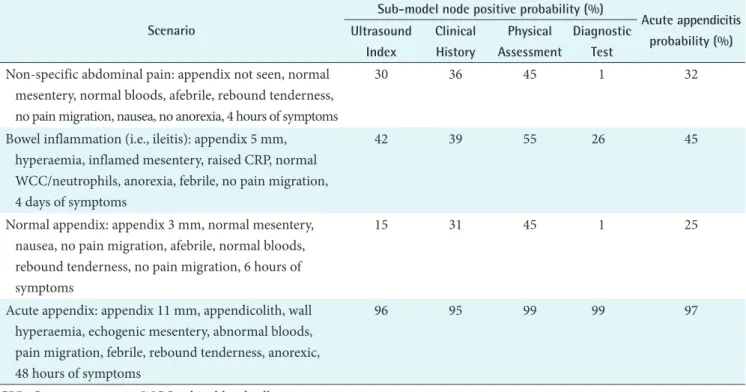
Table 1. Examples of possible clinical scenarios and the associated probabilities of key nodes in the network Scenario
Sub-model node positive probability (%)
Acute appendicitis probability (%) Ultrasound
Index
Clinical History
Physical Assessment
Diagnostic Test Non-specific abdominal pain: appendix not seen, normal
mesentery, normal bloods, afebrile, rebound tenderness, no pain migration, nausea, no anorexia, 4 hours of symptoms
30 36 45 1 32
Bowel inflammation (i.e., ileitis): appendix 5 mm, hyperaemia, inflamed mesentery, raised CRP, normal WCC/neutrophils, anorexia, febrile, no pain migration, 4 days of symptoms
42 39 55 26 45
Normal appendix: appendix 3 mm, normal mesentery, nausea, no pain migration, afebrile, normal bloods, rebound tenderness, no pain migration, 6 hours of symptoms
15 31 45 1 25
Acute appendix: appendix 11 mm, appendicolith, wall hyperaemia, echogenic mesentery, abnormal bloods, pain migration, febrile, rebound tenderness, anorexic, 48 hours of symptoms
96 95 99 99 97
CPR: C-reactive protein, WCC: white blood cell.
Wall hyperaemia
Absent 100%
Present 0%
Mesententary appearance
Appendicolith
White cell count
Neutrophil count Normal 100%
Absent 100%
Normal 100%
Normal 100%
Echogen 0%
Present 0%
Elevated 0%
Elevated 0%
C-reactive protein
Diagnostic tests
Normal 99%
Suspicious 1%
Ultrasound index
Normal 85%
Suspicious 15%
Appendix diameter
Between 8 10 mm 0%
Greater than 10 mm 0%
Between 3 6 mm 100%
Between 6 8 mm 0%
Less than 3 mm 0% Duration of symptoms
Less than 3 100%
More than 35 h 0%
Clinical history
Normal 69%
Suspicious 31%
Acute appendicitis
Negative 75%
Positive 25%
Physical assessment
Normal 55%
Suspicious 45%
Nausea
Absent 0%
Present 100%
Anorexia
Absent 100%
Present 0%
Pain migration
Absent 100%
Present 0%
Rebound tenderness
Absent 0%
Present 100%
Febrile
Normal 100%
Elevated 0%
Normal 100%
Elevated 0%
...
Figure 3. Bayesian network with evidence input to set conditional probabilities to reflect a patient with a low probability of having appendicitis.
model had an internal consistency coefficient (Cronbach’s alpha) of 0.324 and yielded an eigenvalue of 1.046, indicating that 52.30% of the variance was accounted for by this com- ponent. The second component had an internal consistency coefficient of 0.095 and an eigenvalue of 0.954, accounting for 47.70% of variance. Component loadings from the two CATPCA components were used to calculate the CPT val- ues for the sub-model = 0.52 (1.092Xfeb – 0.019Xtender) + 0.48 (0.018Xfeb + 1.024Xtender).
For the Diagnostic Tests sub-model, the suitability of PCA was assessed prior to analysis. Inspection of the correlation matrix demonstrated that all of the variables had at least one correlation coefficient greater than 0.3. The overall Kaiser- Meyer-Olkin measure was 0.584 and Bartlett's test of sphe- ricity was statistically significant (p < 0.001), indicating that the data was likely factorizable. PCA revealed that the com- ponents explained 75.43% (Xwcc), 23.41% (Xneut), and 1.16%
(Xcrp) of the total variance respectively, and cumulatively explained 100% of the total variance. Component load- ings were used to calculate CPT values for the sub-model = 0.959Xwcc + 0.955Xneut + 0.657Xcrp.
A DAG incorporating the variables and their respective
CPT values was designed (Figure 2). Nodes were con- nected via directed arrows or arcs based on literature and the opinions of experts, including a specialist paediatric radiology consultant, a specialist paediatric sonographer, a senior paediatric emergency medical officer, and a professor in statistics, who were able to inform the face and content validity. The BN was evaluated with scenarios to test confi- dence in predictive validity in cases (Table 1). This involved setting the node states to reflect common clinical scenarios in this patient cohort: general abdominal pain; diffuse bowel inflammation, such as ileitis or colitis; a low probability of appendicitis (Figure 3); and a high probability of appendici- tis with all nodes in the network set to states for an optimal positive outcome (Figure 4). No models with integration of ultrasound variables were identified in the literature, making assessment of concurrent and convergent validity difficult.
However, a BN without imaging variables consisting of 10 nodes was identified and found to have a similar structure and behaviour to the BN described in this manuscript, with eight nomologically identical nodes found in both networks [12].
Wall hyperaemia
Absent 0%
Present 100%
Mesententary appearance
Appendicolith
White cell count
Neutrophil count Normal
100%
Absent 0%
Normal 0%
Normal 100%
Echogen 0%
Present 100%
Elevated 100%
Elevated 0%
C-reactive protein
Diagnostic tests
Normal 99%
Suspicious 1%
Ultrasound index
Normal 4%
Suspicious 96%
Appendix diameter
Between 8 10 mm 0%
Greater than 10 0%
Between 3 6 mm
100%
Between 6 8 mm 0%
Less than 3 mm 0%
Normal 0%
Elevated 100%
...
Duration of symptoms
Less than 35 h More than 100%
0%
Clinical history
Normal 5%
Suspicious 95%
Acute appendicitis
Negative 3%
Positive 97%
Physical assessment
Normal 1%
Suspicious 99%
...
Nausea
Absent 0%
Present 100%
Anorexia
Absent Present 100%
0%
Pain migration
Absent Present 100%
0%
Rebound tenderness
Absent 0%
Present 100%
Febrile
Normal Elevated 100%
0%
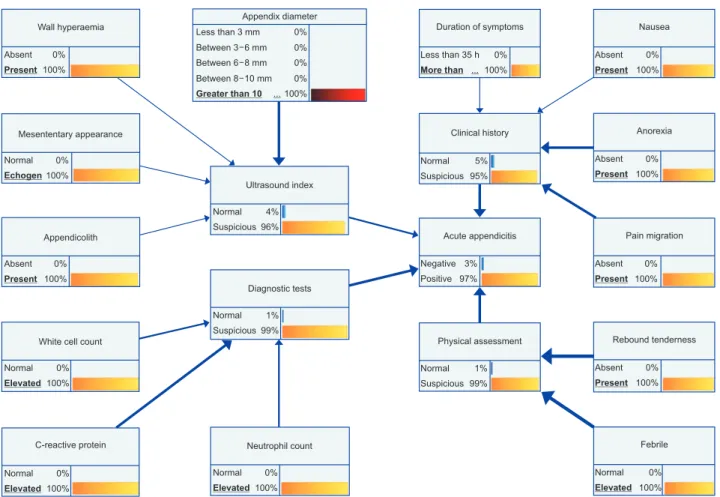
Figure 4. Bayesian network with evidence input to set conditional probabilities to reflect a patient with a high probability of having appendicitis, more influential nodes are emphasized by increased directional arrow thickness.
IV. Discussion
To our knowledge this is the first time a BN model integrat- ing ultrasound variables has been created for the diagnosis of paediatric acute appendicitis integrating ultrasound vari- ables. Through careful variable selection and design using dimension reduction techniques, PCA and CATPCA, this model provides a representation of important factors in this patient cohort. The pervasiveness of EHRs and information sharing presents an opportunity for information about a patient’s broader clinical context to be made more available to those who may be involved in their clinical pathway. The availability of large volumes of clinical data may present problems. It can be time consuming and impractical for each clinician to continually re-evaluate the information available to them as test results are returned and clinical assessments are made or revised. The potential to evaluate this infor- mation constantly through the application of a BN model developed into an online tool may permit patients who have higher probability of having appendicitis to be seen more quickly at triage or at other stages of their clinical journey.
Much of the information related to the nodes within this BN is already available, but it is often fragmented and not easily accessible. Patients and families may be asked for clinical history information by emergency clinicians that is not provided on an imaging referral. Sonographers may repeat these questions and use that information to tailor their examination, yet the information may not be passed onto a radiologist who would find it valuable in formulating a conclusion to a report. The structure of the proposed BN permits it to be employed as a tool to prompt consideration of important variables by sonographers and radiologists.
Although this model is limited in scope for application to children referred for ultrasound of suspected appendicitis, it provides a potential platform for a broader model encom- passing a greater number of variables, such as surgical or medication related considerations. Limitations of this study included the difficulty of conducting automated learning of network structure and parametrisation due to the sparse da- taset available from our prior study and a lack of open access data to use for this purpose. Moreover, the paucity of pub- lished BNs in the same or similar clinical domains, if pres- ent, may have increased confidence in validation of our BN.
Notwithstanding this, as discussed, the model construction approach adopted in this paper is well established.
The use of a visual representation of a decision-making model like a DAG in a BN is an elegant means to enable ap- preciation of a broader clinical picture. A recent survey of so-
nographers who perform paediatric appendicitis ultrasound in Australasia highlighted that they often feel removed from clinical decision-making considerations, and a better appre- ciation of the degree of suspicion of children to have appen- dicitis would assist them in performing their examinations [31]. Appendiceal sonography may require dedicated time and focus that can conflict with demands for activity and efficiency [32]. If sonographers and radiologists reporting these examinations were better informed of clinical covari- ates and their influence on the probability of appendicitis, they could better target their time and resources to cases that are more likely to be positive and therefore expedite surgical review.
The BN is able to accommodate missing data through the use of prior probabilities assigned to nodes informing the overall network. This feature of the network expands the scope of potential utilisation to clinicians outside hospital- based practice where pathology services may not be readily available, and the rate of sonographic visualisation of the appendix is known to be lower than in dedicated paediatric centres [33,34]. Therefore, children who present for ultra- sound without blood test information, and in whom the appendix cannot be identified sonographically, can still have their probability of appendicitis determined by the network.
This probability would be based on evidence from patients in prior studies and the literature (node prior probabilities), considered along with the data available at the time of their examination (clinical history, physical assessment, and sono- graphic mesentery appearance), to personalise the diagnos- tic outcome. For example, if the appendix was not identified and could not be measured or assessed for hyperaemia, the only nodes that would be updated with new information and potentially a defined state would be Xmes and Xlith. Changing the state of these nodes would then influence the Ultrasound Index CPT accordingly. The latent probabilities of Xmod and Xwall would not change their influence on the Ultrasound Index CPT would remain unchanged and based on the prior probabilities that determined their weighting.
Potential future applications may see this model integrated with an EHR or radiology information system (RIS) to pro- vide alerts to clinicians when a diagnosis probability rises above certain thresholds. More efficient triage may be pos- sible if patients and families are able to answer clinical his- tory questions through an interactive device at reception or triage; their responses could begin to prepopulate the values in the BN to prioritise assessment or ordering of diagnostic or imaging examinations that may be useful. An online tool based on this BN will be developed in collaboration with
emergency clinicians and surgeons. Future work is planned to evaluate the BN in a prospective study that will improve validation and permit refinement of the model.
Conflict of Interest
No potential conflict of interest relevant to this article was reported.
Acknowledgments
This manuscript is a component of a PhD thesis for Tristan Reddan at the Queensland University of Technology.
ORCID
Tristan Reddan (http://orcid.org/0000-0003-1843-1602) Jonathan Corness (http://orcid.org/0000-0002-3301-5319) Fiona Harden (http://orcid.org/0000-0003-4831-2292) Wenbiao Hu (http://orcid.org/0000-0001-6422-9240) Kerrie Mengersen (http://orcid.org/0000-0001-8625-9168)
References
1. Vom J, Williams I. Justification of radiographic ex- aminations: what are the key issues? J Med Radiat Sci 2017;64(3):212-9.
2. Mendelson RM, Montgomery BD. Towards appropri- ate imaging: tips for practice. Aust Fam Physician 2016;45(6):391-5.
3. Fatahi N, Krupic F, Hellstrom M. Quality of radiologists' communication with other clinicians: as experienced by radiologists. Patient Educ Couns 2015;98(6):722-7.
4. Pitman AG. Quality of referral: what information should be included in a request for diagnostic imaging when a patient is referred to a clinical radiologist? J Med Imaging Radiat Oncol 2017;61(3):299-303.
5. Kamel PI, Nagy PG. Patient-centered radiology with FHIR: an introduction to the use of FHIR to offer radi- ology a clinically integrated platform. J Digit Imaging 2018;31(3):327-33.
6. Kyburg HE. Reviewed work: Probabilistic Reasoning in Intelligent Systems: Networks of Plausible Inference by Judea Pearl. J Philos 1991;88(8):434-47.
7. Korb KB, Nicholson AE. Bayesian artificial intelligence.
2nd ed. Boca Raton (FL): CRC Press; 2011.
8. Bayes T. An essay towards solving a problem in the doc- trine of chances. 1763. MD Comput 1991;8(3):157-71.
9. Benndorf M, Kotter E, Langer M, Herda C, Wu Y, Burnside ES. Development of an online, publicly ac- cessible naive Bayesian decision support tool for mam- mographic mass lesions based on the American Col- lege of Radiology (ACR) BI-RADS lexicon. Eur Radiol 2015;25(6):1768-75.
10. Liu YI, Kamaya A, Desser TS, Rubin DL. A Bayesian network for differentiating benign from malignant thy- roid nodules using sonographic and demographic fea- tures. AJR Am J Roentgenol 2011;196(5):W598-605.
11. Thomsen LP, Weinreich UM, Karbing DS, Helbo Jen- sen VG, Vuust M, Frokjaer JB, et al. Can computed tomography classifications of chronic obstructive pul- monary disease be identified using Bayesian networks and clinical data? Comput Methods Programs Biomed 2013;110(3):361-8.
12. Sakai S, Kobayashi K, Nakamura J, Toyabe S, Akazawa K.
Accuracy in the diagnostic prediction of acute appendi- citis based on the Bayesian network model. Methods Inf Med 2007;46(6):723-6.
13. Reddan T, Corness J, Harden F, Mengersen K. Improv- ing the value of ultrasound in children with suspected appendicitis: a prospective study integrating secondary sonographic signs. Ultrasonography 2019;38(1):67-75.
14. Pourret O, Naim P, Marcot B. Bayesian networks: a practical guide to applications. Chichester, UK: John Wiley & Sons Ltd.; 2008.
15. Constantinou AC, Fenton N, Neil M. Integrating expert knowledge with data in Bayesian networks: preserving data-driven expectations when the expert variables re- main unobserved. Expert Syst Appl 2016;56:197-208.
16. Reddan T, Corness J, Mengersen K, Harden F. Sono- graphic diagnosis of acute appendicitis in children: a 3‐
year retrospective. Sonography 2016;3(3):87-94.
17. Reddan T, Corness J, Harden F, Mengersen K. Analysis of the predictive value of clinical and sonographic vari- ables in children with suspected acute appendicitis us- ing decision tree algorithms. Sonography 2018;5(4):157- 63.
18. Salo M, Friman G, Stenstrom P, Ohlsson B, Arnbjorns- son E. Appendicitis in children: evaluation of the pedi- atric appendicitis score in younger and older children.
Surg Res Pract 2014;2014:438076.
19. Samuel M. Pediatric appendicitis score. J Pediatr Surg 2002;37(6):877-81.
20. Kwan KY, Nager AL. Diagnosing pediatric appendici- tis: usefulness of laboratory markers. Am J Emerg Med 2010;28(9):1009-15.
21. Salari AA, Binesh F. Diagnostic value of anorexia in acute appendicitis. Pak J Med Sci 2007;23(1):68-70.
22. Bhatt M, Joseph L, Ducharme FM, Dougherty G, Mc- Gillivray D. Prospective validation of the pediatric appendicitis score in a Canadian pediatric emergency department. Acad Emerg Med 2009;16(7):591-6.
23. Linting M, Meulman JJ, Groenen PJ, van der Koojj AJ.
Nonlinear principal components analysis: introduction and application. Psychol Methods 2007;12(3):336-58.
24. Linting M, van der Kooij A. Nonlinear principal com- ponents analysis with CATPCA: a tutorial. J Pers Assess 2012;94(1):12-25.
25. Mostbeck G, Adam EJ, Nielsen MB, Claudon M, Clevert D, Nicolau C, et al. How to diagnose acute appendicitis:
ultrasound first. Insights Imaging 2016;7(2):255-63.
26. Pitchforth J, Mengersen K. A proposed validation framework for expert elicited Bayesian networks. Expert Syst Appl 2013;40(1):162-7.
27. Rothrock SG, Pagane J. Acute appendicitis in children:
emergency department diagnosis and management.
Ann Emerg Med 2000;36(1):39-51.
28. Reddan T, Corness J, Mengersen K, Harden F. Ultra- sound of paediatric appendicitis and its secondary so- nographic signs: providing a more meaningful finding. J
Med Radiat Sci 2016;63(1):59-66.
29. Bickell NA, Aufses AH Jr, Rojas M, Bodian C. How time affects the risk of rupture in appendicitis. J Am Coll Surg 2006;202(3):401-6.
30. Howell EC, Dubina ED, Lee SL. Perforation risk in pedi- atric appendicitis: assessment and management. Pediat- ric Health Med Ther 2018;9:135-45.
31. Reddan T, Corness J, Harden F, Mengersen K. Paediatric appendiceal ultrasound: a survey of Australasian so- nographers' opinions on examination performance and sonographic criteria. J Med Radiat Sci 2018;65(4):267- 74.
32. Cundy TP, Gent R, Frauenfelder C, Lukic L, Linke RJ, Goh DW. Benchmarking the value of ultrasound for acute appendicitis in children. J Pediatr Surg 2016;51(12):1939-43.
33. Held JM, McEvoy CS, Auten JD, Foster SL, Ricca RL.
The non-visualized appendix and secondary signs on ultrasound for pediatric appendicitis in the community hospital setting. Pediatr Surg Int 2018;34(12):1287-92.
34. Alter SM, Walsh B, Lenehan PJ, Shih RD. Ultrasound for diagnosis of appendicitis in a community hospital emergency department has a high rate of nondiagnostic studies. J Emerg Med 2017;52(6):833-8.