Vol. 14, No. 11 pp. 5586-5593, 2013
*Corresponding Author : Cheongkyu Park(Univ. of Michigan-Dearborn) Tel: +1-313-583-6556 email: parkacc@umich.edu
Received September 24, 2013 Revised (1st October 14, 2013, 2nd October 24, 2013) Accepted November 7, 2013
Corporate Social Responsibility and Financial Performance:
The impact of the MSCI ESG Ratings on Korean Firms
Jinwook Kim
1, Sunggon Chung
2and Cheongkyu Park
3*1School of Business, Konkuk University
2School of Accountancy, Singapore Management University
3College of Business, University of Michigan-Dearborn
기업의 사회책임과 재무성과:
한국기업의 MSCI ESG 평가를 중심으로
김진욱
1, 정성곤
2, 박청규
3*1건국대학교 경영학과, 2싱가폴 경영대학 회계학과, 3미시간대학교 경영대학
Abstract This study investigates how the Corporate Social Responsibility (CSR) performance of a firm is associated with its financial performance in the stock market. Prior studies provide mixed evidence on the relation between CSR and financial performance. This study sheds some lights on the positive effect of CSR on firms’ financial performance. Using a unique set of data on CSR performance of Korean firms provided by Morgan Stanley Capital International (MCSI), we find that firms’ CSR performance is positively associated with their contemporaneous stock returns and Tobin’s Q in the Korean market. This finding suggests that stock market participants value firms’ CSR activities. This is the first study that provides empirical evidence on the existence of the positive association between the CSR performance of Korean firms and their financial performance using MCSI data which is considered more reliable than the data used in the prior CSR studies in Korea.
요 약 본 논문은 기업의 사회적 책임이 재무성과에 영향을 미치는지를 고찰하였다. 선행연구들은 지금까지 일관적
이지 않은 결과를 보여주었으며, 본 연구는 기업의 사회책임이 기업의 재무성과에 긍정적인 영향을 미친다는 것을 발
견하였다. 모건스탠리에서 발간되는 한국기업의 사회적 책임 성과평가 자료를 분석한 결과, 기업의 사회적 책임과 자
본시장에서의 재무성과 간에 양의 상관관계가 있음을 발견하였다. 구체적으로 회귀분석의 결과 기업의 사회책임 평가
가 한 단계 높으면 주가수익률이 평균 3.4% 정도 높은 것으로 나타났다. 본 연구의 결과는 다른 나라의 자료를 토대
로 하는 선행연구의 결과를 지지하며, 한국기업의 사회적 책임에 대한 체계적이고 분석적인 평가 결과를 제공하였다
는 데에 의의가 있다.
Key Words : Corporate Social Responsibility, Finantial Performnce, ESG
1. Introduction
“The Social Responsibility of Business Is to Increase Its Profits”
-Milton Friedman (A Nobel laureate), The New York Times, 1970
Milton Friedman in his influential article (Friedman 1970) argues that Corporate Social Responsibility (hereafter CSR) can improve corporate financial performance by satisfying stakeholders’ expectations.
Since Friedman (1970), a number of studies have examined the role of CSR in an economy and the effect
of CSR on firm’s financial performance. However, the studies on this association provide mixed evidence (Clacher and Hagendorff, 2012 and Orlitzky et al., 2003).
Using a unique dataset of Korean companies’ CSR performance, this study investigates the association between CSR performance of the Korean companies and their financial performance and provides direct evidence that CSR improves firm values in the Korean stock market. More specifically, we find that firms with higher CSR performance have better stock market performance, measured by the contemporaneous stock returns and Tobin’s Q during the sample period.
This study contributes to the literature in various ways.
First, this is, to our best knowledge, the first study examining the association between firms’ CSR scores and their performance in the Korean stock market. Evidence on this relation in the Korean market is limited due to the data availability. Many studies investigate CSR, in general, with the data available in other countries (mostly from the U.S.). For Korean companies, prior studies use the data collected by a survey-type method or data included in the index released by Korea Economic Justice Institute (KEJI). These types of data lack totality of CSR performance because of their subjective nature. In fact, recent studies question the credibility of CSR data used in the prior studies (Cho et al., 2013). In our study, however, we collect a comprehensive data set provided by Morgan Stanley Capital International’s Environmental, Social and Governnance Research Inc (hereafter MSCI ESG) from the University of Michigan and use the data with permission of MSCI ESG Research. This MSCI ESG data provides more comprehensive and detailed ratings for companies’ CSR performance with a number of subcategories. Also, each rating is analyzed by experts covering specific industries and countries for a long time (e.g., CFAs).
Second, the results indicate that evidence of the positive association between CSR scores and firms’ stock market performance in the prior U.S. literature is supported in the Korean market. As indicated in Dhaliwal et al. (2012), the relationship between CSR and firm performance can vary across countries due to the differences in institutional factors such as legal systems, disclosure environment, and accounting standards.
Finally, we extend research on CSR reporting in
Korea. A growing number of companies in Korea have been interested in CSR activities. Indeed, more companies are engaged in CSR activities nowadays than before.
However, there is no standardized CSR reporting system in Korea, presumably due to the lack of evidence on the relationship between CSR and financial performance.
Taken together, the current study empirically investigates our research question of whether the CSR performance is associated with firms’ financial performance with comprehensive ratings in Korea.
2. Literature Review
2.1 Corporate Social Responsibility
There has been a significant increase in CSR activities and initiatives around the world for the last two decades.
For example, many companies such as Target and Merck invest a substantial amount of money in CSR initiatives (Xueming et al., 2006). This trend seems to continue because companies believe that they benefit from CSR initiatives. Taneja et al. (2011) finds that CSR activities can be employed as corporate strategies to improve firm performance. They argue that CSR initiatives can provide diverse benefits to companies. For example, CSR can affect corporate reputation, customer satisfaction, and financial performance (Taneja et al., 2011).
2.2 The Relation Between CSR and Financial Performance
In stakeholder theory, Donaldson and Preston (1995) demonstrate that firms can improve the value of stakeholder and increase the value of the firm by engaging in CSR activities. Waddock and Graves (1997) analyze the cost/benefit of CSR activities and argue that the potential benefits of such activities to the firms can exceed the related costs. The disclosure literature also supports the positive association between CSR and firms’
financial performance. Several studies find that greater disclosure of a firm’s CSR activities (1) increases investors’ awareness of a firm; (2) improves risk-sharing;
(3) reduces information asymmetry between the corporate managers and investors; and (4) decreases the cost of equity capital (Merton, 1987; Verrecchia, 2001; Dhaliwal
et al., 2011). These findings suggest that firms have incentives to increase their value by disclosing more of their CSR activities. Recent studies provide more direct evidence on the positive association between CSR performance and a firm value. Using both accounting and equity market measures, Baird et al. (2012) find that there is a significant and positive association between firms’
CSR scores and their financial performance. However, the findings in Baird et al. (2012) are limited to certain industries because an individual firm’s response to the demand of its stakeholder may affect the outcomes of CSR performance.
Furthermore, a number of studies examine the effect of CSR on firms’ informational environment (e.g., information asymmetry). Considering that firms’
informational environment directly affects firm value, these studies shed some light on the association between firms’ CSR performance and their values in the stock market. Dhaliwal et. al. (2012) find that the issuance of CSR reports reduces the analyst forecast error and that the reduction is larger in countries where CSR performance is more likely to affect firms’ financial performance. This finding is supported by another study which shows that CSR performance is negatively associated with the degree of information asymmetry (Cho et al., 2013). Another stream of CSR studies finds that (1) the CSR activities improve firm performance in the debt market (Menz, 2010); (2) more socially responsible firms perform better in emerging markets (Zhang and Rezaee, 2009); and (3) CSR reduces firms’ systematic risk (Park et al., 2013).
These studies, however, do not provide clear evidence that these associations exist in the Korean capital market.
In addition, our results are based on a comprehensive set of CSR ratings provided by a leading expert of CSR evaluation (MSCI ESG).
3. Methodology
3.1 ESG (Environmental, Social and Governance) Scores
We collect sample firms from MSCI ESG database.
MSCI has rated about 100 firms listed in the Korean capital market and published credible reviews and ratings for those firms since 2011. Most of firms started to be in
the coverage from late 2011. Only a few firms (e.g., large multinational firms) have been rated before 2011. The firms are rated on a scale ranging from AAA to CCC, relative to the performance of their industry peer groups.
The mean value of ratings is about BB. Total 110 firm-year observations (96 unique firms) with required financial data are used for the analysis. We collect the financial data from KIS-value, firms’ websites, and the Korea Composite Stock Price Index (KOSPI). We believe that MSCI ESG score is the most reliable and credible CSR ratings for Korean firms available for academic purposes for the following reasons. Although several other resources (such as Fortune Magazine and Financial Times) provide CSR performance, their evaluations of CSR performance are not comprehensive, and, thus, investors may not be able to understand firms’ CSR performance. Also, their coverage is limited to the US firms or large multinational firms such as Toyota and BP.
To our best knowledge, this is the first study to include the credible CSR ratings of many Korean firms.
MSCI, founded in 1969, is a leading provider of decision tools to investment institutions. Its products and services include global equity indices, performance analytics, and governance tools. MSCI ESG Intangible Value Assessment is one of MSCI’s products and provides ratings, research, and analysis firms’ risks and strengths arising from ESG (Environment, Social, and Governance) factors. Through a comprehensive analysis of firm’s ESG-driven factors, the report rates individual firm based on how well the firm is managing its risks or long-term value that may not be evaluated by traditional financial reporting (e.g., annual financial report). In order to rate the firms, MSCI collects and reviews documents such as annual reports (e.g., Form 10-K), environmental and social reports, securities fillings (e.g., Form 8-K), firms’ websites.
3.2 Financial Performance
We employ two stock-based measures of firms’
financial performance. These measures are market-adjusted stock returns and Tobin’s Q. The market-adjusted returns (MKTADJR) are measured by subtracting market returns (MKTRET), indexed by KOSPI, from the raw (buy-and-hold) returns (RAWRET) on individual firm for over the 12 month period ending.
The calculation of market-adjusted returns (MKTADJR) begins in investment month and ends 3 months after the month of CSR rating reported. For example, for the firm with the CSR rating reported in November 2012, we define the investment month as March 2012 (8 months prior to the reporting month), and calculate the market-adjusted returns for the next 12 months ending in February 2013. As in previous studies that calculate market-adjusted returns, we measure the returns using the similar procedures described in Fama and French (1992).
The market-adjusted returns (MKTADJR) for sample firm i in time t following the investment month is computed as:
MKTADJ=
(1+Rit) +
(1+Rmt)
where Rit is firm i’s raw return for month t, and Rmt is the market return for month t.
The second measure of firm valuation is Tobin’s Q.
Tobin’s Q is the ratio of the market value of a firm over the value of firm’s physical asset. This ratio indicates how the market values firm’s existing assets. In particular, we follow prior studies (Lee and Grewal, 2004) to calculate Tobin’s Q. Tobin’s Q for firm i in year t is computed as:
Q = (market value of equity + preferred stock + short-term liabilities - short-term assets - book value of long-term debt)/book value of total assets
3.3 Test Model
To test our research question, we regress firm valuation variables on CSR ratings and other control variables. The following equation indicates our regression model.
Financial Performance = β0 + β1 CSR + β2 ROA + β3
SIZE + β4 R&D + β5 LEV + β6 CFO + ε
The dependent variable is financial performance described in the previous section. CSR is the CSR rating that is converted from letter grade (e.g., AAA) to numerical scale (e.g., 1-7). We also include other control variables such as return on asset (ROA), firm size (SIZE), research and development (R&D), leverage (LEV), liquidity (LIQ), and cash flows (CFO). Prior studies find that these variables are likely to affect the firm financial
performance.
4. Results
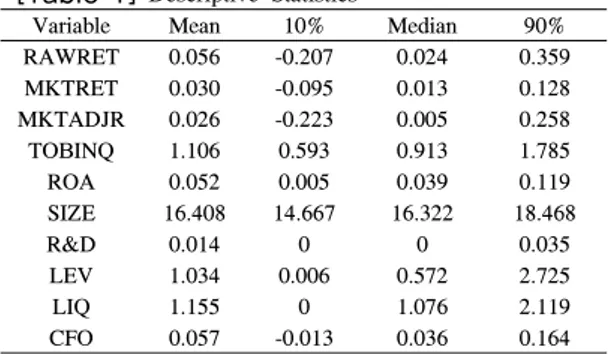
Table 1 describes the descriptive statistics of variables used in the regression test. The average stock market performance by sample firms is about 5% (0.056) and the market bench mark is about 3% (0.03) in the same period.
This means that the sample firms in the MSCI coverage perform well, on average, in the market during the sample period. Tobin’s Q also confirms that the market valuation of firms is higher than their assets (e.g., greater than 1).
The size of firms, measured by the log of total assets, indicates that the sample firms are relatively large and the size difference among firms is not significant. R&D, LEV, LIQ, and CFO are scaled by the beginning of assets for the regression analysis.
[Table 1] Descriptive Statistics
Variable Mean 10% Median 90%
RAWRET 0.056 -0.207 0.024 0.359 MKTRET 0.030 -0.095 0.013 0.128 MKTADJR 0.026 -0.223 0.005 0.258
TOBINQ 1.106 0.593 0.913 1.785
ROA 0.052 0.005 0.039 0.119
SIZE 16.408 14.667 16.322 18.468
R&D 0.014 0 0 0.035
LEV 1.034 0.006 0.572 2.725
LIQ 1.155 0 1.076 2.119
CFO 0.057 -0.013 0.036 0.164
Table 2 presents the correlations among variables. It shows that three market-based variables are correlated each other and that they are valid for the dependent variables (MKTADJR and TOBINQ) in this study. The variables of firm performance (ROA, R&D, CFO) are expected to be positively correlated with the dependent variables, and the table indicates the positive correlations.
The correlations between Size and other variables present the negative signs. We interpret this as big companies are less profitable (ROA), poorly perform in the capital market (Stock returns), and less liquid (LIQ). However, we cannot generalize it because our sample includes relatively big companies with small number of sample size in Korea. The correlations of other variables are signed as expected, but some are statistically insignificant.
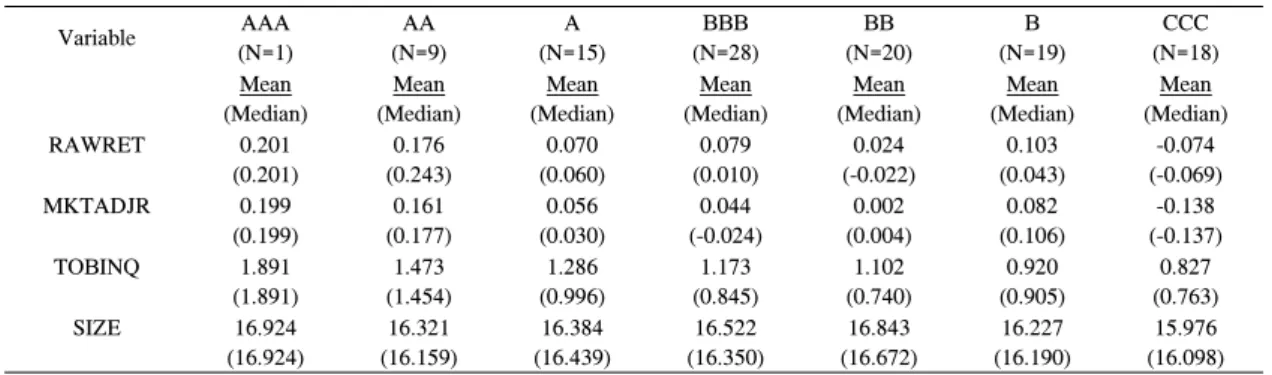
[Table 3] Descriptive Statistics by CSR Ratings (Selective variables)
Variable AAA
(N=1)
AA (N=9)
A (N=15)
BBB (N=28)
BB (N=20)
B (N=19)
CCC (N=18) Mean
(Median)
Mean (Median)
Mean (Median)
Mean (Median)
Mean (Median)
Mean (Median)
Mean (Median)
RAWRET 0.201
(0.201)
0.176 (0.243)
0.070 (0.060)
0.079 (0.010)
0.024 (-0.022)
0.103 (0.043)
-0.074 (-0.069)
MKTADJR 0.199
(0.199)
0.161 (0.177)
0.056 (0.030)
0.044 (-0.024)
0.002 (0.004)
0.082 (0.106)
-0.138 (-0.137)
TOBINQ 1.891
(1.891)
1.473 (1.454)
1.286 (0.996)
1.173 (0.845)
1.102 (0.740)
0.920 (0.905)
0.827 (0.763)
SIZE 16.924
(16.924)
16.321 (16.159)
16.384 (16.439)
16.522 (16.350)
16.843 (16.672)
16.227 (16.190)
15.976 (16.098) [Table 2] Correlations among Variables
(1) (2) (3) (4) (5) (6) (7) (8) (9)
(1)RAWRET 1 0.949* 0.175 0.026 -0.230* 0.143 0.030 0.160 0.068
(2)MKTADJR 0.932* 1 0.184 0.058 -0.148 0.092 0.015 0.148 0.122
(3)TOBINQ 0.172 0.248* 1 0.594* -0.494* 0.368* -0.223* 0.294* 0.447*
(4)ROA 0.041 0.099 0.628* 1 -0.413* 0.241* -0.489* 0.562* 0.659*
(5)SIZE -0.201* -0.138 -0.471* -0.470* 1 -0.139 0.342* -0.554* -0.240*
(6)R&D 0.185 0.171 0.184 0.173 -0.180 1 -0.137 0.183 0.179
(7)LEV 0.037 -0.019 -0.311* -0.534* 0.288* -0.108 1 -0.422* -0.311*
(8)LIQ 0.096 0.110 0.366* 0.553* -0.509* 0.207* -0.397* 1 0.388*
(9)CFO 0.118 0.185 0.591* 0.637* -0.284* 0.204* -0.358* 0.403* 1
Note: Pearson (Spearman) correlation is upper (lower) diagonal. * indicates significance at 5% level.
[Table 4] Regression Results
(1) DV= RAWRET (2) DV=MKTADJR (3) DV=TOBINQ
Intercept 0.722 (2.22) 0.318 (1.01) 3.890 (6.34)
CSR 0.034 (2.55)* 0.041 (3.08)** 0.127 (4.92)**
ROA -0.654 (-1.00) -0.471 (-0.74) 6.01 (4.84)**
SIZE -0.048 (-2.61)** -0.029 (-1.63) -0.202 (-5.82)**
R&D 0.621 (1.38) 0.260 (0.60) 2.538 (2.98)**
LEV 0.023 (1.27) 0.018 (1.02) 0.050 (1.41)
LIQ 0.006 (0.18) 0.009 (0.29) -0.215 (-3.37)**
CFO 0.158 (0.43) 0.314 (0.89) 0.566 (0.82)
Industry control YES YES YES
ADJ-R2 0.106 0.081 0.561
N 110 110 110
*,** indicate significance level at 5% and 1%, respectively.
Table 3 provides preliminary evidence of this study before the main regression analysis. The distribution of CSR ratings and their descriptive statistics of selective variables are presented in this table. The market adjusted returns of “A“ group (A – AAA) are higher than those of groups below A on average. This means that firms with higher CSR performance (higher rating) experience higher stock market performance even after controlling for the benchmark (e.g., market performance). Tobin’s Q is
also associated with the CSR rating. The average Tobin’s of ”A“ group is much higher than that of groups ”B“s and
”CCC“. Because MSCI’s coverage is not broad with the Korean firms, its coverage includes relatively large firms on average. Therefore the size of firms is evenly distributed throughout the ratings.
Table 4 presents the results from main regression analysis. We run the regression with three different dependent variables and other control variables to test our
research question. Model (1) and (2) test the effect of CSR on the firm’s stock returns while Model (3) tests the effect of CSR on Tobin’s Q. The coefficients on CSR in Model (1) and (2) are positive and statistically significant, meaning that CSR ratings are positively associated with firms’ stock returns after controlling other firm characteristics. The coefficient on CSR in Model (3) is also positive and statistically significant. The magnitude of coefficient in Model (3) is different from those in Model (1) and (2) because the measures of dependent variables are different in scale. All regression models are controlled for industry membership, and the t-statistics are based on White (1980) standard errors. We interpret it as the findings in this study support our research question that CSR is positively related to firms’ financial performance.
5. Conclusion
A number of studies have tried to provide evidence on the relation between CSR and firm financial performance.
However, findings in prior studies are inconclusive, and the evidence in Korea is limited. This study investigates the relation between CSR and financial performance of Korean firms and provides direct evidence that CSR improves firms’ financial performance in the Korean capital market. The correlation and regression results suggest that firms with higher CSR ratings are associated with the contemporaneous stock returns adjusted by market performance and Tobin’s Q during the sample period. In particular, the regression results indicate that the firms with higher ratings perform 3.4%, on average, better than the firms with lower ratings in the Korean stock market. This is also consistent with the results with Tobin’s Q. The findings are robust even after controlling for other determinants of firm financial performance.
The current study contributes to the literature by extending research on CSR in Korea. Although a growing number of studies present evidence on CSR, this study provides first direct evidence on the relation between CSR and firms’ financial performance in Korea.
This study also provides some implications to investors and regulatory bodies. As the current study shows, investors are becoming more interested in firms’ CSR
activities and they indeed value these activities by firms.
The regulatory bodies should pay more attention to creating standardized formats of CSR reporting and requiring the assurance of such reporting. This will make the Korean firms transparent and make the Korean capital market more attractive to the global investors.
We, however, acknowledge that this study has limitations. Even though MSCI ESG provides a comprehensive report on CSR, our sample size is very small. There are many other avenues to test the validity of the CSR measures used in this study and other studies.
Future research may also include firm performance measures other than stock-market measures.
References
[1] Baird, P., Greylani, P., and Roberts, J. (2012). Corporate Social and Financial Performance Re-Examined:
Industry Effects in a Linear Mixed Model Analysis.
Journal of Business Ethics. 109 (3):367-388.
DOI: http://dx.doi.org/10.1007/s10551-011-1135-z [2] Cho, S., Lee, C., and Pfeiffer, R. (2013). Corporate
Social Responsibility Peformance and Information Asymmetry. Journal of Accounting and Public Policy.
32: 71-83.
DOI: http://dx.doi.org/10.1016/j.jaccpubpol.2012.10.005 [3] Clacher, I. and Hagendorff, J. (2012). Do
Announcements about Corporate Social Responsibility Create or Destroy Shareholder Wealth? Evidence from the UK. Journal of Business Ethics. 106; 253-266.
DOI: http://dx.doi.org/10.1007/s10551-011-1004-9 [4] Dhaliwal, D., Li, O., Tsang, A., and Yang, G. (2011).
Voluntary nonfinancial disclosure and the cost of equity capital: The initiation of corporate social responsibility reporting. The Accounting Review 86; 59-100.
DOI: http://dx.doi.org/10.2308/accr.00000005
[5] Dhaliwal, D., Radhakrishnan, S., Tsang, A., and Tang, Y. (2012). Nonfinancial disclosure and analyst forecast accuracy: International evidence on corporate social responsibility disclosure. The Accounting Review 87;
723-759.
DOI: http://dx.doi.org/10.2308/accr-10218
[6] Donaldson, T. and Preston, L. (1995). The Stakeholder Theory of the Corporation: Concepts, Evidence, and Implications. Academy of Management Review. 20;
65-91.
DOI: http://dx.doi.org/10.5465/AMR.1995.9503271992 [7] Fama, E. and French, K. (1992). The Cross-Section of
Expected Stock Returns. Journal of Finance. 47 (2);
427-465.
DOI: http://dx.doi.org/10.1111/j.1540-6261.1992.tb04398.x [8] Friedman, M. (1970). The Social Responsibility of
Business is to Increase its Profits. The New York Times. pp. 1.
[9] Lee, R. and Grewal, R. (2004). Strategic Responses to New Technologies and Their Impact of Firm Performance. Journal of Marketing. 68 (4); 157-171.
DOI: http://dx.doi.org/10.1509/jmkg.68.4.157.42730 [10] Menz, K. (2010). Corporate Social Responsibility: Is it
Rewarded by the Corporate Bond Market? A Critical Note. Journal of Business Ethics. 96; 117-134.
DOI: http://dx.doi.org/10.1007/s10551-010-0452-y [11] Merton, R. (1987). A Simple Model of Capital Market
Equilibrium with Incomplete Information. Journal of Finance. 42; 483-510.
DOI: http://dx.doi.org/10.1111/j.1540-6261.1987.tb04565.x [12] Orlitzky, M., Schmidt, F., and Rynes, S. (2003).
Corporate Social and Financial PErformance: A Meta-Analysis. Organization Studies. 24 (3); 403-441.
DOI: http://dx.doi.org/10.1177/0170840603024003910 [13] Park, C., Chen, Y., Wimble, M., Ro, Y., and
Strandholm, K. (2013). Corporate Social Responsibility and Systematic Risk. Working paper. University of Michigan-Dearborn.
DOI: http://dx.doi.org/10.1596/1813-9450-6353
[14] Taneja, S., Taneja, P., and Gupta, R. (2011).
Researches in Corporate Social Responsibility: A Review of Shifting Focus, Paradigms, and Methodologies. Journal of Business Ethics. 101;
343-364.
DOI: http://dx.doi.org/10.1007/s10551-010-0732-6 [15] Verrecchia, R. E. (2001). Essays on disclosure. Journal
of Accounting and Economics 32; 97-180.
DOI: http://dx.doi.org/10.1016/S0165-4101(01)00025-8 [16] Waddock, S. and Graves, S..(1997). The corporate
social performance–financial performance link.
Strategic Management Journal. 18; 303–319.
DOI: http://dx.doi.org/10.1002/(SICI)1097-0266(199704) 18:4<303::AID-SMJ869>3.3.CO;2-7
[17] White, H. (1980). A Heteroskedasticity Consistent Covariance Matrix Estimator and a Direct Test for Heteroskedasticity. Econometrica 48 (4); 817-838.
DOI: http://dx.doi.org/10.2307/1912934
[18] Xueming, L. and Bhattacharya, C. (2009). The Debate
over Doing Good: Corporate Social Performance, Strategic MArketing Levers, and Firm-Idiosyncratic Risk. Journal of Marketing. 70; 198-213.
[19] Zhang, R. and Rezaee, Z. (2009). Do Credible Firms Perform Better in Emerging Market? Evidence from China. Journal of Business Ethics. 90; 221-237.
DOI: http://dx.doi.org/10.1007/s10551-009-0038-8
Jinwook Kim
[Regular member]• Sep. 2013 ~ present : Assistant Professor of Accounting, Konkuk University
• July. 2012 ~ Aug. 2013 : Assistant Professor of Accounting, Rutgers, The State University of New Jersey, USA
• Jun. 2012 : University of Oregon PhD. in Accounting
• May. 2008 : Cornell University MPS in Statistics
• Jun. 2006 : The Ohio State University BSBA in Accounting
• August, 2005: Konkuk University BA in Business
<Research Interests>
Accounting for Bank and Insurance, Corporate Governance, Corporate Disclosure
Sunggon Chung
[Regular member]• Aug. 2009 ~ present : Assistant Professor of Accounting, Singapore Management University
• May. 2009 : Pennsylvania State University PhD. in Accounting
<Research Interests>
Capital Markets, Information Intermediaries
Cheongkyu Park
[Regular member]• Sep. 2011 ~ present : Assistant Professor of Accounting University of Michigan-Dearborn, USA
• Aug. 2011 : University of Kentucky PhD. in Accounting
<Research Interests>
Financial Reporting, Valuation, and CSR