Incidence and Mortality Rates of Disasters and Mass Casualty Incidents in Korea: A Population-Based Cross-Sectional Study, 2000-2009
The objective of study was to evaluate the incidence and mortality rates of disasters and mass casualty incidents (MCIs) over the past 10 yr in the administrative system of Korea administrative system and to examine their relationship with population characteristics.
This was a population-based cross-sectional study. We calculated the nationwide incidence, as well as the crude mortality and injury incidence rates, of disasters and MCIs.
The data were collected from the administrative database of the National Emergency Management Agency (NEMA) and from provincial fire departments from January 2000 to December 2009. A total of 47,169 events were collected from the NEMA administrative database. Of these events, 115 and 3,079 cases were defined as disasters and MCIs that occurred in Korea, respectively. The incidence of technical disasters/MCIs was
approximately 12.7 times greater than that of natural disasters/MCIs. Over the past 10 yr, the crude mortality rates for disasters and MCIs were 2.36 deaths per 100,000 persons and 6.78 deaths per 100,000 persons, respectively. The crude injury incidence rates for disasters and MCIs were 25.47 injuries per 100,000 persons and 152 injuries per 100,000 persons, respectively. The incidence and mortality of disasters/MCIs in Korea seem to be low compared to that of trend around the world.
Key Words: Disasters; Mass Casualty Incidents (MCIs); Epidemiology Soo Jin Kim,1,6 Chu Hyun Kim,2
Sang Do Shin,3 Seung Chul Lee,4 Ju Ok Park,5 and Joohon Sung1
1Department of Epidemiology, Graduate School of Public Health, Seoul National University, Seoul;
2Department of Emergency Medicine, Inje University, Seoul Paik Hospital, Seoul; 3Department of Emergency Medicine, Seoul National University Hospital, Seoul; 4Department of Emergency Medicine, DongGuk University Ilsan Hospital, Goyang; 5Seoul National University Hospital Biomedical Research Institute, Seoul; 6Department of Emergency Medical Service Management, Seoul Metropolitan Fire and Disaster Headquarters, Seoul, Korea
Received: 16 August 2012 Accepted: 27 February 2013 Address for Correspondence:
Chu Hyun Kim, MD
Department of Emergency Medicine, Inje University College of Medicine and Seoul Paik Hospital, 9 Mareunnae-ro, Jung-gu, Seoul 100-032, Korea
Tel: +82.2-2270-0119, Fax: +82.2-2270-0586 E-mail: [email protected]
This article was presented at the National Association of Emergency Medical Service Physician 2012 Annual meeting, Tucson, USA in 2012.
This study was financially supported by the Korea Centers for Disease Control and Prevention in 2009 (No.2009E00689001).
http://dx.doi.org/10.3346/jkms.2013.28.5.658 • J Korean Med Sci 2013; 28: 658-666 Occupation & Environmental Medicine
INTRODUCTION
Disasters can be defined as rapid or emerging incidents that re- quire excessive resources, or more resources than are available in a local area when natural or technical dangers are present (1- 4). The term mass casualty incident (MCI) refers to disasters that involve many people (5, 6). MCIs occur in many different contexts, including car crashes, chemical leaks, building col- lapses, fires, terrorism events, and mass gatherings (7, 8).
The frequency of disasters and MCIs is increasing, and ca- lamities always involve mass casualties because they are un- predictable. From 1994 to 2005, according to a UN report, the world witnessed over 67,000 deaths and 260 million people wounded each year due to disasters (9). An estimated loss of U$204 billion occurred due to natural disasters in the 1980s (10, 11). Disasters and MCIs consume local resources in the short
and long term, and therefore, appropriate preparation is re- quired to avoid high death and failure rates in such cases (7, 8).
Disaster and MCI-related research in Korea has mostly fo- cused on the establishment of a national disaster management system (12), the role of disaster management agencies (13), da- tabase (DB) building for disaster prevention (14), and descrip- tive studies on post-disaster stress management (15), post-trau- matic stress disorder (PTSD) (16), hospital disaster (17), inci- dents at mass gatherings and sporting events and building col- lapses (18, 19). According to statistics report over the 1990’s (1991-2000), natural disasters/MCIs such as storms and floods have caused an annual average of 122 people dead or missing, 17,219 refugees and property losses of over 580 billion won (KRW) (20). In the same period technical disasters/MCIs such as train derailments, plane crashes, bridge collapses, fires aboard liners, city gas explosions and building collapses cause tens to
hundreds of victims. In the 2000s, MCIs such as the Daegu sub- way fire and the 2007 MT Hebei Spirit oil spill raised issues of the physical health of local residents and volunteers (21).
However, it is difficult to compare and evaluate Korean cases with those from other parts of world because there is no research that presents an epidemiologic indicator for annual disaster- and MCI-related events; thus, we lack the basis for practical evaluation.
The aim of this study was to calculate the incidence, mortali- ty and overall rates of disasters and MCIs and to examine their relationship with population characteristics, using health-relat- ed indicators to facilitate future comparison of disasters and MCIs between domestic and foreign cases.
MATERIALS AND METHODS Study settings
South Korea covers an area of approximately 99,720 km2 and has a population of just over 48 million people. Korea, based on Act No. 7188 (March 11. 2004) the framework act on the man- agement of disaster and safety, adopts mixed model between civil defence model and emergency medical treatment priority system as disaster policy, in which administration security de- partment carries out a key role (22). Disaster management sys- tem of Korea consists of the central safety management com- mittee, headed by the prime minister and subcommittees head- ed by the ministers of various government ministries. The cen- tral safety management committee supervises and coordinates overall policy related to disaster and safety, and also promotes negotiations and coordination among the relevant ministries.
The subcommittees help ensure the seamless operation of the central committee, especially, the coordination committee un- der the Minister of Public Administration and Security, is in charge of the overall process of negotiations and coordination with regard to tasks delegated by the central committee. The National Emergency Management Agency (NEMA) provides emergency medical service (EMS) to Korea and plays a key role in the response to disasters and MCIs in most communities. A single-tiered fire-based EMS handles disasters and MCIs occur- ring throughout the entire Korean region and includes 16 re- gional headquarters of the fire department with a total of 1,400 advanced ambulances and 5,400 EMS providers. In addition, headed by the administrator of the NEMA, operates the central emergency rescue control team to supervise and control mat- ters related to emergency rescue, command, and control at the disaster site.
Study objectives
We aimed to calculate the incidence, mortality and overall rates of disasters and MCIs and to examine their relationship with po- pulation characteristics, using health-related indicators based on disaster/MCI database of NEMA to facilitate future compari-
son of disasters and MCIs between domestic and foreign cases.
Study design
This study was a population-based cross-sectional study based on NEMA administrative data from 2000 to 2009.
Definition of Disasters and MCIs
The Centre for Research on the Epidemiology of Disasters (CR- ED), which is an international epidemiological disaster research institution, has defined a disaster as a case in which more than 10 deaths are reported, more than 100 people are affected, a national emergency has been declared, or international assis- tance has been requested (10). The Centers for Disease Control (CDC) in the United States (US) has defined an MCI as a case in which more than 6 casualties have occurred (23). Thirty papers were reviewed by searching MEDLINE and the Cochrane li- brary prior to conducting expert interviews to create a defini- tion for both disasters and MCIs that would fit the situation of Korea. A number of the aforementioned survey papers and classroom presentations on various definitions of disasters and MCIs were introduced in further expert interviews with instruc- tors who had finished the National Disaster Life Support (NDLS) course, a disaster emergency medical expert training program.
The classic Delphi method was used to conduct the first survey via e-mail with experts who are instructors of the NDLS course, and the policy Delphi survey (24) was undertaken as a second- ary survey after presenting the results of the first survey to inter- view subjects so that they could collect ideas and suggestions.
On the basis of these discussions, a disaster has been defined for Korea as an incident that affects more than one municipal local governing district, involves the death of more than 10 peo- ple, or involves more than 50 casualties. An MCI has been de- fined as an incident that involves more than 6 casualties, regard- less of the affected area or number of deaths.
Data source
With regard to the credibility of the representative data, the study employed data for 2000 to 2009 taken from the NEMA adminis- trative database to analyze the major disaster and MCI types in Korea. This database includes all official records of disasters that have occurred in Korea Information from the Statistics Ko- rea website (http://kosis.kr/feature/feature_0102List.jsp?me- nuId = all&mode = listAll) was used to present other social sta- tistics, such as population and size of Korea. People who were killed or injured in Korean disasters or MCIs who were regis- tered in the NEMA administrative database for the period from 2000 to 2009 were selected as study subjects.
Data collections
We collected study data in two steps: First, we collected the
‘Daily Accidental Management Situation Report’, which in-
cludes daily incidents, and is sorted by severity. The ‘Daily Ac- cidental Management Situation Report’ can be downloaded from the home page of NEMA (www.nema.go.kr) and is pre- pared by the NEMA Disaster Status Control Center. Next, we collected and analyzed internal NEMA reports, referred to as
‘Accidental Status Reports’, which notify the relevant teams with- in NEMA (e.g., fire investigation, rescue and EMS) about major incidents (Appendix 1-4). These reports were made available for this study through the cooperation of NEMA. Using the Dai- ly Accidental Management Situation Reports, all NEMA disas- ter reports from the 16 Korean provinces were coded and en- tered into an electronic database. Using the Accidental Status Reports, more detailed information was coded and added to this database. Finally, the cases that met the defined category of disasters and MCIs for this study were extracted to establish the final dataset.
The final dataset for this study is the result of the reconstruct- ed database of reports from 16 regional fire department head- quarters within NEMA from January 2000 to December 2009.
The extracted variables were the dates of the disaster, the ad- dress, the disaster type, the number of casualties, the estimated financial loss, the mobilized manpower, the victims’ gender, age and major symptoms, the location of the fire (if the event was a fire), the type of collision (if the event was a car crash), and the number of mobilized ambulances (Table 1).
Statistical analysis
SAS version 9.1 was used as the statistical analysis tool. The pri- mary outcome was analyzed using a descriptive analysis to cal- culate the incidence, crude mortality rates and crude injury in- cidence rates of disasters and MCIs for each year, using central populations from the Ministry of Statistics. The secondary out- come was the assessment of the incidence trends of disasters/
MCIs by time-series and by type and calculation of the number of deaths and casualties by disaster/MCI type, the number of deaths and crude death rates by province, and the number of injuries and crude injury incidence rates by province.
RESULTS
We collected 43,169 events from the NEMA administrative da- tabase, covering the period from January 2000 to December 2009.
Of these, 115 and 3,079 were defined, respectively, as disasters and MCIs that occurred in Korea. There were 2,286 (72.3%) cas- es of disasters and MCIs in rural areas, which is approximately 2.6 times greater than the 879 (27.7%) cases that occurred in ur- ban areas. The incidence of technical disasters/MCIs was ap- proximately 12.7 times greater than that of natural disasters/
MCIs (2,960 cases vs 233 cases). With regard to both disasters and MCIs, transportation crashes were the most common cases.
In an analysis of the seasonal factors, both disasters and MCIs occurred more frequently in the summer (June-August) and the winter (November-February). With respect to the provincial factor, the Gyeonggi province showed the highest frequency of disasters (27 cases, 23.5%) and MCIs (606 cases, 19.7%), follow- ed by Seoul with 17 cases (14.8%) of disasters and 343 cases of MCIs (11.1%) and Gyeongnam with 5 cases (4.4%) of disasters and 269 cases of MCIs (8.7%) (Table 2).
From 2000 to 2009, both disasters and MCIs showed a tenden- cy to increase in number over time, but there is no significant time trend, although the frequency of incidents and the num- ber of casualties were directly proportional in MCIs (Fig. 1, 2).
As for natural factors, general floods were the most common type of disaster and MCI with 125 cases (61.0%), followed by flash floods with 47 cases (20.2%) and tropical cyclones with 24 cases (10.3%). The number and the frequency of injuries and deaths were on the same order. For disasters only, general floods were the most common type (17 cases, 68.4%), followed by tro- pical cyclones (4 cases, 15.4%) and flash floods (3 cases, 11.5%).
The number and frequency of injuries and deaths were on the same order. For MCIs, the number and frequency of occurrence and the number of injuries and deaths were the same as those of the total (Table 3).
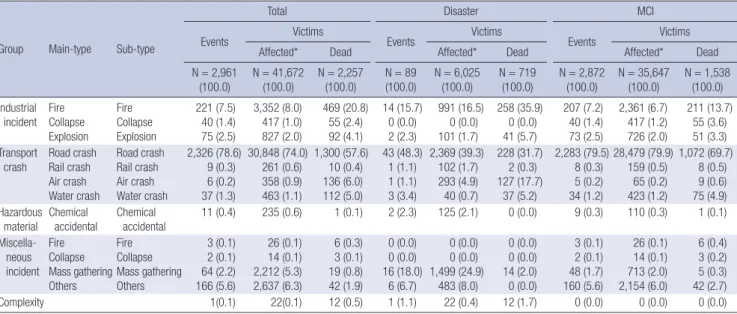
As for technical factors, road crashes were the most common type of disaster and MCI with 2,326 cases (78.6%), followed by fire with 221 cases (7.5%) and others incidents such as isola- tions of closed space, escalator incident, rippling incident, lei- sure place incident with 166 cases (5.6%). The number and the frequency of affected and deaths were on the different order for disaster and MCI. For affected victims of disaster only, road crashes were the most common type (2,369 persons, 48.3%), followed by mass gatherings (1,499 persons, 24.9%), fires (991 persons, 16.5%). For dead victims of disaster, fires were most common type (258 persons, 35.9%), followed by road crashes Table 1. Variables extracted from administrative reports
Group Extracted variables Incident occurrence related ∙ Disaster identification number
∙ Date/time of the incident
∙ Address of the incident
∙ Mechanism of the incident
∙ Cost of damage
∙ Mobilized manpower
∙ *Loss area
∙ *Location of incident Related casualties ∙ Number of deaths
- Death, missing
∙ Number of injured persons - Injury, severity, minority
∙ Transportation
∙ *Name, *age, *sex
∙ *Injury severity Medical resources used ∙ *Number of ambulances
∙ *Transportation to hospitals of casualties
∙ *Re-transportation status
*Extracted variables from disaster status reports.
(228 persons, 31.7%), air crashes (127 persons, 17.7%), explo- sions (41 persons, 5.7%), water crashes (37 persons, 5.2%). For affected victims of MCIs only, road crashes were most common type (28,479 persons, 79.9%), followed by fires (2,361 persons, 6.7%). For dead victims of MCIs only, road crashes were most common type (1,072 persons, 69.7%), followed by fire (211 per- sons, 13.7%), water crashes (75 persons, 4.9%), and collapse (55 persons, 3.6%), etc. For MCIs, the number and frequency of oc- currence and the number of injuries and deaths were the same as those of the total (Table 4).
The crude mortality rates for disasters and MCIs nationwide were 2.36 per 100,000 people and 6.78 per 100,000 people, re- spectively. The crude injury incidence rates per 100,000 people for disasters and MCIs nationwide were 25.47 and 152, respec-
tively (Table 5). For disasters by province, Ulsan showed the highest injury incidence rate (11.15 per 100,000), followed by Jeonnam (7.67) and Gangwon (7.09). For MCIs, the rate for Gang- won was 23.34 per 100,000 people, followed by Jeju (18.5) and Jeonnam (17.4).
DISCUSSION
Most research undertaken in the early and mid-20th century focused on the definition of disaster, epidemiologic studies and research methodology. Subsequent research by the World Heal- th Organization (WHO) and CRED was mostly focused on nat- ural disasters, such as earthquakes, floods, high winds, torna- dos, and heat waves, comparing the causes of disasters between countries and continents and measuring the economic losses, mortality, injuries and suffering incurred by these events (3, 4, 8, 25, 26).
Previous research carried out in the US, Britain, and Spain dealt only with natural disasters, MCIs, and major incidents (7, 27, 28). Spain showed a linear increase in the incidence of di- sasters over a 55-yr period (1950-2005), 82% of which were nat- ural and 18% technical (2). Most disasters showed a mixed pat- tern. For disaster types, flood was the most common (31.5%), Table 2. Demographic findings of disaster and MCI incidence in Korea: 2000-2009
[Unit : No. of events (%)]
Parameters No. (%) of patients
Total Disaster MCI
Total 3,194 (100.0) 115 (100.0) 3,079 (100.0) Nature Natural
Technical 234 (7.3)
2,960 (92.7) 27 (23.5)
88 (76.5) 207 (6.8) 2,872 (94.2) Type Geophysical
Meteorological Climatological Hydrological Biological Industrial incident Transport crash Hazardous material Miscellaneous Complexity
2 (0.1) 29 (0.9) 6 (0.2) 174 (5.5) 22 (0.7) 336 (10.5) 2,378 (74.5) 11 (0.3) 246 (7.7) 1 (0.1)
0 (0.0) 4 (3.5) 1 (0.9) 20 (17.4)
1 (0.9) 16 (13.9) 48 (41.7) 2 (1.7) 24 (20.9)
1 (0.9)
2 (0.1) 25 (0.8) 5 (0.2) 154 (5.0) 21 (0.7) 320 (10.4) 2,330 (75.7) 9 (0.3) 222 (7.2) 0 (0.0) U rbaniza-
tion Urban*
Rural Total
879 (27.7) 2,286 (72.3) 3,133 (100.0)
28 (25.5) 82 (75.5) 108 (100.0)
851 (27.9) 2,204 (72.1) 3,125 (100.0) P rovinces Seoul
Pusan Daegu Incheon Gwangju Daejeon Ulsan Gyunggi Gangwon Chungbuk Chungnam Jeonbuk Jeonnam Gyeonbuk Gyeonnam Jeju Unknown
360 (11.3) 187 (5.9)
59 (1.9) 119 (3.7) 33 (1.0) 47 (1.5) 74 (2.3) 633 (19.8) 247 (7.7) 139 (4.4) 193 (6.0) 164 (5.1) 302 (9.5) 260 (8.1) 274 (8.6) 74 (2.3) 29 (0.9)
17 (14.8) 3 (2.6) 3 (2.6) 2 (1.7) 0 (0.0) 1 (0.9) 2 (1.7) 27 (23.5) 11 (9.6)
2 (1.7) 4 (3.5) 13 (11.3)
8 (7.0) 10 (8.7) 5 (4.4) 2 (1.7) 13 (11.3)
343 (11.1) 184 (6.0)
56 (1.8) 117 (3.8) 33 (1.1) 46 (1.5) 72 (2.3) 606 (19.7) 236 (7.7) 137 (4.5) 189 (6.1) 151 (4.9) 294 (9.6) 250 (8.1) 269 (8.7) 72 (2.3) 24 (0.8) S easons Spring
Summer Autumn Winter Unknown
755 (23.6) 872 (27.3) 519 (16.3) 1,037 (32.5) 11 (0.3)
19 (16.5) 32 (27.8) 19 (16.5) 39 (33.9) 6 (5.2)
736 (23.9) 840 (27.3) 500 (16.2) 998 (32.4) 5 (0.2)
*Urban includes 7 provinces that is Seoul, Pusan, Daegu, Incheon, Gwangju, Daejeon, and Ulsan. Rural includes 9 provinces that is Gyunggi, Gang wan, Chungbuk, Chun- gnam, Jeonbuk, Jeonnam, Gyeongbuk, Gyeongnam, and Jeju. MCI, Mass Casualty Incident.
Fig. 1. The number of events and people affected by disasters from 2000 to 2009.
The incidence of disasters had no time-series trend characteristics, but the casual- ties were in proportion to the incidence of disasters.
Number of reported victims (in persons) Number of reported disasters
2000 2001 2002 2003 2004 2005 2006 2007 2008 2009 1,800
1,600 1,400 1,200 1,000 800 600 400 200 0
16 14 12 10 8 6 4 2 0 No. of event Affected person
Fig. 2. The number of events and people affected by mass casualty incidents (MCIs) from 2000 to 2009. The number of MCIs and casualties has increased from the early of 2000s to late of 2000s, but the incidence of MCIs had no time-series trend char- acteristics. Also, the casualties are proportional to the incidence of MCIs.
Number of reported victims (in persons) Number of reported MCI
2000 2001 2002 2003 2004 2005 2006 2007 2008 2009 7,000
6,000 5,000 4,000 3,000 2,000 1,000 0
600 500 400 300 200 100 0 No. of event Affected person
followed by air crashes (30.2%). With regard to the effects of technical disasters, transit crashes showed the highest death rates (71.6%). For transit crashes, land-based events were the most common (43.6%), followed by air (32.1%) and sea (24.4%), results that were significantly different from those of Korea. In Britain, major incidents documented in research papers over a 28-yr period were analyzed to calculate the incidence rate; the results indicated a rate of 3 to 4 incidents per year with a total of 108 incidents (range 0-10) (2, 8). There were 63 cases (59.2%) of public transportation crashes, 22 cases of civil disturbance (20.3%), and 16 cases of industrial incidents (14.8%). These results were similar to those for MCIs in our study.
In our study, disasters and MCIs were analyzed to calculate
the national and regional statistics for the incidence, crude mor- tality, crude injury, and characteristics of each disaster type us- ing the NEMA database, which includes all major incidents and accidentals, to increase the credibility and sensitivity of the study and decrease the selection bias. We reconstructed our database from NEMA reports to verify the special characteristics of disas- ters and MCIs in Korea.
Furthermore, in our study, both disasters and MCIs were an- alyzed to show the incidence frequency, the number of incidents for each incident type, and the number of injuries and deaths by time-series. In previous research, traffic crashes, residential fires and violence were reported as the leading causes of MCI (7). However, the leading causes for disasters in Korea were road
Table 3. Incidence of events and victims of natural disaster and MCI by type : 2000-2009 [Unit : No. (%)]
Group Main-type Sub-type
Total Disaster MCI
Events Victims
Events Victims
Events Victims
Affected* Dead Affected* Dead Affected* Dead
N = 233
(100.0) N = 5,378
(100.0) N = 582
(100.0) N = 26
(100.0) N = 2,556
(100.0) N = 412
(100.0) N = 207
(100.0) N = 2,822
(100.0) N = 170 (100.0) G eophysi-
cal Earthquake
Mass movement dry Tsunami
Landslide 1 (0.4)
1 (0.4) 6 (0.1)
11 (0.2) 3 (0.5)
4 (0.7) 0 (0.0)
0 (0.0) 0 (0.0)
0 (0.0) 0 (0.0)
0 (0.0) 1 (0.5)
1 (0.5) 6 (0.2)
11 (0.4) 3 (1.8) 4 (2.4) M eteoro-
logical
Storm Tropical cyclone
Local windstorm
24 (10.3) 5 (2.2)
521 (9.7) 61 (1.1)
40 (6.9) 4 (0.7)
4 (15.4) 0 (0.0)
264 (10.3) 0 (0.0)
26 (6.3) 0 (0.0)
20 (9.7) 5 (2.4)
257 (9.1) 61 (2.2)
14 (8.2) 4 (2.4) C limatolog-
ical Extreme temperature Wild fires
Heat wave Heavy snow Wild fires
1 (0.4) 3 (1.3) 2 (0.1)
13 (0.2) 370 (6.9) 37 (0.7)
0 (0.0) 0 (0.0) 2 (0.3)
0 (0.0) 1 (3.9) 0 (0.0)
0 (0.0) 326 (88.8)
0 (0.0)
0 (0.0) 0 (0.0) 0 (0.0)
1 (0.5) 2 (1.0) 2 (1.0)
13 (0.5) 44 (1.6) 37 (1.3)
0 (0.0) 0 (0.0) 2 (1.2) H ydrologi-
cal Flood
Mass movement wet
General flood Flash flood Storm surge Subsidence
125 (61.0) 47 (20.2) 1 (0.4) 1 (0.4)
3,343 (62.2) 601 (11.2) 14 (0.3)
8 (0.2)
430 (73.9) 81 (14.0) 9 (1.6) 8 (1.4)
17 (65.4) 3 (11.5) 0 (0.0) 0 (0.0)
1,793 (70.2) 114 (4.5)
0 (0.0) 0 (0.0)
366 (88.8) 20 (4.9)
0 (0.0) 0 (0.0)
108 (52.2) 44 (21.3) 1 (0.5) 1 (0.5)
1,550 (54.9) 487 (17.3) 14 (0.5)
8 (0.3)
64 (37.7) 61 (35.9) 9 (5.3) 8 (4.7) Biological Epidemic
Insect
B acterial infec- tious diseases Worms
13 (5.6) 9 (3.4)
253 (4.7) 140 (2.6)
1 (0.2) 0 (0.0)
1 (3.9) 0 (0.0)
59 (2.3) 0 (0.0)
0 (0.0) 0 (0.0)
12 (5.8) 9 (4.4)
194 (6.9) 140 (5.0)
1 (0.6) 0 (0.0)
*Affected victims include population who is injured, missed, displaced and dead. MCI, Mass casualty incident.
Table 4. Incidence of events and victims of technical disaster and MCI by type: 2000-2009 [Unit : No. (%)]
Group Main-type Sub-type
Total Disaster MCI
Events Victims
Events Victims
Events Victims
Affected* Dead Affected* Dead Affected* Dead
N = 2,961
(100.0) N = 41,672
(100.0) N = 2,257
(100.0) N = 89
(100.0) N = 6,025
(100.0) N = 719
(100.0) N = 2,872
(100.0) N = 35,647
(100.0) N = 1,538 (100.0) In dustrial
incident Fire Collapse Explosion
Fire Collapse Explosion
221 (7.5) 40 (1.4) 75 (2.5)
3,352 (8.0) 417 (1.0) 827 (2.0)
469 (20.8) 55 (2.4) 92 (4.1)
14 (15.7) 0 (0.0) 2 (2.3)
991 (16.5) 0 (0.0) 101 (1.7)
258 (35.9) 0 (0.0) 41 (5.7)
207 (7.2) 40 (1.4) 73 (2.5)
2,361 (6.7) 417 (1.2) 726 (2.0)
211 (13.7) 55 (3.6) 51 (3.3) Transport
crash
Road crash Rail crash Air crash Water crash
Road crash Rail crash Air crash Water crash
2,326 (78.6) 9 (0.3) 6 (0.2) 37 (1.3)
30,848 (74.0) 261 (0.6) 358 (0.9) 463 (1.1)
1,300 (57.6) 10 (0.4) 136 (6.0) 112 (5.0)
43 (48.3) 1 (1.1) 1 (1.1) 3 (3.4)
2,369 (39.3) 102 (1.7) 293 (4.9) 40 (0.7)
228 (31.7) 2 (0.3) 127 (17.7)
37 (5.2)
2,283 (79.5) 8 (0.3) 5 (0.2) 34 (1.2)
28,479 (79.9) 159 (0.5)
65 (0.2) 423 (1.2)
1,072 (69.7) 8 (0.5) 9 (0.6) 75 (4.9) Hazardous
material Chemical
accidental C hemical
accidental 11 (0.4) 235 (0.6) 1 (0.1) 2 (2.3) 125 (2.1) 0 (0.0) 9 (0.3) 110 (0.3) 1 (0.1) M iscella-
neous incident
Fire Collapse Mass gathering Others
Fire Collapse M ass gathering Others
3 (0.1) 2 (0.1) 64 (2.2) 166 (5.6)
26 (0.1) 14 (0.1) 2,212 (5.3) 2,637 (6.3)
6 (0.3) 3 (0.1) 19 (0.8) 42 (1.9)
0 (0.0) 0 (0.0) 16 (18.0)
6 (6.7)
0 (0.0) 0 (0.0) 1,499 (24.9)
483 (8.0)
0 (0.0) 0 (0.0) 14 (2.0) 0 (0.0)
3 (0.1) 2 (0.1) 48 (1.7) 160 (5.6)
26 (0.1) 14 (0.1) 713 (2.0) 2,154 (6.0)
6 (0.4) 3 (0.2) 5 (0.3) 42 (2.7)
Complexity 1(0.1) 22(0.1) 12 (0.5) 1 (1.1) 22 (0.4) 12 (1.7) 0 (0.0) 0 (0.0) 0 (0.0)
*Affected victims include population who is injured, missed, displaced and dead. MCI, Mass casualty incident.
crashes, general floods, incidents at mass gatherings, and fires.
The leading causes for MCIs were road crashes, fires, and gen- eral floods.
NEMA has two separate lines of work, fire-based tasks and mitigation-based tasks, and it focuses only on prevention, rapid response and mitigation to minimize disaster damage with a minimum expenditure of resources. Thus, there is no efficient connection and cooperation with the Ministry of Health and Welfare, which handles the public health sector. A disaster ma- nagement plan for public health is warranted to properly ana- lyze and present the characteristics of disasters/MCIs, thus en- abling preparations for each region, mitigating damages, and monitoring trends in disasters/MCIs. NEMA and the Ministry of Health and Welfare need to establish a system for coopera- tion on disaster management and epidemiologic investigation of the disasters/MCIs using a predetermined standard.
In this regard, this study may have significant value if it is used to compare domestic cases with those in foreign coun- tries. Furthermore, a set of standards needs to be established for epidemiologic research on disasters/MCIs, along with a web-based registry system to maintain and update research re- sults and a monitoring system for measuring the impact of di- sasters/MCIs.
There are certain limitations to this study due to the nature of the information available in the administrative database.
First, the NEMA administrative data were not fully comput- erized, and they may not contain sufficiently meaningful vari- ables for an epidemiologic survey. Therefore, many of the vari- ables that could have been used in the discussion of disasters
Table 5. Deaths, injuries and mortality rates of disaster and MCI by locality: Nationwide in South Korea, 2000-2009
Locality
Population*
(unit:1,000 persons)
Population Density*
(unit: persons/
km2)
Area*
(unit: km2)
No. of injuries
(unit: persons) Injury incidence rates
(unit:100,000 persons) No. of deaths
(unit: persons) Crude mortality rates
(unit:100,000 persons) No. of affected (unit: persons)
Disaster MCI Disaster MCI Disaster MCI Disaster MCI Disaster MCI
Seoul 10,057 16,614 605 1,266 3,959 1.84 3.95 14 104 0.02 0.10 1,280 4,063
Pusan 3,602 4,722 763 68 2,145 0.88 6.01 24 79 0 0.21 92 2,224
Daegu 2,487 2,810 885 306 668 6.05 2.68 201 29 3.98 0.12 507 697
Incheon 2,584 2,596 996 110 1,417 2.13 5.43 1 28 0.02 0.10 111 1,445
Gwangju 1,416 2,824 501 0 376 0 2.61 0 13 0 0.09 0 389
Daejeon 1,452 2,689 540 59 591 4.06 4.02 0 13 0 0.07 59 604
Ulsan 1,063 1,005 1,057 236 951 11.15 8.90 0 27 0 0.18 236 978
Gyunggi 10,297 1,016 10,136 1,992 7,413 2.06 7.02 107 289 0.10 0.28 2,099 7,702
Gangwon 1,484 89 16,593 635 3,471 7.09 23.34 29 170 0.19 1.08 664 3,641
Chungbuk 1,488 200 7,433 77 1,662 2.59 11.17 14 53 0.47 0.36 91 1,715
Chungnam 1,915 223 8,608 219 2,311 3.79 12.05 15 189 0.27 0.97 234 2,500
Jeonbuk 1,826 227 8,056 750 1,760 5.84 9.60 75 107 0.56 0.58 825 1,867
Jeonnam 1,899 157 12,110 697 3,237 7.67 17.40 35 150 0.14 0.77 732 3,387
Gyeongbuk 2,690 142 19,027 683 2,728 4.22 10.24 81 179 0.49 0.59 764 2,907
Gyeongnam 3,087 294 10,524 343 2,819 2.77 9.09 146 173 1.38 0.51 489 2,992
Jeju 535 290 1,848 4 1,001 0.37 18.50 26 56 0 0.78 30 1,057
Unknown† 0 0 0 5 252 0 0 363 49 0 0 368 301
Total 47,878 481 99,679 7,450 36,761 25.47 152.0 1,131 1,708 2.36 6.78 85,81 38,469
*Population, population density and area were based on the information from the statistics Korea website (http://kosis.kr/feature/feature_0102List.jsp?menuId = all&mode = listAll, [accessed 15 April 2012]). †Unknown data of locality event occurred boarder lines of each province.
and MCIs were not included in the study, and only some of the extracted variables were used to calculate the indicators for epi- demiologic assessment using a descriptive method.
Second, even though this study was a retrospective observa- tional study, the environmental exposure at the time of each in- cident could not be found due to the characteristics of the ad- ministrative data. The cause-effect relationship between disas- ters/MCIs and exposure of the disasters/MCIs related environ- ment to risks could not be determined, and thus, this result could not be analyzed. Third, some of the administrative data were duplicated or may have been overlooked because when the in- cident occurred on the boundary of two provinces, such data were excluded from the study. Fourth, the data source used in this study was the administrative data prepared for immediate incident reports, and these data may not be suitable for moni- toring or for the establishment of a long-term database. Finally, administrative data from all provinces were used in our analy- sis, but the number of incidents and casualties may have been underestimated. In addition, the data reported to NEMA for early and mid-2000 did not contain data on MCIs and biologi- cal disasters such as severe acute respiratory syndrome (SARS) and avian influenza, which may have contributed to an under- estimation of the number of incidents.
In conclusion, from January 2000 to December 2009, 115 di- sasters and 3,079 MCIs occurred in Korea. Technical disasters/
MCIs occurred more frequently than natural disasters/MCIs.
There was no significant trend in the time-series regarding the numbers of disasters and MCIs. With regard to the type of di- saster, the most common types were road crashes, general
floods, and mass gathering incidents. For MCIs, the most com- mon types were road crashes, fires, and general floods. Floods and transportation crashes were the main causes of natural and technical disasters/MCIs, respectively. The crude death rates per 100,000 people for disasters and MCIs were 2.36 and 6.78, respectively. The crude injury incidence rates per 100,000 peo- ple for disasters and MCIs were 35.47 and 152, respectively.
We established a nation-wide administrative EMS-reported disaster and MCI database that includes 10 yr of data. The inci- dence and mortality of disasters/MCIs in Korea seem to be lower compared to that of trend around the world. These data can be used to determine the optimal response plan for disas- ter and MCIs in Korea. Further study will be needed for disaster and MCI data base computerization to monitor incidents and to establish preparedness and early warning systems.
ACKNOWLEDGMENTS
We are grateful to the National Emergency Management Agency for their cooperation in providing the data. Any opinions, fin- dings, conclusions, and recommendations are those of the au- thors and do not represent the official views of NEMA in Korea.
DISCLOSURE
The authors have no conflicts of interest to disclose.
REFERENCES
1. Smith E, Wasiak J, Sen A, Archer F, Burkle FM Jr. Three decades of disas- ters: a review of disaster-specific literature from 1977-2009. Prehosp Di- saster Med 2009; 24: 306-11.
2. Arcos González P, Pérez-Berrocal Alonso J, Castro Delgado R, Cada- vieco González B. Trends in disasters in Spain and their impact on pub- lic health: 1950-2005. Public Health 2007; 121: 375-7.
3. Twum-Danso NY. Disaster epidemiology: prudent public health practice in the Pacific Islands. Pac Health Dialog 2002; 9: 58-63.
4. Dominici F, Levy JI, Louis TA. Methodological challenges and contribu- tions in disaster epidemiology. Epidemiol Rev 2005; 27: 9-12.
5. De Boer J. Definition and classification of disasters: introduction of a di- saster severity scale. J Emerg Med 1990; 8: 591-5.
6. Rutherford WH, de Boer J. The definition and classification of disasters.
Injury 1983; 15: 10-2.
7. Kuisma M, Hiltunen T, Määttä T, Puolakka J, Boyd J, Nousila-Wiik M, Hakala T. Analysis of multiple casualty incidents - a prospective cohort study. Acta Anaesthesiol Scand 2005; 49: 1527-33.
8. Carley S, Mackway-Jones K, Donnan S. Major incidents in Britain over the past 28 years: the case for the centralised reporting of major incidents.
J Epidemiol Community Health 1998; 52: 392-8.
9. Societies IFotRCatRC. World disaster report: International Federation of the Red Cross and the Red Crescent Societies: 2001~2004. Available at http://www.ifrc.org/en/publications-and-reports/world-disasters-re- port [accessed on 7 January 2013].
10. Centre for Research on the Epidemiology of Disasters. Annual statisti- cal review: numbers and trends 2010 CRED: Brussels 2011. Available at http: //www.cred.be/publications [accessed on 4 January 2011].
11. De Boer J. Order in chaos: modelling medical management in disasters.
Eur J Emerg Med 1999; 6: 141-8.
12. Park CS. An information fusion-based disaster information system frame- work. J Korean Soc Disaster Inf 2009; 5: 40-8.
13. Choi NY, Chae WH. Building the governance system for the effective di- saster management of local government: focusing Buchon City. Korean Policy Sci Rev 2008; 12: 227-54.
14. Lee CY, Kim TH, Cha SY. A study of the extraction algorithm of the disas- ter sign data from web. J Korean Soc Disaster Inf 2011; 7: 139-49.
15. Kim KH, Kwon SJ. Posttraumatic stress responses of Taean residents: fo- cused on a regional comparison at two and eight months after the disas- ter. ECO 2009; 13: 89-125.
16. Han JE, Jung SD, Kim GE. Crisis intervention models: a comparison of six models for improving mental health of disaster victims. Korean Rev Crisis Emerg Manage 2011; 7: 49-70.
17. Back MH, Kim HJ. Analysis of hospital disaster in South Korea from 1990 to 2008. Yonsei Med J 2010; 51: 965-70.
18. Wang SJ, Byun HJ. A survey of Human Injury and Crowd Packing in Mass Gathering. J Korean Soc Disaster Inf 2011; 7: 12-20.
19. You KC, Ahn ME, Cho YJ, Chaeng JM, Lim KS. Insjury type in Sampung collapse. J Korean Soc Emerg Med 1997; 8: 185-92.
20. National Emergency Management Agency. An annual report of Disas- ter, 1985-2000. 2001. Available at http://www.nema.go.kr/nema_cms_
iba/show_nema/board/board9s/list.jsp?tab_no=2&c_relation=39&check_
the_num=142&check_the_code=5&check_up_num=165 [accessed on 4 January 2010].
21. Jung JH, Kim M, Yim UH, Ha SY, An JG, Won JH, Han GM, Kim NS, Ad- dison RF, Shim WJ. Biomarker responses in pelagic and benthic fish over 1 year following the Hebei Spirit oil spill (Taean, Korea). Mar Pollut Bull 2011; 62: 1859-66.
22. Statutes of the republic of Korea. Framework act on the management of disaster and safety. 2004. Available at http://elaw.klri.re.kr/kor_ ervice/
lawTotalSearch.do [accessed on 11 December 2012].
23. Centers for Disease Control and Prevention. Emergency preparedness and response. Available at http://emergency.cdc.gov/masscasualties/re- search [accessed on 7 November 2011].
24. Rayens MK, Hahn EJ. Building consensus using the policy delphi meth- od. Policy Polit Nurs Pract 2000; 1: 308-15.
25. Seaman J. Disaster epidemiology: or why most international disaster re- lief is ineffective. Injury 1990; 21: 5-8.
26. Task Force on Quality Control of Disaster Management; World Associa- tion for Disaster and Emergency Medicine; Nordic Society for Disaster Medicine. Health disaster management: guidelines for evaluation and research in the Utstein Style: volume I. conceptual framework of disas- ters. Prehosp Disaster Med 2003; 17: 1-177.
27. Thacker MT, Lee R, Sabogal RI, Henderson A. Overview of deaths asso- ciated with natural events, United States, 1979-2004. Disasters 2008; 32:
303-15.
28. French J, Ing R, Von Allmen S, Wood R. Mortality from flash floods: a review of national weather service reports, 1969-81. Public Health Rep 1983; 98: 584-8.
Appendix 1. Incident report criteria of NEMA* (Article 3 in Fire Basic Act No.11690) 1. Fire which belongs to one of the following criteria
A. Fire with more than 5 deaths or 10 casualties B. Fire with more than 100 people affected
C. Fire with financial loss of more than 2 billion won (KRW)
D. Fire at government buildings, schools, rice-polishing mill, cultural assets, subways, or underground tunnel
E. Fire at tourist hotel, building with more than 11 stories, underground shopping street, market, department store, manufacturer/storage/station of dangerous materials which are more than 3,000 times of standard, accommodations with more than 5 stories or 30 guest rooms, hospital with more than 5 stories or 30 patient rooms, mental institution, oriental-medicine hospital, nursing home, plant with area of more than 15,000 m2, and fire in Fire Alert Area according to Article 4-1
F. Fire at train, ship heavier than 1,000 tons, aircraft, power plant, or power transforming station G. Fire by explosion of gas or gunpowder
H. Fire at publicly used establishments
2. Disaster where incident management is required by controller according to the relevant law 3. Disaster broadcasted by media
4. Disaster which is otherwise selected by administrator of NEMA (Amended on February 1, 2007)
*NEMA, National Emergency Management Agency.
Appendix 2. NEMA* directive for fire investigation and incident report (No.229)
Article 45 (Emergency Incident Report) Fire Chief or Fire Commissioner shall report to the administrator of NEMA for the following incidents during investigation. (Attachment deleted on December 27, 2006)
1. Large-scale fire
A. Human damage: fire with more than 5 deaths or 10 casualties
B. Property damage: fire with estimated financial loss more than 5 billion won (KRW) (Revised on July 7, 2009) 2. Major fire
A. Fire at public buildings and facilities such as government buildings, schools, rice-polishing mill, cultural assets, subways, or underground tunnel
B. Fire at tourist hotel, high-rise building, underground shopping street, market, department store, manufacturer/storage/station of dangerous materials, fire-vulnerable subjects, and fire in Fire Alert Area
C. Fire with more than 100 people affected 3. Special fires
A. Fire at train, ship stationed at seaport, aircraft, power plant, or power transforming station B. Special incident, fire with special cause (e.g. arson)
C. Fire at foreign embassy and residence
D. Fire at a special location which public attention is expected
*NEMA, National Emergency Management Agency.
Appendix 3. Immediate incident report criteria of some provinces A. Fire/disaster with fire
∙ Deaths of more than 1 person ∙ Financial loss of more than 100 million won (KRW) B. Fire at bazaar market
C. General fire
∙ Deaths of more than 3 people ∙ Financial loss of more than 500 million won (KRW) D. Fire at publicly used establishments such as study residence or Karaoke room ∙ Deaths of more than 2 people or 3 casualties
E. Emergency incidents such as large-scale collisions and building collapse where rapid rescue & EMS service are required ∙ Deaths of more than 3 people or 5 casualties
F. Incident with massive people affected ∙ More than 50 people affected G. Incident with multiple EMS service ∙ Casualties more than 10 people
H. Fires and incidents involving other important national establishments or special fire which may draw public attention and broadcasting by media is expected *2 seriously wounded people can be considered as 1 death and used to decide whether to report
Appendix 4. Incident report criteria of NEMA* dispatch center A. Incident report criteria for the administrator of NEMA*
A. Human damage or damage is expected
- Incident with more than 3 deaths or 10 casualties
- Incident with 50 affected people and more # Incident which requires rescue operation/EMS service B. Fires
- Vulnerable subjects: large-scale fire at bazaar market or other places - Publicly used establishments: 2 deaths or more / 3 casualties or more
∙ General fire
- 3 deaths or more (2 casualties = 1 death)
- Financial loss of more than 200 million won (KRW) / when the second damage is expected C. Security accidental: explosion, collapse, large-scale car crashes
- Damage at major establishments, theater, auditorium
- When rapid rescue/EMS are required # 3 deaths or more / 5 casualties or more D. Earthquake (tsunami)
- Over 3.0 (inland)/over 3.5 (coast) - When warning or alert for tsunami is issued E. Mountain fire, others
- In case of mountain fire: when fire spread is expected / When residential or human damage are expected - Opening of water gate at dam near border, mountain fires, etc.
F. Fires and incidents involving other important national establishments or special fire which may draw public attention and broadcasting by media is expected
* NEMA, National Emergency Management Agency.
B. Incident report criteria for the minister of MOPAS*
A. Human damage: 5 deaths or more / major disasters B. Fires
- 5 deaths or more / 20 casualties or more
- Major national establishments / underground shopping street and other special fire - Mountain fire more than 30 ha
C. Rescue/EMS: 5 deaths or more / 20 casualties or more D. Others
- Massive explosion accidental including gas / collapse / special incident - Any accidental to which public attention is expected
* MOPAS, Ministry of Public Administration and Security.