The Effects of Alcohol on Visual Evoked Potential and Multifocal Electroretinography
The aim of this study was to investigate the acute effects of ethanol administration on pattern-reversal visual evoked potential (VEP) and multifocal electroretinography (mfERG).
Fifteen healthy subjects with no ocular or general disease were recruited. VEP (0.25°
pattern sizes) and mfERG with 19 elements in two recording segments were performed before ethanol administration to obtain baseline for each participant. A few days later, the participants visited again for VEP and mfERG measurements after ethanol administration.
Ethanol (0.75 g/kg) was administered orally over the course of 30 minutes. VEP and blood alcohol concentration were evaluated one hour after ethanol administration, and mfERG was conducted after pupil dilation. The Wilcoxon signed-rank test was used to compare parameter changes after randomized eye selection. The mean blood alcohol concentration was 0.034% ± 0.05% by volume. VEP revealed a P100 latency delay (109.4 ± 5.3;
113.1 ± 8.2; P = 0.008) after alcohol administration. The P1 implicit time of ring 1 on mfERG showed a trend of shortening after alcohol administration (37.9 ± 1.0; 37.2 ± 1.5;
P = 0.048). However, the changes did not show statistical significance after Bonferroni correction. In conclusion, orally administrated ethanol (0.75 g/kg) appears to suppress the central nervous system, but it is not clear whether alcohol intake affects the retina.
Keywords: Alcohol; Electroretinography; Visual Evoked Potential Jee Taek Kim,1 Cheol Min Yun,2
Seong-Woo Kim,2 Jaeryung Oh,2 and Kuhl Huh2
1Department of Ophthalmology, Chung-Ang University College of Medicine, Seoul, Korea;
2Department of Ophthalmology, Korea University College of Medicine, Seoul, Korea
Received: 12 May 2015 Accepted: 27 January 2016 Address for Correspondence:
Seong-Woo Kim, MD
Department of Ophthalmology, Korea University Ansan Hospital, 123 Jeokgeum-ro, Danwon-gu, Ansan 15355, Korea E-mail: ksw64723@korea.ac.kr
Funding: This Research was supported by the Chung-Ang University Research Grants in 2015.
http://dx.doi.org/10.3346/jkms.2016.31.5.783 • J Korean Med Sci 2016; 31: 783-789
INTRODUCTION
Alcohol (ethanol) is one of the oldest and most sought after substances in human history. Alcohol is used for various pur- poses including medical uses, such as in analgesics, antiseptics, and disinfectants; it also can serve as a relationship buffer in social situations, and as a relaxant to reduce stress and decrease tension. Chemically, alcohol is a single compound, ethyl alco- hol, which functions as a central nervous system (CNS) depres- sant or a psycho-stimulant, depending on the amount of alco- hol consumed (1,2). Acute intake of high doses of alcohol has a depressive effect on the CNS and a conduction delay effect on both central and peripheral nerves that is mediated by gamma aminobutyric acid A (GABA) receptors, glycine receptors and the adenosine system (1-5). Low doses of alcohol have a stimu- lant effect on the CNS via the dopamine pathway (6).
Visual evoked potential (VEP) and electroretinography (ERG) are clinically versatile electro-physiologic measurement tech- niques. VEP measures the response to visual stimulation that begins at the retina and ends at the visual cortex, whereas ERG reflects the gross retinal condition (7,8). Multifocal ERG (mfERG) provides an indication of cone photoreceptor-derived central retinal function under light-adapted conditions (8,9).
The acute effects of alcohol on the visual system have previous- ly been evaluated with VEP and ERG (3,10-14). However, our
study is the first to use multifocal electroretinography (mfERG) to determine the acute effects of ethanol on the retina. More- over, because previous studies using VEP were performed de- cades ago (3,10,13), their measurements of pattern-reversal VEP (VEP) were different from those that are currently recom- mended by the International Society for Clinical Electrophysi- ology of Vision (ISCEV) standards (7).
In the present study, we aimed to investigate the acute effects of ethanol administration on the retina and visual pathways us- ing mfERG and ISCEV standard VEP (standard protocol except using only one check size).
MATERIALS AND METHODS Subjects
This prospective study was performed in young, healthy adults older than 25 years between August 10, 2013 and September 11, 2013 at Korea University Ansan Hospital. Fifteen healthy subjects without any ocular or systemic disease were included in the study. Exclusion criteria included prior ocular surgery, ocular disease including cataracts or glaucoma, best corrected visual acuity (BCVA) less than 1.0 (decimal), past medical his- tory of diabetes and hypertension, alcohol-associated liver dis- ease including fatty liver or liver cirrhosis, recent hepatitis (within a few years), hepatitis B or C carrier status, and alcohol- Ophthalmology
dependent psychotic disorders. After VEP and mfERG were performed on both eyes, one eye from each participant was randomly selected for assessment by a random number gener- ator.
During their first visit, all subjects underwent a comprehen- sive ocular examination, which included BCVA, intraocular pressure measurement with a pneumatic tonometer (CT-80A, Topcon, Tokyo, Japan), manifest refraction using the Auto Kera- to-Refractometer (KR-8100, Topcon), keratometry, anterior chamber depth and axial length measurement with a biometer (IOL MASTER 500, Carl Zeiss Meditec Inc., Jena, Germany), and central retinal thickness measurement with a combination imaging system (OPKO Spectral SLO/OCT, Ophthalmic Tech- nologies Inc., Miami, FL, USA). VEP was recorded before pupil dilation, whereas mfERG was recorded after pupil dilation. Di- lated pupil size was measured with the KR-1W wavefront ana- lyzer (Topcon).
During the second visit, subjects were given an alcoholic drink (Soju, 19.5 vol% ethanol; a popular traditional Korean drink) with a meal. The drinks were offered in a measured quantity (0.75 g/kg of body weight) over the course of 30 min- utes. VEP was recorded one hour after alcohol consumption, followed by blood sampling. mfERG was recorded after pupil dilation. Blood samples (3 mL) were drawn from the antecubi- tal vein into an EDTA tube for the detection of ethanol. To pre- vent any alcohol contamination in the blood sample via the disinfection procedure, skin was disinfected using povidone- iodine instead of alcohol wipes. Serum was isolated from the blood samples after centrifugation at 3000 rpm for five minutes.
Next, the blood alcohol concentration (BAC) of each sample was determined using a Modular Analytics P analyzer (Roche, Berlin, Germany) and an accompanying diagnostic kit (Ethyl Alcohol; Roche).
Pattern reversal VEP recording
Pattern reversal VEP (VEP) recordings were performed with a Roland-Consult RetiScan® system (Roland-Consult, Branden- burg an der Havel, Germany) according to ISCEV standards (7).
Monocular VEPs were recorded with gold-disc surface elec- trodes. Active electrodes were placed on the scalp over the visu- al cortex at Oz (mid-occipital position) with the reference elec- trode at Fz (mid-frontal position). The ground electrode was placed on the forehead. Refraction was corrected with trial lenses before the recordings. Each subject sat in a moderately lit room, 1 meter in front of a 21-inch CRT monitor. The luminance was < 1 cd/m2 for the black checks and 115 cd/m2 for the white checks (contrast: 99%). The responses to 0.25° check were re- corded. The background light was dimmed (approximately 20 cd/m2). The reversal rate was one per second, and responses to 100 stimuli were averaged. Subjects were instructed to fixate on a red marker at the center of the screen. The recording was
monitored in real-time under the supervision of a retinal spe- cialist. If the cooperation of the subject or fixation stability was poor, the VEP recording was repeated after 5 minutes break. If the recorded signal was suboptimal, the VEP recording was re- peated until a satisfactory recording was achieved.
Multifocal ERG recording
The Roland-Consult RetiSCAN System was also used for mfERG. The mfERGs were recorded as described in the ISCEV standard protocol for clinical mfERG, with the exception of the number of stimulus hexagons (19) that were used (8). The par- ticipants remained in dim light for at least 15 minutes before the recordings were taken, and pre-test light exposure was avoided. Briefly, pupils were fully dilated with 1% tropicamide and 2.5% phenylephrine, and pupil size was measured. A Buri- an-Allen contact lens electrode was used as the active elec- trode. Moderate myopia was fully corrected with glasses for op- timal acuity at the viewing distance of 33 cm. Monocular stimu- lation and monocular recording were performed with the con- tralateral eye occluded.
The stimulus matrix, which consisted of 19 scaled hexagonal elements (three successive rings from center to periphery), was presented on a high-resolution 21-inch CRT monitor at a frame rate of 75 Hz. The stimulus hexagons were set to modulate be- tween white and black according to a pseudorandom m-se- quence (13.3 milli-seconds per frame). The Michelson contrast between white and black hexagons was set to 99%, i.e. the lumi- nance was < 1 cd/m2 for the black hexagons and 115 cd/m2 for the white hexagons. The surrounding background light was dimmed, and a red fixation cross was used. The monitor sub- tended 38° horizontally and 31° vertically at a viewing distance of 25 cm. The recording was divided into two segments and monitored in real-time under the supervision of a retinal spe- cialist throughout the entire testing period. If the recorded sig- nal was not appropriate or fixation losses were detected, the re- cording was repeated.
Data analysis
For the VEP, the latency and amplitude of N75, P100, and N135 were measured. For mfERG, the P1 (first positive component) and N1 (first negative component) amplitudes of rings 1, 2, and 3 were measured. The P1 and N1 implicit times of rings 1, 2, and 3 were also measured. Statistical analyses were performed with SPSS software, version 20.0 (IBM, Inc., Armonk, NY, USA).
The Wilcoxon signed-rank test (n = 15 eyes) was used to com- pare the changes in VEP and mfERG after randomized eye se- lection. Spearman correlation analysis was used to evaluate the correlations between BAC and the changes in VEP and mfERG (delta ratio; 1- [parameter after alcohol administration] / [pa- rameter before alcohol administration]. P values of < 0.05 were considered statistically significant.
Table 1. Clinical characteristics of participants in this study
Demographic data Mean ± SD
Age, yr 31.3 ± 9.1
Body weight, kg 74.3 ± 12.8
Keratometer 1 41.5 ± 5.5
Keratometer 2 43.0 ± 5.9
Anterior chamber depth, mm 3.7 ± 0.5
Spherical equivalent, diopter -3.7 ± 6.0
IOP, mmHg 12.4 ± 5.5
Axial length, mm 25.8 ± 3.2
Pupil diameter, mm 8.14 ± 1.04
Central retinal thickness, µm 221.9 ± 52.3 Blood alcohol concentration, vol% 0.034 ± 0.05 IOP, intraocular pressure; vol%, percentage by volume.
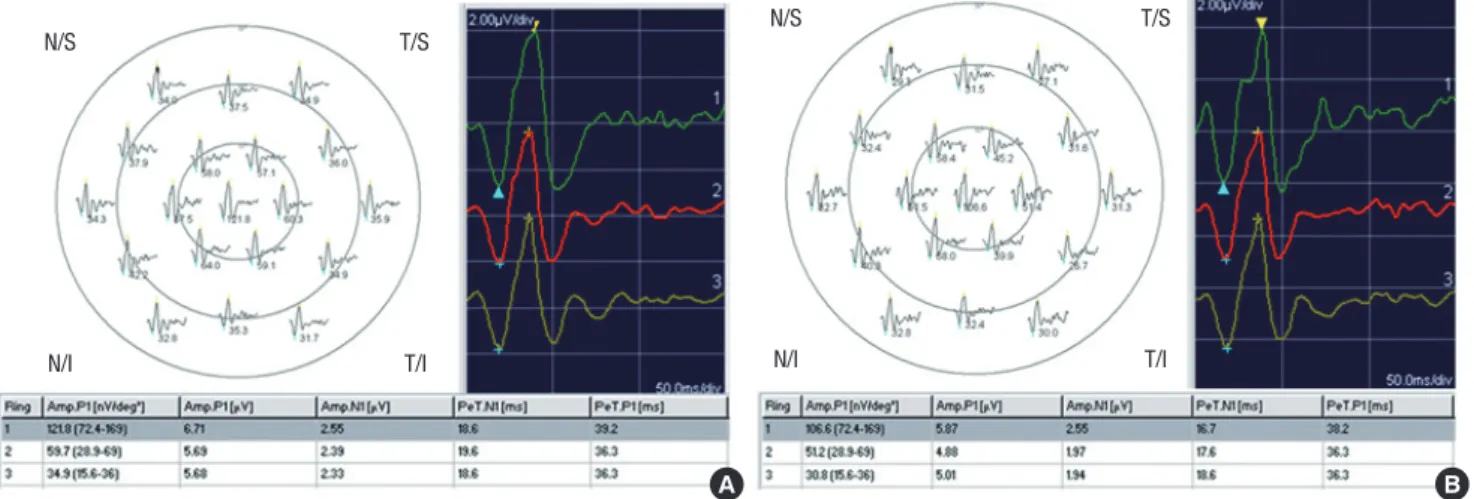
Fig. 1. Representative mfERG recordings before (A) and after (B) alcohol administration. mfERG first-order kernel trace array with 19 elements (left upper row), ring traces from ring 1 to ring 3 (right upper row), P1 and N1 amplitude (Amp.P1 and Amp. N1), and P1 and N1 implicit times (PeT.P1 and PeT.N1) (lower row).
A B
T/S T/S
N/S N/S
N/I T/I N/I T/I
Table 2. Pattern reversal visual evoked potential and multifocal electroretinogram parameters before and after alcohol administration
Parameters Before alcohol administration After alcohol administration P value*
VEP parameters N75 latency, ms P100 latency, ms N135 latency, ms Amp, N75-P100, µV Amp, P100-N135, µV
76.1 ± 10.1 109.4 ± 5.3 144.9 ± 8.6 8.9 ± 4.3 10.5 ± 5.8
79.6 ± 10.4 113.1 ± 8.2 114.7 ± 8.0 9.2 ± 4.9 9.2 ± 6.5
0.167 0.008† 0.637 0.865 0.064 mfERG parameters
Ring 1 P1 Amplitude, µV Ring 1 P1 Implicit Time, ms Ring 1 N1 Amplitude, µV Ring 1 N1 Implicit Time, ms Ring 2 P1 Amplitude, µV Ring 2 P1 Implicit Time, ms Ring 2 N1 Amplitude, µV Ring 2 N1 Implicit Time, ms Ring 3 P1 Amplitude, µV Ring 3 P1 Implicit Time, ms Ring 3 N1 Amplitude, µV Ring 3 N1 Implicit Time, ms
4.5 ± 1.1 37.9 ± 1.0 1.9 ± 0.5 18.1 ± 1.4 4.1 ± 0.6 36.1 ± 0.7 1.7 ± 0.2 17.8 ± 1.0 4.2 ± 0.8 36.1 ± 0.9 1.8 ± 0.3 18.1 ± 0.6
4.3 ± 0.9 37.2 ± 1.5 1.8 ± 0.4 18.2 ± 1.6
3.8 ± 0.8 35.4 ± 2.7 1.6 ± 0.4 18.2 ± 1.0 3.8 ± 0.7 36.0 ± 1.1 1.7 ± 0.3 18.4 ± 1.0
0.910 0.048 0.730 0.919 0.268 0.380 0.629 0.234 0.156 0.547 0.397 0.226 VEP, pattern reversal visual evoked potential; N, negative; P, positive; ms, milliseconds; µV, microvolt; mfERG, multifocal electroretinogram.
*Wilcoxon signed-rank test; †P < 0.05.
Ethics statement
The study protocol was reviewed and approved by the institu-
tional review board of the Korea University Medical Center, Seoul, Korea (#AS13075). Informed consent was submitted by all participating subjects before the investigation. All research and data collection protocols complied with the Declaration of Helsinki.
RESULTS
The clinical characteristics of the study subjects are presented in Table 1. A representative case is shown in Fig. 1.
The P100 latency in the VEP increased significantly, from 109.4 ± 5.3 milliseconds (ms) to 113.1 ± 8.2 ms (P = 0.008).
However, the P100 amplitude did not change significantly. The N135 amplitude and latency also did not show significant changes (Table 2). There was a trend of the shortening of P1 im-
Table 3. Spearman correlation analysis between blood alcohol concentration and delta ratio of each parameter in pattern visual evoked potential and multifocal elec- troretinogram
Parameters P value* R
VEP parameters N75 latency, ms P100 latency, ms N135 latency, ms Amp, N75-P100, µV Amp, P100-N135, µV
0.196 0.403 0.211 0.819 0.339
-0.354 -0.233 0.343 -0.065 0.265 mfERG parameters
Ring 1 P1 Amplitude, µV Ring 1 P1 Implicit Time, ms Ring 1 N1 Amplitude, µV Ring 1 N1 Implicit Time, ms Ring 2 P1 Amplitude, µV Ring 2 P1 Implicit Time, ms Ring 2 N1 Amplitude, µV Ring 2 N1 Implicit Time, ms Ring 3 P1 Amplitude, µV Ring 3 P1 Implicit Time, ms Ring 3 N1 Amplitude, µV Ring 3 N1 Implicit Time, ms
0.100 0.628 0.78 0.928 0.142 0.565 0.065 0.985 0.333 0.333 0.319 0.783
0.441 -1.36 -0.079
0.026 0.398 -0.162 0.487 -0.005 0.269 -0.269 0.276 -0.078 Delta ratio = 1-[parameter after alcohol administration]/[parameter before alcohol administration].
R, Spearmann correlation coefficient; VEP, pattern reversal visual evoked potential; N, negative; P, positive; ms, milliseconds; µV, microvolt; mfERG, multifocal electroretino- gram.
*Spearmann correlation test.
plicit time of ring 1 on the mfERG after alcohol administration, from 37.9 ± 1.0 ms to 37.2 ± 1.5 ms. However, the changes did not show statistically significance after Bonferroni correction.
No significant changes were noted in the other parameters, in- cluding the P1 and N1 amplitudes and the N1 implicit time of the three concentric rings (Table 2). Correlation between BAC and the delta ratio of parameters also did not show significant changes (Table 3). Scatter plots of VEP and mfERG parameters before versus after alcohol administration are shown in Fig. 2.
DISCUSSION
In this study, we analyzed changes in VEP and mfERG after al- cohol administration. We found significant delays in the P100 latency of the VEP. In contrast, we found a trend of shortening of the P1 implicit time on mfERG for ring 1, although it was not significant after Bonferroni correction. No changes in ampli- tude were observed in either VEP or mfERG. Moreover, the changes in VEP and mfERG parameters did not correlate with blood alcohol concentration.
Several previous studies have shown a delay in latency on VEP after alcohol administration in normal participants (3,10,13).
Azcona et al. (3) reported decreased amplitude and increased latency in the VEP pattern (BAC, 0-20 mM/L; 0-0.09 vol%), and Rohrbaugh et al. (13) found dose-related delays in late compo- nents of VEP along with a decreased amplitude (BAC, 20-80 mg%; 0.02-0.08 vol%). In addition, Colrain et al. (10) reported in-
creased latency of only the late VEP components with increased blood alcohol levels (BAC, 0.016-0.077 vol%). The results of these previous VEP studies are consistent with our finding of increased latency. The changes of VEP could be due to softening of focus after alcohol ingestion. Defocusing has been shown to reduce P1 amplitude, but not to delay the implicit time in mfERG (15).
However, the changes by defocusing are different from those ob- tained in the present study; we propose that ethanol intake likely contributed to these differences.
The N75, P100, and N135 components are generated from the striate cortex (V1) or the extra-striate cortex (16,17). Alco- hol-induced CNS suppression and nerve conduction delay have been reported to be mediated by GABA, glycine and ade- nosine (4,5,18). GABA and glycine are the main inhibitory neu- rotransmitters in the central nervous system (5). Alcohol also increases the level of adenosine, which contributes to the seda- tive actions of alcohol (5). Furthermore, interactions of alcohol with myelin or the Ca-ATPase pump at the synapses also may explain these changes (19). The increased implicit time of VEP after alcohol administration observed in this study is associated with these inhibitory mechanisms.
The waveform of mfERG is shaped largely by bipolar cell ac- tivity, together with a small contribution from photoreceptor cells and the inner (amacrine and ganglion) retinal cells (9).
Both bipolar and amacrine cells have GABA receptors (types A, B, and C) and glycine receptors at their axonal endings (20,21).
Accordingly, the ERG response also could be suppressed di- rectly by GABA (22). In this study, however, it was not deter- mined that the retinal function was inhibited by a GABA-medi- ated alcohol effect. P1 implicit time of mfERG in this study, showed a trend of shortening. It seemed to be stimulated slightly in contrast to the VEP results, although statistically not significant. Sometimes it is difficult to conclude that shortening of implicit time might be associated with excitatory changes, consider, for instance, the Pattern-ERG (reduced implicit time in pathology): when the spiking activity is suppressed or lost to secondary atrophy, the implicit time reduces for the P50 (23).
However, in general reduced implicit time was regarded in pre- vious papers to be associated with stimulant effect (24,25), and diminished amplitude or delayed implicit time was regarded to be associated with the pathologic retina (26-28).
We suspect that alcohol dehydrogenase in the retina might be responsible for the potential discrepancy between the mfERG and VEP responses after alcohol intake. The retina has the highest alcohol dehydrogenase activity of all organs, with the exception of the liver (29). The primary function of alcohol dehydrogenase in the retina is to metabolize retinol in the pho- toreceptors and in the retinal pigment epithelium (29). Addi- tionally, retinal alcohol dehydrogenase also might competitive- ly metabolize alcohol (29). Therefore, the retina is likely to be affected differently by alcohol than are other nerve tissues.
Our study had some limitations. First, the sample size was relatively small. Second, we used 19 hexagons with two record- ing segments for mfERG instead of 61 hexagons with eight re- cording segments, as suggested by the ISCEV standard protocol (8). We used the 19-hexagon protocol with the aim of minimiz- ing examinee discomfort and thus avoiding negative effects on the results. Third, full-field ERG was not performed. Moreover, the dose-response relationship of mfERG and VEP were not evaluated in the present study. These data would be useful;
however, it takes a long time to perform full-field ERG or dose- responses experiments in a single session, due to the additional adaptation time and multiple protocols that are required. Fur- thermore, it is difficult to maintain consistently, or to increase in stepwise fashion, blood alcohol concentration over a long period of time. Finally, the measured BAC levels of the partici- pants were variable after alcohol administration. Individual variation in the amount of alcohol dehydrogenase might have contributed to the variable BAC levels (30). Although partici- Fig. 2. Scatter plot of parameters of VEP and mfERG before versus after alcohol administration. VEP N75, P100, N135 latency, VEP N75-P100, P100-N135 amplitude before versus after alcohol administration (first row). P1 amplitude, P1 implicit time, N1 amplitude and N1 implicit time of mfERG Ring 1 (R1: second row), Ring 2 (R2: third row) and Ring 3 (R3: fourth row). Alc, alcohol; Lat, latency; Amp, amplitude; Imp, implicit time; R, ring; ms, mili-second; µV, micro-volt.
After Alc.
Before Alc.
VEP Lat. (ms)
50 100 150 150
100
50
N75 P100 N135
After Alc.
Before Alc.
VEP Amp. N75-P100 (μV)
0 5 10 15 20 25 25
20 15 10 5 0
After Alc.
Before Alc.
VEP Amp. P100-N135 (μV)
0 10 20 30 30
20
10
0
After Alc.After Alc.After Alc.
Before Alc.
Before Alc.
Before Alc.
mfERG R1 P1 Amp. (μV)
mfERG R2 P1 Amp. (μV)
mfERG R3 P1 Amp. (μV) 0 2 4 6 8
0 2 4 6 8
0 2 4 6 8 8
6 4 2 0
8 6 4 2 0
8 6 4 2 0
After Alc.After Alc.After Alc.
Before Alc.
Before Alc.
Before Alc.
mfERG R1 P1 lmp. (ms)
mfERG R2 P1 lmp. (ms)
mfERG R3 P1 lmp. (ms) 32 34 36 38 40 42
32 34 35 38 40 42
32 34 36 38 40 42 42
40 38 36 34 32
42 40 38 36 34 32
42 40 38 36 34 32
Before Alc.
Before Alc.
Before Alc.
mfERG R1 N1 Amp. (μV)
mfERG R2 N1 Amp. (μV)
mfERG R3 N1 Amp. (μV) 0 1 2 3
0 1 2 3
0 1 2 3 3
2
1
0
3
2
1
0
3
2
1
0
After Alc.After Alc.After Alc. After Alc.After Alc.After Alc.
Before Alc.
Before Alc.
Before Alc.
mfERG R1 N1 lmp. (ms)
mfERG R2 N1 lmp. (ms)
mfERG R3 N1 lmp. (ms) 12 14 16 18 20 22
12 14 16 18 20 22
12 14 16 18 20 22 22
20 18 16 14 12
22 20 18 16 14 12
22 20 18 16 14 12
pants who could not tolerate alcohol were excluded through medical history interview before the study, some participants still could have had aldehyde dehydrogenase deficiency, result- ing in a reduced rate of alcohol metabolism. In those people, increased blood acetaldehyde concentration as well as BAC af- ter alcohol ingestion also might have possible neurological ef- fects. Additionally, although participants fasted in the alcohol- EOG response study by Arden and Wolf (31), the food (spicy soup with noodle) was offered in the present study to facilitate alcohol ingestion. The rate of food consumption, and the quan- tity of food consumed also might affect the BAC levels.
In conclusion, ethanol administration appears to suppress the visual pathway of CNS, however, it is not determined whether alcohol intake affects the retina. Thus, further investi- gation will be necessary to confirm the results presented in this study. Also, full-field ERG with morphologic testing (e.g., opti- cal coherence tomography) after alcohol ingestion represents another area of scientific and clinical interest that might war- rant future investigation.
DISCLOSURE
The authors have no potential conflicts of interest to disclose.
AUTHOR CONTRIBUTION
Conception and design: Kim JT, Kim SW. Drafting the manu- script: Kim JT, Kim SW. Performed the study: Kim JT, Kim SW, Yun CM. Supervision of the study: Oh J, Huh K.
ORCID
Jee Taek Kim http://orcid.org/0000-0002-0818-6159 Cheolmin Yun http://orcid.org/0000-0002-7438-3660 Seong-Woo Kim http://orcid.org/0000-0003-0073-5800 Jaeryung Oh http://orcid.org/0000-0002-1036-6562 Kuhl Huh http://orcid.org/0000-0001-5792-4974 REFERENCES
1. Hindmarch I, Kerr JS, Sherwood N. The effects of alcohol and other drugs on psychomotor performance and cognitive function. Alcohol Alcohol 1991; 26: 71-9.
2. Leonard KE, Blane HT. Psychological Theories of Drinking and Alcohol- ism. 2nd ed. New York, NY: The Guilford Press, 1999.
3. Azcona O, Barbanoj MJ, Torrent J, Jané F. Evaluation of the central effects of alcohol and caffeine interaction. Br J Clin Pharmacol 1995; 40: 393- 400.
4. Reed TE. Effect in vivo of a sub-hypnotic dose of ethanol on nerve con- duction velocity in mice. Life Sci 1979; 25: 1507-12.
5. Valenzuela CF. Alcohol and neurotransmitter interactions. Alcohol
Health Res World 1997; 21: 144-8.
6. Gessa GL, Muntoni F, Collu M, Vargiu L, Mereu G. Low doses of ethanol activate dopaminergic neurons in the ventral tegmental area. Brain Res 1985; 348: 201-3.
7. Odom JV, Bach M, Brigell M, Holder GE, McCulloch DL, Tormene AP, Vaegan. ISCEV standard for clinical visual evoked potentials (2009 up- date). Doc Ophthalmol 2010; 120: 111-9.
8. Hood DC, Bach M, Brigell M, Keating D, Kondo M, Lyons JS, Marmor MF, McCulloch DL, Palmowski-Wolfe AM; International Society For Clinical Electrophysiology of Vision. ISCEV standard for clinical multifocal elec- troretinography (mfERG) (2011 edition). Doc Ophthalmol 2012; 124:
1-13.
9. Hood DC, Greenstein V, Frishman L, Holopigian K, Viswanathan S, Seiple W, Ahmed J, Robson JG. Identifying inner retinal contributions to the hu- man multifocal ERG. Vision Res 1999; 39: 2285-91.
10. Colrain IM, Taylor J, McLean S, Buttery R, Wise G, Montgomery I. Dose dependent effects of alcohol on visual evoked potentials. Psychophar- macology (Berl) 1993; 112: 383-8.
11. Ikeda H. Effects of ethyl alcohol on the evoked potential of the human eye. Vision Res 1963; 3: 155-69.
12. Knave B, Persson HE, Nilsson SE. A comparative study on the effects of barbiturate and ethyl alcohol on retinal functions with special reference to the C-wave of the electroretinogram and the standing potential of the sheep eye. Acta Ophthalmol (Copenh) 1974; 52: 254-9.
13. Rohrbaugh JW, Stapleton JM, Parasuraman R, Zubovic EA, Frowein HW, Varner JL, Adinoff B, Lane EA, Eckardt MJ, Linnoila M. Dose-related ef- fects of ethanol on visual sustained attention and event-related poten- tials. Alcohol 1987; 4: 293-300.
14. Skoog KO. The c-wave of the human D.C. registered ERG. III. Effects of ethyl alcohol on the c-wave. Acta Ophthalmol (Copenh) 1974; 52: 913-23.
15. Chan HL, Siu AW. Effect of optical defocus on multifocal ERG responses.
Clin Exp Optom 2003; 86: 317-22.
16. Tabuchi H, Yokoyama T, Shimogawara M, Shiraki K, Nagasaka E, Miki T.
Study of the visual evoked magnetic field with the m-sequence tech- nique. Invest Ophthalmol Vis Sci 2002; 43: 2045-54.
17. Tobimatsu S. Transient and steady-state VEPs—reappraisal. Int Congr Ser 2002; 1232: 207-11.
18. Weiner JL, Zhang L, Carlen PL. Potentiation of GABAA-mediated synap- tic current by ethanol in hippocampal CA1 neurons: possible role of pro- tein kinase C. J Pharmacol Exp Ther 1994; 268: 1388-95.
19. Sepúlveda MR, Mata AM. The interaction of ethanol with reconstituted synaptosomal plasma membrane Ca2+-ATPase. Biochim Biophys Acta 2004; 1665: 75-80.
20. Crooks J, Kolb H. Localization of GABA, glycine, glutamate and tyrosine hydroxylase in the human retina. J Comp Neurol 1992; 315: 287-302.
21. Pan ZH, Lipton SA. Multiple GABA receptor subtypes mediate inhibition of calcium influx at rat retinal bipolar cell terminals. J Neurosci 1995; 15:
2668-79.
22. Naarendorp F, Sieving PA. The scotopic threshold response of the cat ERG is suppressed selectively by GABA and glycine. Vision Res 1991; 31:
1-15.
23. Holder GE. Pattern electroretinography (PERG) and an integrated ap- proach to visual pathway diagnosis. Prog Retin Eye Res 2001; 20: 531-61.
24. Klemp K, Larsen M, Sander B, Vaag A, Brockhoff PB, Lund-Andersen H.
Effect of short-term hyperglycemia on multifocal electroretinogram in
diabetic patients without retinopathy. Invest Ophthalmol Vis Sci 2004;
45: 3812-9.
25. Gundogan FC, Erdurman C, Durukan AH, Sobaci G, Bayraktar MZ. Acute effects of cigarette smoking on multifocal electroretinogram. Clin Experi- ment Ophthalmol 2007; 35: 32-7.
26. Tyrberg M, Ponjavic V, Lövestam-Adrian M. Multifocal electroretinogram (mfERG) in patients with diabetes mellitus and an enlarged foveal avas- cular zone (FAZ). Doc Ophthalmol 2008; 117: 185-9.
27. Moon CH, Park TK, Ohn YH. Association between multifocal electroreti- nograms, optical coherence tomography and central visual sensitivity in advanced retinitis pigmentosa. Doc Ophthalmol 2012; 125: 113-22.
28. Bergholz R, Rüther K, Schroeter J, von Sonnleithner C, Salchow DJ. Influ- ence of chloroquine intake on the multifocal electroretinogram in pa- tients with and without maculopathy. Doc Ophthalmol 2015; 130: 211-9.
29. Mezey E, Holt PR. The inhibitory effect of ethanol on retinol oxidation by human liver and cattle retina. Exp Mol Pathol 1971; 15: 148-56.
30. Oshima S, Haseba T, Masuda C, Kakimi E, Sami M, Kanda T, Ohno Y. In- dividual differences in blood alcohol concentrations after moderate drinking are mainly regulated by gastric emptying rate together with eth- anol distribution volume. Food Nutr Sci 2012; 3: 732-7.
31. Arden GB, Wolf JE. The human electro-oculogram: interaction of light and alcohol. Invest Ophthalmol Vis Sci 2000; 41: 2722-9.