Therapeutic Effects of Mesenchymal Stem Cells for Patients with Chronic Liver Diseases: Systematic Review and Meta-analysis
Based on their ability to differentiate into multiple cell types including hepatocytes, the transplantation of mesenchymal stem cells (MSCs) has been suggested as an effective therapy for chronic liver diseases. The aim of this study was to evaluate the safety, efficacy and therapeutic effects of MSCs in patients with chronic liver disease through a literature- based examination. We performed a systematic review (SR) and meta-analysis (MA) of the literature using the Ovid-MEDLINE, EMBASE and Cochrane Library databases (up to November 2014) to identify clinical studies in which patients with liver diseases were treated with MSC therapy. Of the 568 studies identified by the initial literature search, we analyzed 14 studies and 448 patients based on our selection criteria. None of the studies reported the occurrence of statistically significant adverse events, side effects or complications. The majority of the analyzed studies showed improvements in liver function, ascites and encephalopathy. In particular, an MA showed that MSC therapy improved the total bilirubin level, the serum albumin level and the Model for End-stage Liver Disease (MELD) score after MSC treatment. Based on these results, MSC
transplantation is considered to be safe for the treatment of chronic liver disease. However, although MSCs are potential therapeutic agents that may improve liver function, in order to obtain meaningful insights into their clinical efficacy, further robust clinical studies must be conducted to evaluate the clinical outcomes, such as histological improvement, increased survival and reduced liver-related complications, in patients with chronic liver disease.
Keywords: Mesenchymal Stem Cells; Chronic Liver Diseases; Systematic Review;
Meta-analysis Gaeun Kim,1* Young Woo Eom,2*
Soon Koo Baik,2,3 Yeonghee Shin,1 Yoo Li Lim,3 Moon Young Kim,3 Sang Ok Kwon,3 and Sei Jin Chang4
1Research Institute for Nursing Science, Keimyung University, College of Nursing, Daegu; 2Cell Therapy and Tissue Engineering Center, 3Department of Internal Medicine, and 4Institute of Occupation and Environmental Medicine, Yonsei University, Wonju College of Medicine, Wonju, Korea
* Gaeun Kim and Young Woo Eom contributed equally to this work.
Received: 14 April 2015 Accepted: 10 June 2015 Address for Correspondence:
Soon Koo Baik, MD
Department of Internal Medicine, Yonsei University, Wonju College of Medicine, 20 Ilsan-ro, Wonju 26426, Korea Tel: +82.33-741-1223, Fax: +82.33-745-6782 E-mail: [email protected]
Funding: This research was supported by the Bisa Research Grant (2014-0284) of Keimyung University.
http://dx.doi.org/10.3346/jkms.2015.30.10.1405 • J Korean Med Sci 2015; 30: 1405-1415
INTRODUCTION
Cirrhosis is the end stage of chronic liver disease and can be in- duced by viral hepatitis, alcohol, drugs, metabolic diseases and autoimmune processes. Although liver transplantation is cur- rently recognized as the most effective treatment for chronic liver diseases (1), cell therapy has been widely studied in an ef- fort to develop alternative strategies due to the problems asso- ciated with transplantation, such as donor shortage, surgical complications, immunological rejection and high medical costs.
Cell therapies can be divided into bio-artificial liver devices and the direct infusion of cells. Bio-artificial liver devices that carry mainly porcine hepatocytes are primarily intended for the short- term support of patients with acute liver failure (2). For direct infusion, cells such as primary hepatocytes, unsorted bone mar- row cells (BMCs), hematopoietic stem cells (HSCs), and mes- enchymal stem cells (MSCs) have all been used. Of these cell types, MSCs have been isolated by plastic adherence from adi- pose tissue, umbilical cord blood, peripheral blood, brain, lung, liver, dermis and skeletal muscle (3-5). MSCs have the potential for self-renewal and differentiation into multiple cell lineages,
including hepatocytes. Moreover, MSCs can migrate toward ar- eas of injury in response to signals of cellular damage, which are known as homing signals. Based on this migratory property of MSCs, intravenous, intraperitoneal, intrahepatic, intrasplenic or portal-venous injections have been shown to deliver MSCs to the liver, although the reported effectiveness has differed sli- ghtly based on the injection route and the research group. Al- though the therapeutic mechanisms of BMC, HSC and MSC treatments are still not fully characterized, the available eviden- ce has more clearly demonstrated the therapeutic mechanisms of MSCs compared to BMCs or HSCs with respect to liver rege- neration. MSCs have been increasingly used in clinical practice, and thus, individual studies have increased. However, studies have presented conflicting results regarding the effect of MSCs.
Therefore, we systematically examined the efficacy and safety of MSCs using a literature-based approach in an attempt to con- firm the usefulness of MSC therapy for chronic liver disease. In- deed, systematic review (SR) and meta-analysis (MA) have been shown to enable objective analyses of the existing evidence (6).
In this study, we aimed to evaluate the safety, efficacy and ther- apeutic effects of human MSCs for patients with chronic liver Cell Therapy & Organ Transplantation
disease through a literature-based examination.
MATERIALS AND METHODS
We conducted an SR and MA of the literature using the Ovid- MEDLINE (1966 to November 2014), EMBASE (1988 to Novem- ber 2014) and Cochrane Library databases (up to November 2014) to identify clinical studies where patients with liver dis- eases were treated with MSC therapy. Databases were searched with a combination of MeSH terms and textwords for the popu- lation and the interventions; Boolean operators were also used.
The search terms included ([liver OR hepatic] AND [cirrhosis OR fibrosis OR disease OR failure OR cirrhotic] AND ([(mesen- chymal stem cell*) OR MSC*] AND [therapy OR treatment* OR transplantation]).
Studies were included if they met the following criteria: 1) they used MSC therapy for chronic liver disease (liver cirrhosis, liver fibrosis and liver failure, among others) and 2) they involved humans. Studies were excluded for the following reasons: 1) they did not use MSC therapy; 2) they did not include any pri- mary outcome (e.g., safety and feasibility of the intervention re- corded as prognostic liver scores, change in liver function tests);
3) they were review articles; 4) they were not published in Eng- lish; or 5) they were unpublished.
Using the search strategy described above, approximately 568 articles were considered. After the review, 14 articles met the selection criteria and were included in the analyses.
This study was conducted according to the Cochrane Hand- book for Systematic Reviews of Interventions (7) and the state- ment by the Preferred Reporting Items for Systematic Reviews and Meta-Analyses group (8).
Data extraction and methodological quality assessment Data were extracted by two reviewers according to the follow- ing specific items: authors, the year the study was conducted, country, study design, sample size, patient characteristics, du- ration of follow-up, type of cells used, injection route, injection dose, frequency of the administration of cells and liver function tests to measure the therapeutic efficacy including adverse events or side effects. Any disagreements or misunderstandings be- tween reviewers were resolved by discussion until a consensus was reached.
The critical appraisals of the selected studies were assessed with SIGN’s checklists (9) according to the study designs. The possible risk of bias was assigned to the following domains: se- quence generation, allocation concealment, blinding of investi- gators and outcome assessors and handling of the outcome data.
The quality of the included studies was assessed with criteria that were adapted from the SIGN checklist and a grade of “++”,
“+”, or “-” was applied. Potential publication bias was assessed using asymmetrical funnel plots.
Data synthesis and analysis
The outcome measures included safety and efficacy along with changes in liver function tests and the associated prognostic markers of liver disease, such as the MELD score or Child-Pugh score.
Data analyses were performed with the RevMan 5.3 program from the Cochrane collaboration to analyze the efficacy of the MSC interventions (10). Random effects models were used, as this method provides a more conservative estimate in the pres- ence of potential heterogeneity. The standardized mean differ- ences (SMDs) were calculated by means and SDs or by the chan- ged scores for each intervention. Heterogeneity was assessed with the I2 statistic. Potential publication bias was assessed by the inspection of funnel plots. If significant heterogeneity was present, the summary MA was abandoned and the possible sour- ces were explored with stratified analyses.
RESULTS
General characteristics of the selected studies
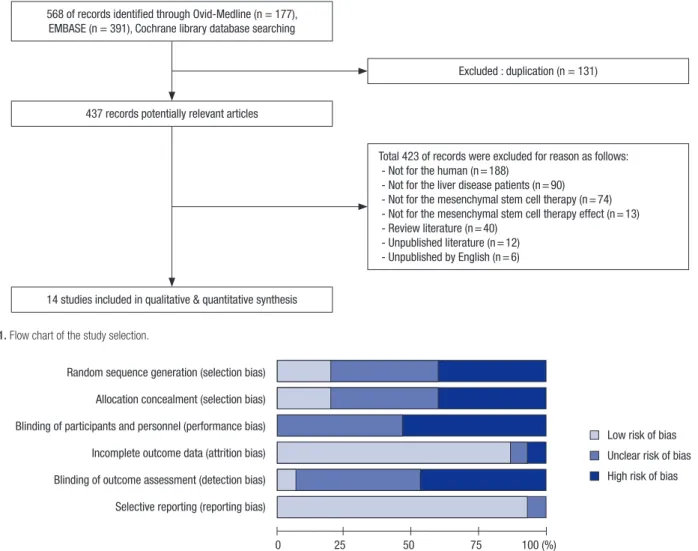
Our initial literature search yielded 568 citations, of which 131 were duplicate studies. Following the screening process, a total of 423 studies were excluded based on the selection criteria, of which 14 were ultimately identified as relevant to our review.
Therefore, we analyzed 14 studies (11-24) and 448 patients (Ta- ble 1). A detailed flow chart of the literature search and the study selection is presented in Fig. 1.
In this review, controlled trials (14, 16, 18, 20-24) and before- after studies (11-13, 15, 17, 19) were included. The sample sizes of most before-after studies were small ranging from 4 to 20, com- pared to controlled studies ranging from 12 to 158. From three randomized controlled trials (14, 16, 24), while two study dem- onstrated permuted block as a randomization method (14, 24), the other did not elucidate the method of randomization used (16). Marked heterogeneity was observed across the studies re- garding the outcome measures, the etiology of the liver disease, the type of cells that were given as well as the dose and injection route. The mean duration of follow-up was 9 months.
The majority of the studies used MSCs, 8 of which used the peripheral route, while the other studies used the intrasplenic (3 studies), hepatic artery (2 studies) and portal vein (1 study) routes. One compared intrasplenic administration with periph- eral administration, while another compared the intrasplenic route with the intrahepatic route.
The included studies were published between 2007 and 2014.
Five of the studies were conducted in China (17-19, 21, 22) and Egypt (11, 16, 20, 23, 24), while the others were conducted in Iran (14, 15), Korea (12) and Sweden (13) (Table 1).
Largely, the studies that have been published to date were designed to investigate safety and feasibility as the primary out- come measures.
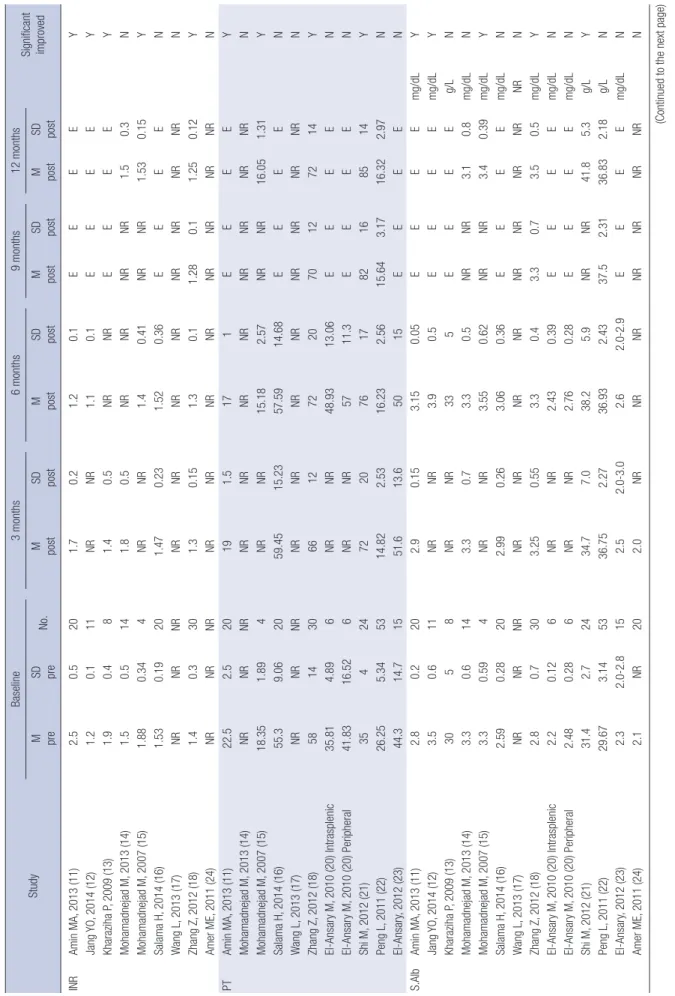
Methodological quality and risk of bias in the included studies
The quality assessment of each study is found in Table 1 and Fig. 2. Overall, 8 controlled trials (14, 16, 18, 20-24) were deter- mined to have a grade of “++” or “+” (Table 1). While all non-ran- domized controlled tirals were graded as “+” (18, 20-23), three
randomized clinical trials were determinded to have a grade of
“++” or “+” (14, 16, 24) according to blindness and randomiza- tion method. The assessment items used for evaluation were as follows: selection bias (random sequence generation, alloca- tion concealment), performance bias, attrition bias, detection bias and reporting bias. Before-after studies were not evaluated Table 1. Summary of the included studies
First author, publish year
Conducted country
Study design,
F/U (month) Patients, sample size Mean age range
(mean ± SD), (yr) Injection route Cell
source Cell dosage Overall study quality Amin MA, 2013
(11) Egypt Before-after study
6 Post-HCV LC (patient with end-stage LC), Child C n = 20 (M:F = 14:6)
42-60 (51.3 ± 6.2) IS BM 10 × 106 in 10 mL
PBS -
Jang YO, 2014
(12) Korea Before-after study
6 Alcoholic cirrhosis
n = 11 (M:F = 10:1) 37-60 (50 ± 8) HA BM Each 5 × 10⁷ in
10 mL NS, twice - Kharaziha P,
2009 (13)
Sweden Before-after study 6
LC, end stage liver disease (HBV 4, HCV 1, alcoholic 1, cryptogenic 2), MELD score ≥ 10 n = 8 (M:F = 4:4)
38-67 (55.63 ± 10.45) Portal vein (n = 6) or PV
(n = 2)
BM 3 × 10⁷-5 × 10⁷ in 10 mL NS
-
Mohamadnejad
M, 2013 (14) Iran Controlled trials
12 Decompensated LC (cirrhosis cryptogenic 11, PBC 2, HBV 2, HCV 1, AIH 9)
n = 25 (M:F = 13:12), 1) MSC (n = 14), 2) Control (placebo) (n = 11)
1) MSC 43.1 ± 17.6
2) Control 34.6 ± 13.8 PV BM Median of 195 million (120- 295 million) in 100 mL NS
+
Mohamadnejad
M, 2007 (15) Iran Case series
12 Decompensated LC (cryptogenic 3, AIH1)
n = 4 (M:F = 1:3)
34-56 (47.3) PV BM 31.7 × 10⁶ (10.2-
60 × 106) in 20 mL NS
-
Salama H, 2014
(16) Egypt Controlled trials
6 Post-HCV end-stage liver disease n = 40 (M:F = 33:7) 1) MSC
(n = 20), 2) Control (n = 20)
1) MSC 50.27 ± 6.05
2) Control 50.9 ± 7.23 PV BM 1 × 10⁶/kg ++
Wang L, 2013 (17)
China Before-after study 12
UDCA-resistant PBC n = 7 (M:F = 1:6)
33-58 (49) PV UC Each 0.5 × 10⁶/kg
in NS, thrice - Zhang Z, 2012
(18) China Controlled trials
12 HBV with decompensated LC n = 45 (M:F = 40:5) 1) MSC (n = 30), 2) Control (saline) (n = 15)
1) MSC 48 (25-64)
2) Control 47 (29-64) PV UC Each 0.5 × 10⁶/kg in NS, thrice +
Wang L, 2014 (19)
China Before-after study 12
UDCA-resistant PBC n = 10 (M:F = 1:9)
31-61 (49.1) PV BM 3-5 × 10⁵/kg -
El-Ansary M,
2010 (20) Egypt Controlled trials
6 CHF due to HCV or HBV, MELD > 12, Child C , LC n = 12 (M:F = 8:4), 1) IS (n = 6),
2) PV (n = 6)
1) IS 48.50 ± 11.09 (32-69)
2) PV 50.83 ± 6.88 (43-59)
1) IS
2) PV BM 1 × 10⁷ in 5 mL
NS +
Shi M, 2012 (21) China Controlled trials 18
ACLF associated HBV n = 43 (M:F = 35:8), 1) MSC
(n = 24), 2) Control (saline) (n = 19)
1) MSC m 40 (24-59) 2) Control m 45 (26-62)
PV UC Each 0.5 × 10⁶/kg, thrice
+
Peng L, 2011 (22) China Controlled trials
45 (192 weeks) LF caused by HBV
n = 158 (M:F = 149:9), 1) MSC (n = 53), 2) Control (n = 105)
1) MSC 42.19 ± 10.80
2) Control 42.22 ± 11.47 HA BM NR +
El-Ansary M,
2012 (23) Egypt Controlled trials
6 CHF due to HCV, MELD > 12, Child C, LC
n = 25 (M:F = 19:6), 1) MSC (n = 15), 2) Control (n = 10)
1) MSC 48.0 ± 7.4 (32.0-60.0) 2) Control 51.6 ± 7.2
(39.0-60.0)
PV BM 1 × 10⁶/kg in NS +
Amer ME, 2011 (24)
Egypt Controlled trials 6
Chronic HCV-associated LF, MELD > 25, Child C, LC n = 40 (M:F = 33:7) 1) MSC
(n = 20), 2) Control (n = 20)
1) MSC 50.5 + 4.1 2) Control 45-55 + 3.6
(1) IS (n = 10) (2) IH (n = 10)
BM 2 × 10⁷ ++
AIH, auto immune hepatitis; BM, bone marrow; CHF, chronic hepatic failure; Child C, end-stage liver cirrhosis; HA, hepatic artery; HBV, hepatitis B virus; HCV, hepatitis C virus;
IH, intrahepatic; IS, intrasplenic; LC, liver cirrhosis; LF, liver failure; MELD, model for end-stage liver disease; MSC, mesenchymal stem cell; NS, normal saline; PBC, primary bili- ary cirrhosis; PBS, phosphate-buffered saline; PV, peripheral vein; RCT, randomized controlled trials; UC, umbilical cord; UDCA, ursodeoxycholic acid; ACLF, acute-on-chronic liver failure; NR, not report.
with a checklist according to SIGN’s recommendation and mark- ed as a grade of “-” (Table 1). All grades of biases presented as a RevMan’s risk of bias graph (Fig. 2).
Efficacy of MSCs: liver function parameters/prognostic MELD and Child-Pugh scores
These studies were analyzed with a random effects model, which covers both sampling error and random error, in light of the high value of I2 that was obtained in the test for homogeneity. As a result of the analyses, the overall effect size was 0.538 (95% con- fidence interval [CI], 0.240-0.835; standard error [SE], 0.129; P <
0.001), which was higher than the median found by Cohen (1988).
Bias was investigated using a visual tool (funnel plot) to deter- mine the validity of the outcomes. With the exception of a few extreme values, a relatively stable distribution was display ed.
The outcomes were investigated according to the indices de- scribed below.
In relation to liver function, the values of total bilirubin showed a significant decrease after intervention compared with pre-in- tervention in seven studies among the 14 pooled studies. In a
MA of studies that compared the effects of experimental groups and control groups, the experimental groups showed statistical- ly significant reductions in the SMD values, which were -0.75 (95% CI, -0.99- -0.51; I2, 0%; P < 0.001), -0.52 (95% CI, -0.75- -0.28; I2, 0%; P < 0.001), and -0.28 (95% CI, -0.54- -0.01; I2, 54%;
P = 0.04) in the 3, 6, and 9 months after treatment, respectively.
On the contrary, no statistical significance was observed in the 12 months after treatment (SMD -0.14 [95% CI, -0.70-0.42; I2, 74%; P = 0.62]) (Tables 2 and 3, and Fig. 3). No significant differ- ence was observed between the intrasplenic and peripheral groups (20) and between the hepatic and splenic groups (24). It was reported that serum albumin was significantly increased in the post-intervention group compared with the pre-intervention group in five out of 13 studies. In an MA of studies that compar- ed the effects of experimental groups to those of control groups, the effects on the experimental groups were increased compared with controls according to the SMD, which was 0.74 (95% CI, 0.07-1.42; P = 0.03), 0.67 (95% CI, -0.05-1.39; P = 0.07), 0.59 (95%
CI, 0.33-0.85; P < 0.001), and 0.55 (95% CI, -0.64-1.74; P = 0.37) in the 3, 6, 9, and 12 months after treatment, respectively. I2, which 568 of records identified through Ovid-Medline (n = 177),
EMBASE (n = 391), Cochrane library database searching
Excluded : duplication (n = 131)
Total 423 of records were excluded for reason as follows:
- Not for the human (n = 188)
- Not for the liver disease patients (n = 90) - Not for the mesenchymal stem cell therapy (n = 74) - Not for the mesenchymal stem cell therapy effect (n = 13) - Review literature (n = 40)
- Unpublished literature (n = 12) - Unpublished by English (n = 6) 437 records potentially relevant articles
14 studies included in qualitative & quantitative synthesis
Fig. 1. Flow chart of the study selection.
Fig. 2. Risk of bias. Summary of risk of bias for 14 selected studies.
Random sequence generation (selection bias) Allocation concealment (selection bias) Blinding of participants and personnel (performance bias) Incomplete outcome data (attrition bias) Blinding of outcome assessment (detection bias) Selective reporting (reporting bias)
0 25 50 75 100 (%)
Low risk of bias Unclear risk of bias High risk of bias
is one measure of heterogeneity, was 84%, 87%, 0%, and 93% in the 3, 6, 9, and 12 months after treatment, respectively (Tables 2 and 3, and Fig. 3).
In four studies (11, 15, 18, 21) out of 10 (11, 14-18, 20-23) that included measurements of prothrombin time, a significant de- crease was observed in the post-intervention data compared with the pre-intervention data. In an MA of studies that com- pared the experimental groups and controls, the experimental groups showed SMDs of 0.03 (95% CI, -1.04-1.11; I2, 94%; P =
0.95), 0.37 (95% CI, -0.29-1.02; I2, 85%; P = 0.27), 0.15 (95% CI, -0.75-1.04; I2, 89%; P = 0.75), and 0.31 (95% CI, -0.79-1.42; I2, 93%;
P = 0.58) in the 3, 6, and 9 months after treatment, respectively, indicating high heterogeneity; however, these differences were not statistically significant (Tables 2 and 3, and Fig. 3). In terms of the international normalized ratio (INR), while five studies (11-13, 15, 16) out of nine (11-18, 24) showed significant effects, only one study (16) among 3 total studies (14, 16, 18) showed a significant difference in an MA of trials that compared controls Table 2. Experimental group vs. control group change value
Group No. of
patients Baseline 3 months 6 months 9 months 12 months Unit
INR Mohamadnejad M, 2013 (14) Salama H, 2014 (16) Zhang Z, 2012 (18)
Experimental Control Experimental Control Experimental Control
14 11 20 20 30 15
1.5 ± 0.5 1.6 ± 0.2 1.53 ± 0.19 1.66 ± 0.33 1.4 ± 0.3 1.3 ± 0.15
1.8 ± 0.5 1.6 ± 0.4 1.47 ± 0.23 0.73 ± 0.4
1.3 ± 0.15 1.2 ± 0.1
1.5 ± 0.4 1.4 ± 0.3 1.52 ± 0.36 1.84 ± 0.39 1.3 ± 0.1 1.2 ± 0.12
NR NR E E 1.28 ± 0.1 1.25 ± 0.15
1.5 ± 0.3 1.3 ± 0.4
E E 1.25 ± 0.12
1.2 ± 0.12 PT Salama H, 2014 (16)
Zhang Z, 2012 (18) Shi M, 2012 (21) Peng L, 2011 (22) El-Ansary, 2012 (23)
Experimental Control Experimental Control Experimental Control Experimental Control Experimental Control
20 20 30 15 24 19 53 105 15 10
55.3 ± 9.06 52.85 ± 10.16
58 ± 14 64 ± 12 35 ± 4 32 ± 9 26.25 ± 5.34 25.95 ± 5.72
44.3 ± 14.7 41.7 ± 14.2
59.45 ± 15.23 50.45 ± 11.42
66 ± 12 75 ± 15 72 ± 20 58 ± 6 14.82 ± 2.53 19.25 ± 3.66 51.6 ± 13.6 39.5 ± 15.5
57.59 ± 14.68 45.03 ± 10.92
72 ± 20 74 ± 14 76 ± 17 64 ± 11 16.23 ± 2.56 17.53 ± 3.31 50 ± 15 36.8 ± 16
E E 70 ± 12 70 ± 14 82 ± 16 66 ± 14 15.64 ± 3.17 17.19 ± 3.07
E E
E E 72 ± 14 72 ± 10 85 ± 14 67 ± 8 16.32 ± 2.97 17.75 ± 3.14
E E
Prothrombin con- centration % Prothrombin
activity % Prothrombin
activity % Prothrombin time
(sec) Prothrombin con-
centration % S.Alb Mohamadnejad M,
2013 (14) Salama H, 2014 (16) Zhang Z, 2012 (18) Shi M, 2012 (21) Peng L, 2011 (22)
Experimental Control Experimental Control Experimental Control Experimental Control Experimental Control
14 11 20 20 30 15 24 19 53 105
3.3 ± 0.6 3.5 ± 0.6 2.59 ± 0.28 2.62 ± 0.37
28 ± 7 28 ± 18 3.14 ± 0.27 2.82 ± 0.39 29.67 ± 3.14 29.40 ± 3.92
3.3 ± 0.7 3.8 ± 0.5 2.99 ± 0.26 2.63 ± 0.3 32.5 ± 5.5 30 ± 5 3.47 ± 0.7 2.83 ± 0.05 36.75 ± 2.27 33.93 ± 1.98
3.3 ± 0.5 3.9 ± 0.7 3.06 ± 0.36 2.43 ± 0.36
33 ± 4 32 ± 7 3.82 ± 0.59 3.26 ± 0.13 36.93 ± 2.43 34.33 ± 2.61
NR NR E E 33 ± 7 30 ± 5 NR NR 37.50 ± 2.31 36.17 ± 1.97
3.1 ± 0.8 3.9 ± 0.3
E E 35 ± 5 30 ± 3 4.18 ± 0.53 3.08 ± 0.4 36.83 ± 2.18 36.73 ± 2.71
g/dL g/dL g/L g/dL g/L T.Bil Mohamadnejad M,
2013 (14) Salama H, 2014 (16) Zhang Z, 2012 (18) Shi M, 2012 (21) Peng L, 2011 (22)
Experimental Control Experimental Control Experimental Control Experimental Control Experimental Control
14 11 20 20 30 15 24 19 53 105
2.6 ± 1.4 3.5 ± 2.2 1.88 ± 1.05 2.51 ± 0.94 42.0 ± 22.0 48.0 ± 7.0 325.0 ± 124.0 330.0 ± 130.0 201.170 ± 75.450 295.730 ± 56.020
4.1 ± 2.4 5.3 ± 1.9 1.82 ± 1.3 4.02 ± 3.29 30.0 ± 17.0 38.0 ± 12.0 50.0 ± 50.0 75.0 ± 20.0 27.080 ± 6.390 42.530 ± 21.170
2.2 ± 1 3 ± 1.6 2.06 ± 1.26 4.24 ± 2.48 29.0 ± 16.0 36.0 ± 14.0 45.0 ± 40.0 65.0 ± 40.0 72 ± 20 22.170 ± 4.620
NR NR E E 28.0 ± 18.0 30.0 ± 9.0 28.0 ± 10.0 50.0 ± 35.0 70 ± 12 27.600 ± 10.290
2.2 ± 1.4 2.7 ± 1.4
E E 26.0 ± 18.0 29.0 ± 6.0 25.0 ± 10.0 52.0 ± 60.0 72 ± 14 26.830 ± 5.780
mg/dL mg/dL µM µM µM MELD Mohamadnejad M,
2013 (14) Shi M, 2012 (21) Peng L, 2011 (22) Amer ME, 2011 (24)
Experimental Control Experimental Control Experimental Control Experimental Control
14 11 24 19 53 105 20 20
15.4 ± 5.4 14.4 ± 3.7 24.05 ± 4.0 26.5 ± 4.6 29.58 ± 0.93 29.62 ± 3.75 11.57 ± 2.26 12.55 ± 2.61
15.3 ± 8.2 14.7 ± 5.1 9.2 ± 5.8 14.7 ± 4.5 15.29 ± 2.25 19.73 ± 7.49
NR NR
NR NR NR NR 14.67 ± 2.89 18.37 ± 2.91 11.66 ± 2.29 14.11 ± 2.73
NR NR NR NR 15.55 ± 1.73 18.79 ± 2.73
E E
14 ± 3.6 12.5 ± 4.3
NR NR 17.39 ± 2.68
18.0 ± 2.52 E E Child Mohamadnejad M,
2013 (14) Amer ME, 2011 (24)
Experimental Control Experimental Control
14 11 20 20
7.7 ± 2.5 8.3 ± 1.8 11.45 ± 1.09
11.7 ± 1.08
7 ± 2.9 6.8 ± 2.1
NR NR
NR NR 11.45 ± 0.95 12.35 ± 0.67
NR NR E E
7.2 ± 1.7 6.6 ± 1.5
E E
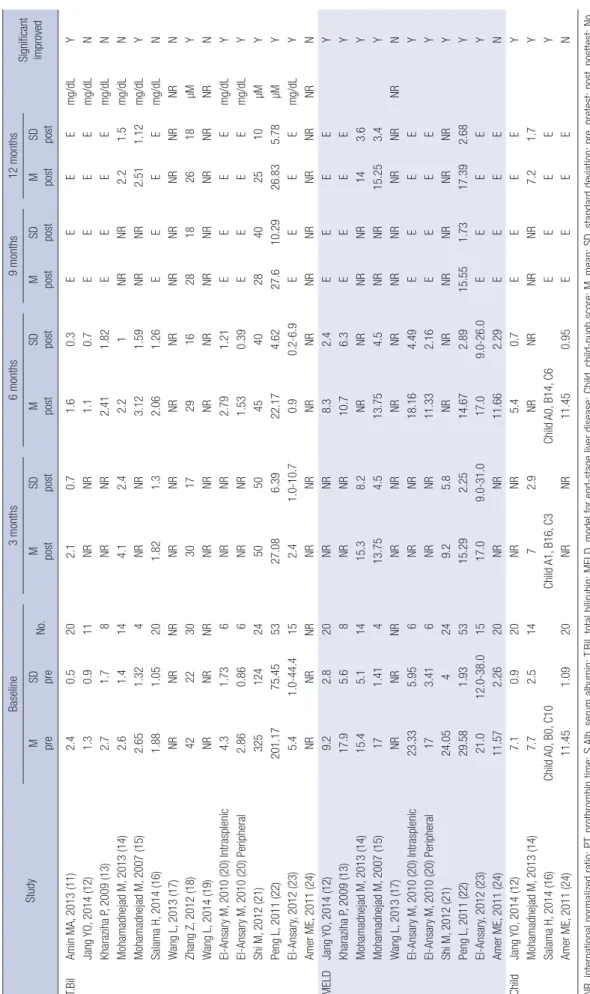
Data represent mean ± SD. INR, international normalized ratio; PT, prothrombin time; S.Alb, serum albumin; T.Bil, total bilirubin; MELD, model for end-stage liver disease; Child, child-pugh score; NR, not reported; E, end of study.
Table 3. Pre-post change value StudyBaseline3 months6 months9 months12 months Significant improvedM preSD preNo.M postSD postM postSD postM postSD postM postSD post INRAmin MA, 2013 (11)2.50.5201.70.21.20.1EEEEY Jang YO, 2014 (12)1.20.111NRNR1.10.1EEEEY Kharaziha P, 2009 (13)1.90.481.40.5NRNREEEEY Mohamadnejad M, 2013 (14)1.50.5141.80.5NRNRNRNR1.50.3N Mohamadnejad M, 2007 (15)1.880.344NRNR1.40.41NRNR1.530.15Y Salama H, 2014 (16)1.530.19201.470.231.520.36EEEEN Wang L, 2013 (17)NRNRNRNRNRNRNRNRNRNRNRN Zhang Z, 2012 (18)1.40.3301.30.151.30.11.280.11.250.12Y Amer ME, 2011 (24)NRNRNRNRNRNRNRNRNRNRNRN PTAmin MA, 2013 (11)22.52.520191.5171EEEEY Mohamadnejad M, 2013 (14)NRNRNRNRNRNRNRNRNRNRNRN Mohamadnejad M, 2007 (15)18.351.894NRNR15.182.57NRNR16.051.31Y Salama H, 2014 (16)55.39.062059.4515.2357.5914.68EEEEN Wang L, 2013 (17)NRNRNRNRNRNRNRNRNRNRNRN Zhang Z, 2012 (18)5814306612722070127214Y El-Ansary M, 2010 (20) Intrasplenic35.814.896NRNR48.9313.06EEEEN El-Ansary M, 2010 (20) Peripheral41.8316.526NRNR5711.3EEEEN Shi M, 2012 (21)354247220761782168514Y Peng L, 2011 (22)26.255.345314.822.5316.232.5615.643.1716.322.97N El-Ansary, 2012 (23)44.314.71551.613.65015EEEEN S.AlbAmin MA, 2013 (11)2.80.2202.90.153.150.05EEEEmg/dLY Jang YO, 2014 (12)3.50.611NRNR3.90.5EEEEmg/dLY Kharaziha P, 2009 (13)3058NRNR335EEEEg/LN Mohamadnejad M, 2013 (14)3.30.6143.30.73.30.5NRNR3.10.8mg/dLN Mohamadnejad M, 2007 (15)3.30.594NRNR3.550.62NRNR3.40.39mg/dLY Salama H, 2014 (16)2.590.28202.990.263.060.36EEEEmg/dLN Wang L, 2013 (17)NRNRNRNRNRNRNRNRNRNRNRNRN Zhang Z, 2012 (18)2.80.7303.250.553.30.43.30.73.50.5mg/dLY El-Ansary M, 2010 (20) Intrasplenic2.20.126NRNR2.430.39EEEEmg/dLN El-Ansary M, 2010 (20) Peripheral2.480.286NRNR2.760.28EEEEmg/dLN Shi M, 2012 (21)31.42.72434.77.038.25.9NRNR41.85.3g/LY Peng L, 2011 (22)29.673.145336.752.2736.932.4337.52.3136.832.18g/LN El-Ansary, 2012 (23)2.32.0-2.8152.52.0-3.02.62.0-2.9EEEEmg/dLN Amer ME, 2011 (24)2.1NR202.0NRNRNRNRNRNRNRN (Continued to the next page)
StudyBaseline3 months6 months9 months12 months Significant improvedM preSD preNo.M postSD postM postSD postM postSD postM postSD post T.BilAmin MA, 2013 (11)2.40.5202.10.71.60.3EEEEmg/dLY Jang YO, 2014 (12)1.30.911NRNR1.10.7EEEEmg/dLN Kharaziha P, 2009 (13)2.71.78NRNR2.411.82EEEEmg/dLN Mohamadnejad M, 2013 (14)2.61.4144.12.42.21NRNR2.21.5mg/dLN Mohamadnejad M, 2007 (15)2.651.324NRNR3.121.59NRNR2.511.12mg/dLY Salama H, 2014 (16)1.881.05201.821.32.061.26EEEEmg/dLN Wang L, 2013 (17)NRNRNRNRNRNRNRNRNRNRNRNRN Zhang Z, 2012 (18)4222303017291628182618µMY Wang L, 2014 (19)NRNRNRNRNRNRNRNRNRNRNRNRN El-Ansary M, 2010 (20) Intrasplenic4.31.736NRNR2.791.21EEEEmg/dLY El-Ansary M, 2010 (20) Peripheral2.860.866NRNR1.530.39EEEEmg/dLY Shi M, 2012 (21)325124245050454028402510µMY Peng L, 2011 (22)201.1775.455327.086.3922.174.6227.610.2926.835.78µMY El-Ansary, 2012 (23)5.41.0-44.4152.41.0-10.70.90.2-6.9EEEEmg/dLY Amer ME, 2011 (24)NRNRNRNRNRNRNRNRNRNRNRNRN MELDJang YO, 2014 (12)9.22.820NRNR8.32.4EEEEY Kharaziha P, 2009 (13)17.95.68NRNR10.76.3EEEEY Mohamadnejad M, 2013 (14)15.45.11415.38.2NRNRNRNR143.6Y Mohamadnejad M, 2007 (15)171.41413.754.513.754.5NRNR15.253.4Y Wang L, 2013 (17)NRNRNRNRNRNRNRNRNRNRNRNRN El-Ansary M, 2010 (20) Intrasplenic23.335.956NRNR18.164.49EEEEY El-Ansary M, 2010 (20) Peripheral173.416NRNR11.332.16EEEEY Shi M, 2012 (21)24.054249.25.8NRNRNRNRNRNRY Peng L, 2011 (22)29.581.935315.292.2514.672.8915.551.7317.392.68Y El-Ansary, 2012 (23)21.012.0-38.01517.09.0-31.017.09.0-26.0EEEEY Amer ME, 2011 (24)11.572.2620NRNR11.662.29EEEEN ChildJang YO, 2014 (12)7.10.920NRNR5.40.7EEEEY Mohamadnejad M, 2013 (14)7.72.51472.9NRNRNRNR7.21.7Y Salama H, 2014 (16)Child A0, B0, C10Child A1, B16, C3Child A0, B14, C6EEEEY Amer ME, 2011 (24)11.451.0920NRNR11.450.95EEEEN INR, international normalized ratio; PT, prothrombin time; S.Alb, serum albumin; T.Bil, total bilirubin; MELD, model for end-stage liver disease; Child, child-pugh score; M, mean; SD, standard deviation; pre, pretest; post, posttest; No., number of patients; NR, not reported; E, end of study; Y, yes; N, no.
Table 3. Continued
Total bilirubin
Experimental Control Weight
(%) Std. Mean difference IV,
fixed, 95% CI Year Std. Mean difference IV, fixed, 95% CI
Mean SD No. Mean SD No.
Peng L (22) 22.17 4.62 53 25.7 10.54 105 50.1 -0.39 (-0.72- -0.06) 2011
Zhang Z (18) 29 16 30 36 14 15 14.1 -0.45 (-1.04-0.18) 2012
Shi M (21) 45 40 24 65 40 19 14.9 -0.49 (-1.10-0.12) 2012
Mohamadnejad M (14) 2.2 1 14 3 1.6 11 8.5 -0.60 (-1.46-0.21) 2013
Salama H (16) 2.06 1.26 20 4.24 2.48 20 12.4 -1.09 (-1.75- -0.42) 2014
Total (95% CI) 141 170 100.0 -0.52 (-0.75- -0.28)
Heterogeneity: Chi2= 3.44, df = 4 (P=0.49); I2= 0%
Test for overall effect: Z = 4.30 (P<0.0001)
Favours (E) Favours (C) -2 -1 0 1 2
Serum albumin
Experimental Control Weight
(%) Std. Mean difference IV,
fixed, 95% CI Year Std. Mean difference IV, fixed, 95% CI
Mean SD No. Mean SD No.
Peng L (22) 36.93 2.43 95 34.33 2.61 105 22.9 1.03 (0.73-1.32) 2011
Shi M (21) 38.2 5.9 24 32.6 1.3 19 19.8 1.22 (0.56-1.88) 2012
Zhang Z (18) 33 4 30 32 7 15 20.2 0.19 (-0.43-0.81) 2012
Mohamadnejad M (14) 3.3 0.5 14 3.9 0.7 11 18.0 -0.97 (-1.82- -0.13) 2013
Salama H (16) 3.06 0.36 20 2.43 0.36 20 19.1 1.72 (0.98-2.45) 2014
Total (95% CI) 183 170 100.0 0.67 (-0.05-1.39)
Heterogeneity: Tau2= 0.57; Chi2= 30.22, df = 4 (P<0.00001); I2= 87%
Test for overall effect: Z = 1.82 (P=0.07)
Favours (C) Favours (E) -2 -1 0 1 2
A
B Fig. 3. Forest plots. The effects of MSC treatment on total bilirubin (A) and serum albumin (B) were estimated after 6 months of treatment. SD, standard deviation; N, number of patients; CI, confidence interval; E, experimental; C, control; IV, inverse variance.
and experimental groups (Tables 2 and 3).
In regard to aspartate aminotransferase levels, among the six pooled trials, a significant reduction in this level was observed only in three trials. In particular, a significant decrease in the peripheral group was observed in one study (20). In three trials that compared experimental groups and control groups (14, 16, 23), no significant differences were observed. In terms of ala- nine aminotransferase levels, five trials (11, 14, 15, 19, 21) out of 11 pooled trials showed a statistically significant decrease. In two trials (16, 21) out of five (14, 16, 21-23), a significant differ- ence was observed in studies that compared experimental groups to controls. In regard to renal function, the creatinine level was significant in three out of six trials; however, significant differ-
ences compared with the control groups were observed in only one (18) out of two pooled research studies (18, 23).
When the ten trials (12-15, 17, 20-24) were pooled in relation to the MELD score, eight trials (12-15, 20-23) demonstrated a significant decrease after intervention compared with before the intervention. In the 3, 6, 9, and 12 months after treatment, the experimental groups showed a decrease compared with the control groups (SMD -0.69 [95% CI, -0.98- -0.41; I2, 30%; P <
0.001], -1.02 [95% CI, -1.33- -0.71; I2, 59%; P < 0.001], -1.11 [95%
CI, -1.46- -0.75; I2, 0%; P < 0.001], -0.14 [95% CI, -0.45-0.16; I2, 0%; P = 0.36]), and these decreases were statistically significant for the 3, 6, and 9 months (Tables 2 and 3, and Fig. 3).
With regards to the Child-Pugh score, among four pooled tri-
als (12, 14, 16, 24), three trials showed a significant post-inter- vention reduction compared with the pre-intervention scores.
While a pooled estimate of two trials (14, 24) included in the MA showed a decrease (SMD -0.06 [95% CI, -1.26-1.14; I2, 82%;
P = 0.92]), it was not statistically significant (Tables 2 and 3, and Fig. 3).
Although the use of the portal vein and the peripheral vein demonstrated the highest efficacy, followed by intrasplenic in- jection, no significant differences were noted with respect to the injection method. Furthermore, in terms of cell source, no significant difference was observed between cells from the um- bilical cord and cells from the bone marrow. Funnel plots for MELD score showed symmetrical distributions, indicating no publication bias.
Efficacy of MSCs: histological changes and hepatic encephalopathy
Two research papers (12, 19) reported histological improvement without histological liver deterioration after MSC injection. Out of 11 research papers (11, 13-20, 23, 24) that included informa- tion on the ascites status, ten studies reported improvement in this measure. All eight research papers (11, 13, 16, 17, 19, 20, 23, 24) that included data on encephalopathy reported an impro- vement in this outcome.
Safety of MSCs: adverse effects and complications
All 14 research papers (11-24) included in this analysis reported no statistically significant adverse events, side effects or compli- cations. Therefore, according to this MA, it was concluded that no safety issues are associated with MSC treatment.
DISCUSSION
This SR and MA demonstrated that MSC therapy is feasible and safe in patients with chronic liver disease due to the lack of re- ports of significant adverse effects in the included studies, al- though a marked heterogeneity was observed among studies with regards to injection dose, cell source, delivery route and study design. Moreover, chronic liver diseases such as auto im- mune hepatitis (AIH), acute-on-chronic liver failure (ACLF), chronic hepatic failure (CHF), liver cirrhosis (LC), liver failure (LF) and primary biliary cirrhosis (PBC) can be induced by viral hepatitis, alcohol, drugs, metabolic diseases and autoimmune processes (Table 1). Therefore, this diversity of chronic liver dis- ease might cause different results in MSC therapy and then re- sult in selection bias.
Of the 568 studies identified, 14 were eligible for inclusion (11-24). The majority of the analyzed studies evaluated the clin- ical efficacy of MSCs via the assessment of whether liver func- tion was improved after MSC treatment. Most results showed positive therapeutic effects, even though the dosage of the in-
jected MSCs varied from 1 ×10⁷ to 2.95 ×10⁸ cells per patient (11, 14, 17, 18, 21). A low cell dosage for transplantation is very important to reduce the transplant costs and decrease the delay for optimal therapeutic timing in the clinical application of MSCs;
this goal can be accomplished through time and cost reductions related to the ex vivo expansion of MSCs. Therefore, these find- ings suggest that the therapeutic value of MSCs for chronic liver disease will be high, even if a low cell dosage (i.e., 1×10⁷) can be demonstrated to improve liver function.
Most of the studies evaluated used bone marrow-derived MSCs (BM-MSCs; 10 autologous and 1 allogeneic), whereas 3 used allogeneic umbilical cord-derived MSCs (UC-MSCs). Par- ticularly, 4 allogeneic MSCs (1 BM-MSCs and 3 UC-MSCs) were transplanted into patients with ursodeoxycholic acid (UDCA)- resistant primary biliary cirrhosis (PBC), decompensated liver cirrhosis (LC) and acute-on-chronic liver failure (ACLF) (17-19, 21). Interestingly, allogeneic MSC infusion is clinically safe and is not associated with transplantation-related side effects and could improve liver function. These results suggest that MSCs can be readily applied in clinical studies as an “off-the-shelf”
drug.
However, based on the analyzed studies, few studies evaluat- ed histological changes and liver-related death or complications following MSC treatment. In addition, well-designed random- ized clinical trials were rare, and the study quality was moder- ate or poor.
MSCs have the potential to differentiate into hepatocytes, and therapeutic value exists in their immune-modulatory proper- ties and secretion of trophic factors, such as growth factors and cytokines. In addition, MSCs can suppress inflammatory re- sponses, reduce hepatocyte apoptosis, increase hepatocyte re- generation, regress liver fibrosis and enhance liver functional- ity. In spite of the wide usage of MSCs in clinical and pre-clini- cal studies of chronic liver disease (25-28), several issues must be carefully considered, including the low stemness and fibro- genic potential of MSCs, the best route of administration, the optimal therapeutic timing, the most effective number of cells and the optimal period or number of injections. The stemness of MSCs, which can be defined by their potential to proliferate and differentiate, gradually decreases during serial passages that are needed to obtain a sufficient cell number for clinical trials. Therefore, the regulation of stemness in MSCs is one of the important issues in the achievement of a maximum effect of stem cell therapy. Moreover, depending on the MSC injec- tion route and liver disease status, MSCs can differentiate into myofibroblasts rather than hepatocytes (29, 30). MSCs are rare- ly observed in normal and acutely injured livers compared with chronically injured livers, and a significant number of human MSCs exhibit a myofibroblast-like morphology in cases of acute liver injury (29). Baertschiger et al. (30) observed that stable en- graftment of MSCs in the liver was not achieved following intra-
splenic injection; however, after intrahepatic injection, MSCs permanently remained in the liver but primarily differentiated into myofibroblasts. Therefore, the MSC injection route and the optimal therapeutic timing according to liver disease status must be considered to reduce the fibrogenic potential of MSCs. Fur- thermore, the most effective number of cells and the optimal period or number of injections must be determined to improve the therapeutic effects of MSCs in clinical and pre-clinical stud- ies of chronic liver disease. Finally, biomarkers that do not cause cell damage and that are specific to the injected MSCs must be developed to validate the duration of survival and the fate of the engrafted MSCs, even if the development of such tools requires a long period of time.
Taken together, MSCs treatments are considered to be safe and may serve as a potential therapeutic supplementary tool to improve liver function in patients with chronic liver disease. How- ever, to obtain meaningful insights into the clinical efficacy of these cells, further robust clinical studies are needed to evalu- ate the effects of MSCs on clinical outcomes and histological improvement. In addition, pre-clinical and clinical studies are necessary to determine the best route of MSC delivery that would result in maximal treatment efficacy and the development of useful biomarkers.
DISCLOSURE
The authors do not have any disclosure to report.
AUTHOR CONTRIBUTION
Conceived and designed the experiments: Kim G, Baik SK. An- alyzed the data: Kim G, Shin Y, Lim YL, Kim MY, Kwon SO, Chang SJ. Contributed reagents/materials/analysis tools: Kim G, Baik SK, Shin Y, Chang SJ. Wrote the first draft of the manuscript: Kim G, Eom YW. Wrote the paper: Kim G, Eom YW, Baik SK. ICMJE criteria for authorship read and met: Kim G, Eom YW, Baik SK.
Agree with manuscript results and conclusions: Kim G, Eom YW, Baik SK, Kim MY, Kwon SO, Chang SJ.
ORCID
Gaeun Kim http://orcid.org/0000-0003-1914-8331 Young Woo Eom http://orcid.org/0000-0002-5985-6490 Soon Koo Baik http://orcid.org/0000-0001-6245-2537 Yeonghee Shin http://orcid.org/0000-0003-4735-6904 Yoo Li Lim http://orcid.org/0000-0001-9287-807X Moon Young Kim http://orcid.org/0000-0002-2501-2206 Sang Ok Kwon http://orcid.org/0000-0001-5050-570X Sei Jin Chang http://orcid.org/0000-0001-9347-3592
REFERENCES
1. Fallowfield JA, Iredale JP. Targeted treatments for cirrhosis. Expert Opin Ther Targets 2004; 8: 423-35.
2. Chamuleau RA, Deurholt T, Hoekstra R. Which are the right cells to be used in a bioartificial liver? Metab Brain Dis 2005; 20: 327-35.
3. Campagnoli C, Roberts IA, Kumar S, Bennett PR, Bellantuono I, Fisk NM. Identification of mesenchymal stem/progenitor cells in human first- trimester fetal blood, liver, and bone marrow. Blood 2001; 98: 2396-402.
4. Erices A, Conget P, Minguell JJ. Mesenchymal progenitor cells in human umbilical cord blood. Br J Haematol 2000; 109: 235-42.
5. Young HE, Steele TA, Bray RA, Hudson J, Floyd JA, Hawkins K, Thomas K, Austin T, Edwards C, Cuzzourt J, et al. Human reserve pluripotent mes- enchymal stem cells are present in the connective tissues of skeletal mus- cle and dermis derived from fetal, adult, and geriatric donors. Anat Rec 2001; 264: 51-62.
6. Kim G, Baik SK. Overview and recent trends of systematic reviews and meta-analyses in hepatology. Clin Mol Hepatol 2014; 20: 137-50.
7. Higgins J, Green S. Cochrane handbook for systematic reviews of inter- ventions. Version 5.1.0 updated March 2011. Available at http://hand- book.cochrane.org/ [accessed on 13 November 2014].
8. Moher D, Liberati A, Tetzlaff J, Altman DG; PRISMA Group. Preferred reporting items for systematic reviews and meta-analyses: the PRISMA statement. Ann Intern Med 2009; 151: 264-9, w64.
9. Scottish Intercollegiate Guidelines Network. Methodology checklist 2:
controlled trials. Available at http://www.sign.ac.uk/methodology/check- lists.html [accessed on 15 November 2014].
10. The Nordic Cochrane Centre. Review Manager (RevMan). Version 5.3 for Windows. Copenhagen: The Cochrane Collaboration, 2013.
11. Amin MA, Sabry D, Rashed LA, Aref WM, el-Ghobary MA, Farhan MS, Fouad HA, Youssef YA. Short-term evaluation of autologous transplan- tation of bone marrow-derived mesenchymal stem cells in patients with cirrhosis: Egyptian study. Clin Transplant 2013; 27: 607-12.
12. Jang YO, Kim YJ, Baik SK, Kim MY, Eom YW, Cho MY, Park HJ, Park SY, Kim BR, Kim JW, et al. Histological improvement following administra- tion of autologous bone marrow-derived mesenchymal stem cells for al- coholic cirrhosis: a pilot study. Liver Int 2014; 34: 33-41.
13. Kharaziha P, Hellström PM, Noorinayer B, Farzaneh F, Aghajani K, Ja- fari F, Telkabadi M, Atashi A, Honardoost M, Zali MR, et al. Improve- ment of liver function in liver cirrhosis patients after autologous mesen- chymal stem cell injection: a phase I-II clinical trial. Eur J Gastroenterol Hepatol 2009; 21: 1199-205.
14. Mohamadnejad M, Alimoghaddam K, Bagheri M, Ashrafi M, Abdol- lahzadeh L, Akhlaghpoor S, Bashtar M, Ghavamzadeh A, Malekzadeh R. Randomized placebo-controlled trial of mesenchymal stem cell trans- plantation in decompensated cirrhosis. Liver Int 2013; 33: 1490-6.
15. Mohamadnejad M, Alimoghaddam K, Mohyeddin-Bonab M, Bagheri M, Bashtar M, Ghanaati H, Baharvand H, Ghavamzadeh A, Malekza- deh R. Phase 1 trial of autologous bone marrow mesenchymal stem cell transplantation in patients with decompensated liver cirrhosis. Arch Iran Med 2007; 10: 459-66.
16. Salama H, Zekri AR, Medhat E, Al Alim SA, Ahmed OS, Bahnassy AA, Lotfy MM, Ahmed R, Musa S. Peripheral vein infusion of autologous mes- enchymal stem cells in Egyptian HCV-positive patients with end-stage