I. Introduction
The variation of demand, limited supply, and perishability of blood products results in a high degree of uncertainty and complexity in hemovigilance systems [1]. The effective management of blood products in this segment of the blood supply chain plays a crucial role in decreasing unneces- sary costs, wastage, and shortages [2]. One of the primary concerns of blood banks, as an essential part of the blood transfusion chain, is identifying and separating the system’s activities and components. Hence, user requirements should be recognized to organize the resources and functions that
Dynamic Demand-Centered Process-Oriented Data Model for Inventory Management of Hemovigilance Systems
Mahnaz Sohrabi1, Mostafa Zandieh2, Behrouz Afshar Nadjafi1
1Faculty of Industrial and Mechanical Engineering, Qazvin Branch, Islamic Azad University, Qazvin, Iran
2Department of Industrial Management and Information Technology, Management and Accounting Faculty, Shahid Beheshti University, Tehran, Iran
Objectives: This paper presents a reference data model for blood bank management to control blood inventories considering real-world uncertainties and constraints. It helps information systems identify blood product status for various critical deci- sions (such as replenishment, assignment, and issuing) instantly. Additionally, some significant optimization concepts of the inventory management literature for blood wastage and shortage reduction, such as clearance sale and substitution based on medical priorities, are applied in the model. Methods: The proposed model was constructed by object-oriented and ICAM (Integrated Computer Aided Manufacturing) definition ɸ (IDEF0) techniques for function modeling. Through semi-struc- tured questionnaires and interviews, the research team elicited and classified user requirements. Then, the demand-centered sub-processes and comprehensive functions were mapped to manage the process. Results: The model captures and integrates the top-level features of the inventory system entities. It also provides insights into a developed data dictionary to understand the system’s elements and attributes, where a data item fits in the structure, and what values it may contain. For designing the system’s process and following-up data, the main relevant inputs are considered. Conclusions: A flexible and applicable de- mand-centered framework for managing a typical blood bank’s inventory process was developed by focusing on user require- ments. The proposed model can be applied to design and monitor inventory information and decision-support systems. The model provides real-time iterative dynamic process insights. It can also provide the data needed for logistic planning systems and the design of blood operational infrastructure.
Keywords: Blood Bank, Hospital Information System, Hospital Inventory, Process Assessment Health Care, System Analysis
Healthc Inform Res. 2021 January;27(1):73-81.
https://doi.org/10.4258/hir.2021.27.1.73 pISSN 2093-3681 • eISSN 2093-369X
Submitted: May 14, 2020 Revised: October 28, 2020 Accepted: January 19, 2021 Corresponding Author Mostafa Zandieh
Department of Industrial Management and Information Technology, Management and Accounting Faculty, Shahid Beheshti University, Shahid Shahriari Square, Daneshjou Boulevard, Tehran 1983963113, Iran. Tel: +98-9123588698, E-mail: [email protected] (https://
orcid.org/0000-0003-1209-9514)
This is an Open Access article distributed under the terms of the Creative Com- mons Attribution Non-Commercial License (http://creativecommons.org/licenses/by- nc/4.0/) which permits unrestricted non-commercial use, distribution, and reproduc- tion in any medium, provided the original work is properly cited.
ⓒ 2021 The Korean Society of Medical Informatics
must be applied in the system [3,4].
During the last decade, data follow-up has played a crucial role in successful process improvement. It has aided the de- livery of more effective and responsive services [5]. Process modeling is a crucial aspect of designing information sys- tems (ISs) [6,7]. It describes and identifies the sorts of pro- cesses/sub-processes that should be targeted in implement-
ing the system and what kind of data should be followed-up [8-10]. Several studies have discussed healthcare processes considering managerial problems [11-13]. However, few of them have focused on developing blood management opti- mization [4,14].
In this study, we conducted a process-oriented analysis of blood bank inventory management systems. The main ob-
[Is there any demand for this inventory?]
[Has the transshipment thresholds been reached?]
Update expiration date, dispose wastage and
count stock-on-hand
Demand forecast
Replenishment
Deliver order
Shortage Lost demand
Transship surplus stock
[All demands satisfied?]
[Has the physician asked for alternative supplies?]
[Is the any substitutable inventory?]
Emergency
Send an alternative product request Assign and issue
[No]
[No] [Yes]
[Yes]
[Yes]
[No]
[No]
[Yes]
[No]
[Yes]
Figure 1. Activity diagram of the overall process of the hospital blood bank inventory system.
Steps of a process
The inventory management process is demand-oriented
Measure of parameters
Actors
Current documents/data
Emergency record
Shortage record
Wastage record
Replenishment policy
Activity constraints
& rules
Generated documents
Demand trend
Final approval
form
Order Delivery form
Conformity check list
Indicators
Inventory manager
Inventory control expert
Physician Nurse Driver..
index 1 Index 2 Index 3 ...
Key:
Completed Partially completed
Not completed Receiving
demand
Ordering
Delivering
Predictable
Emergency
Stock on hand
Safety stock
Lead time
Conformity
Final approval
Updating on-hand stock Discard expired items
Stock-out-based substitution Unsatisfied demand Conformity between ordered
item and delivered one
No Yes
No Yes
No Yes
No Yes
No Yes
Transshipment threshold
!
Figure 2. Elements of the system.
jective was to improve the existing procedures and integrate them by proposing a reference process model as a practical infrastructure for an IS and provide a context for decision support system design. This study developed an applicable demand-centered reference model framework. A data dic- tionary was abstracted for designing the clinical information system module considering user requirements by process data modeling in a real case. The proposed model includes a method that shows how the structure can be composed of a repository of building blocks based on a real case.
II. Case Description
1. Study Design
This investigation was based on a case study of a tertiary referral cardiac hospital in Tehran City. The hospital is sub- specialized in cardiac care and is one of the largest cardiac hospitals in Asia. The hospital’s blood bank management team is responsible for policy-making, planning, and order- ing the inventory of blood products required by the hospi- tal’s various departments for the central blood bank. The
Inv. Expert Updating stock
on hand
Blood product units
Inventory report at the end of each period
Inventory counting
Discard wastage
Disposal recipe
Wasted units quantity
Inv. Manager Nurse Doctor
Forecasting demand
Requisition history
Final approval
Emergency record
Seasonal trend
Matching with on hand inventory
Procedure guideline
Accuracy of forecast
Order
Blood product units
Replenishment policy
Storage space
Supply capacity
Determining order quantity
Check list/form
Procedure guideline
Appropriateness of orders
Priority instruction
CBB Expert Driver Inv. Expert
Delivering
Confirmity check
Storage units
Check list/form
Banking guideline
Updating inventory record
Received units adoption
Assigning & issuing
Assigning policy
Issuing policy
Protection levels policy
Assigning &
issuing stocks to demands
Substitution priority prescription
Patient history
Physician prescription
Stock-out-based substitution
Lost demand
Transshipment
Updated inventory record
Transshipment threshold
Determining of transferable
items
Transshipment contract
Procedure guideline
Transshipped units quantity Inv. Manager
Blood product units
Inv. Expert Doctor Inv. Manager
Blood product units
Blood product units
Check list/form Requisition form
Driver Inv. Expert Inv. Manager
Inv. Expert
Updating stock on hand
Blood product units Inventory
counting Inventory report
at the end of each period
Disposal
recipe Blood product
age Human resource
actor
Main step
of the process Resource: document Activity Guidelines:
prompted help Index Resource: material
Legend: types of a process component
Figure 3. The main steps of the blood inventory management process at the hospital blood bank and their components.
products under study are blood-derived products with ABO/
Rh blood group types.
The inventories have finite lifetimes with age-differentiated demand. The system serves various hospital departments, where storage space is limited.
The main challenge is to hold enough stock to prevent the loss of life due to shortages with minimum expiration. De- mands can be satisfied with the same or a substitutable blood type using predefined assignment and issuance policies and medical priority instructions. Shortages are not allowed and are considered as losses. In emergency conditions, demands can be satisfied through an expedited service. A clearance sale occurs for any nearly outdated units that have not been transfused at the end of each period to reduce the number of wasted units.
2. Methods
The methodology applied in this research is organized into the following three main steps:
• Identification, analysis, and representation of the blood bank’s general inventory management process and depict- ing its main components. The weaknesses of the current system in meeting user requirements are identified in this step. This step is conducted through observation and interviewing of members involved in blood transfusion at the central blood bank and the hospital blood bank. In our case study, 10 participants were selected by sampling
to achieve representativeness or comparability through the typical case sampling method [15];
• Describing, separating, and organizing the activities and sub-processes’ elements. This step is conducted through a partnership of the hemovigilance quality-improvement working groups (consist of the selected blood bank staff, nurses, and doctors). In our case study, for this purpose, a semi-questionnaire was prepared to be answered by the participants. The obtained data is analyzed by using the ICAM (Integrated Computer Aided Manufacturing) definition ɸ (IDEF0) technique [16,17]. The structured analysis of the documents consists of the object’s type, and explanation of its attributes and related methods are conducted in this step;
• Proposing an accessible object-oriented design for a typi- cal blood bank’s inventory management process consider- ing user requirements and information collected during the previous steps. This step is conducted through object- oriented programming [18] using unified modeling lan- guage (UML) [19,20].
3. Results
The implementation results of each step described in the previous section are reported below. A data dictionary was developed to discover process data items.
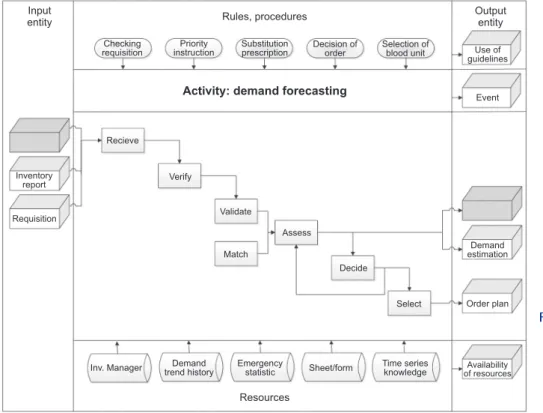
Figure 4. The Structured Analysis and Design Technique (SADT)
“ICOM box” of the demand forecasting step containing components and middle en- tities.
Input
entity Rules, procedures
Activity: demand forecasting
Output entity
Resources Inventory
report
Requisition
Recieve
Verify
Validate
Match
Assess
Decide
Select
Demand estimation
Order plan
Inv. Manager Demand trend history
Emergency
statistic Sheet/form Time series
knowledge Availability of resources Checking
requisition
Priority
instruction Substitution prescription
Decision of order
Selection of
blood unit Use of
guidelines
Event
Demand-centered and process-oriented clinical data repository
Updating on hand inventory (s blood products units)
Determining uncertain transferable
units Discard wastage
Requisition of blood products units
(m units)
Final approve?
Delayed Canceled
Matching with on hand inventory
Considering priority
Demand estimation
Considering uncertain emergency
Order
Storage constraint
Order plan
Replenishment
Unit 1
Unit 2
Unit n
Unit x Delivering
Delivered
Undelivered Canceled
Delayed Unit ID number
Conformable
Not conformable
Banking units
Assigning & issuance inventories to demand
Satisfying demand according to priority
Satisfied? Stock-out-based substitution Shortage?
Unit ID number (issued) Lost demand
Transshipment units to supplier or other hospitals
Determining certain transferrable units
Transshipping blood products units
Unit ID number (transshipped) M
D, E E
P, M M
M, E
E E E
E
C
C D, E
D, E
No No
Unit 1
Unit 2 M M
E
M M E No
Yes P
P
P
Forecasting demand
P, N
Unit ID number (available &
transferable) E
E E
T E T T
Yes
Demand-centered and process-oriented clinical data repository
T T
T T T
T
Abbreviation
M: Inventory manager E: Inventory control expert P: Physician N: Nurse D: Driver C: central blood bank expert
Yes
E
Figure 5. Data flow diagram of the hospital blood bank inventory management system and the background of tracking of the process into the demand-centered clinical data repository.
Table 1. Identification of the HBBIM-IS requirements
Aspect Rules
Users System actors specify the user category
Functions Activities or sub-processes describe user functions
Resource documents Resource documents consist of data units used to outline the resource materials and their attributes HBBIM: blood bank inventory management process, IS: information system.
Table 2. Related attributes of the prescription step of blood transfusion deduced from the analysis of the process
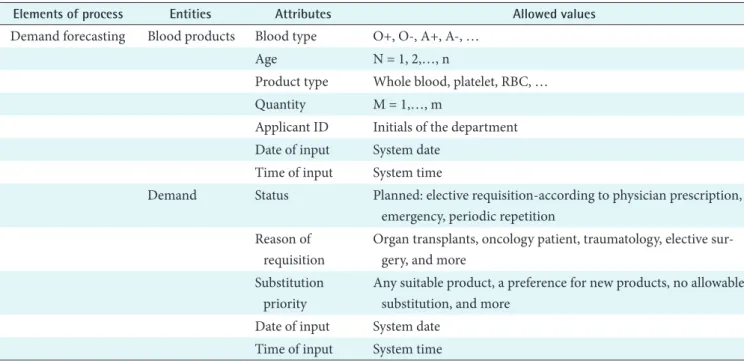
Elements of process Entities Attributes Allowed values
Demand forecasting Blood products Blood type O+, O-, A+, A-, …
Age N = 1, 2,…, n
Product type Whole blood, platelet, RBC, …
Quantity M = 1,…, m
Applicant ID Initials of the department Date of input System date
Time of input System time
Demand Status Planned: elective requisition-according to physician prescription, emergency, periodic repetition
Reason of requisition
Organ transplants, oncology patient, traumatology, elective sur- gery, and more
Substitution priority
Any suitable product, a preference for new products, no allowable substitution, and more
Date of input System date Time of input System time RBC: red blood cell count.
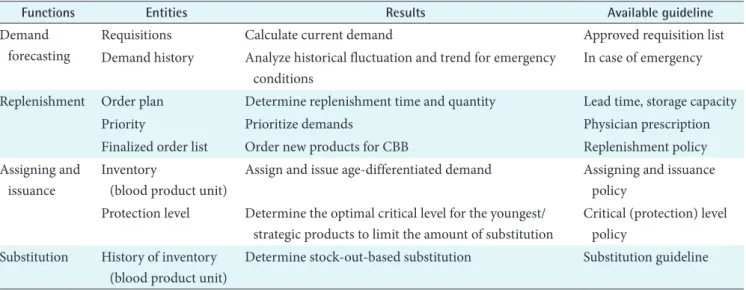
Table 3. Profile of the HBB inventory manager focusing on main related functions
Functions Entities Results Available guideline
Demand forecasting
Requisitions Calculate current demand Approved requisition list
Demand history Analyze historical fluctuation and trend for emergency conditions
In case of emergency
Replenishment Order plan Determine replenishment time and quantity Lead time, storage capacity
Priority Prioritize demands Physician prescription
Finalized order list Order new products for CBB Replenishment policy Assigning and
issuance
Inventory
(blood product unit)
Assign and issue age-differentiated demand Assigning and issuance policy
Protection level Determine the optimal critical level for the youngest/
strategic products to limit the amount of substitution
Critical (protection) level policy
Substitution History of inventory (blood product unit)
Determine stock-out-based substitution Substitution guideline HBB: hospital blood bank, CBB: central blood bank.
Wastage report Conformity check report
Uncertain demand calculated based on approved requisitions
and emergency statistics
Inventory history
Stock on hand (according to blood product type, age) Safety stock Transferable stock
Updating
The beginning of the current day Discarding expired units
report Demand history
Uncertain demand records Approved requisition Emergency
/unplanned demand records Prior demand Registered
requisition record for current day Knowledge of these data authorizes the forcasting
Inventory history
Stock on hand (according to blood product type, age) Safety stock Transferable stock
Received units quantity form CBB
Order history Sent order to CBB Planned order
Damaged units Conformity check
of delivered units Banking guideline
Damaged units record Replenishment
policy
Assigning &
issuance policy Protection
level policy
Order history Planned order Sent order to
CBB
Substitution priority prescription
Receipt Acceptance
of new supply
Date, type, age, unit x#
Order Blood products unit order
Order to central blood bank will take place with consideration of protection level and storage
constraint
Type, age
The end of the current day Date, type, age, unit x#
Assigning & issuance policy enables demand satisfaction
Automatic updating of the inventory level record after each receive/release phase
Date, type, age, unit x#
Date, type, age, unit x#
Assigning
& issuance Assigning
& issuance Assigning
& issuance
Demand history
Approved requisition Uncertain predicted demand
records Emergency/unplanned
demand statistic Prior demand Refistered requisition record
for current day Dertain demand received
record Datisfied demand Substitute damand Los t demand
Inventory history
Stock on hand (according to blood product type, age) Safety stock Transferable stock Received units quantity
from CBB Consumed stock
Transshipped stock
Transshipped units report
Inventory history Stock on hand
(according to blood product type, age) Safety stock Transferable stock Received nits quantity
from CBB Consumend stock
Stocks with near expiration date which have reached the threshold would transship to CBB or other hospitals
Date, type, age, unit x#
Restore &
transshipment
Actual (certain) demand report Shortage report
Substitution report
Satisfied demand record
t1 t2 t3 t4 t5 t6 t7
Real- time iterative data input
Figure 6. Integrated steps of the hospital blood bank inventory management process with time sequence shows the dynamics of the information systems.
1) Implementation results
(1) Identification, analyzing, and representation of the general process: An overall activity diagram of the blood bank inventory management process is presented in Figure 1.
Every object’s behavior connected with activity responses to a series of events in the system is examined. The Structured Analysis and Design Technique (SADT) “ICOM box” ex- tracts the details of each activity. The blood bank system has a dynamic interface with various kinds of events that change the status of the system components.
(2) Describing, separating, and organizing the activi- ties and sub-processes’ elements: As seen in Figure 2, the already defined elements consist of the following analytic quality items:
1. A set of activities at each step of inventory management considering the processing time;
2. A set of agents involved with the system at each step;
3. A set of data (such as predicted requisition, an average of planned surgeries per day, records of patients who are consistently injected) to be retrieved from the history of demands, orders, and inventory to present to the agents;
4. A set of parameters to be adjusted at each step;
5. A set of recommendations, notifications, and alarms to be considered by the actors;
6. A set of data/documents generated throughout the sys- tem, which should be exchanged, transferred, and con- verted among the activities;
7. A set of activity indicators related to the parameters, which should be calculated and perused to identify trends and evaluate the system’s performance.
(3) Proposing an accessible object-oriented design: The core of the blood bank inventory management process in- cludes a sequence of six sub-processes (steps), which are mapped in Figure 3. For instance, the details of a step of the process consist of an activity’s components displayed by the SADT “ICOM box” scheme as shown in Figure 4. The data generated and exchanged follow the sequence, illustrated in Figure 5, of the blood bank’s process steps. The actors’ roles in fulfilling their responsibilities are described in detail.
The system’s requirements are identified through aspects of the users, their function, and documents, as shown in Table 1. As seen in Figure 3, the appropriate indicators for various blood inventory process steps are calculated from data stored in the process steps. For instance, the characteristics of an
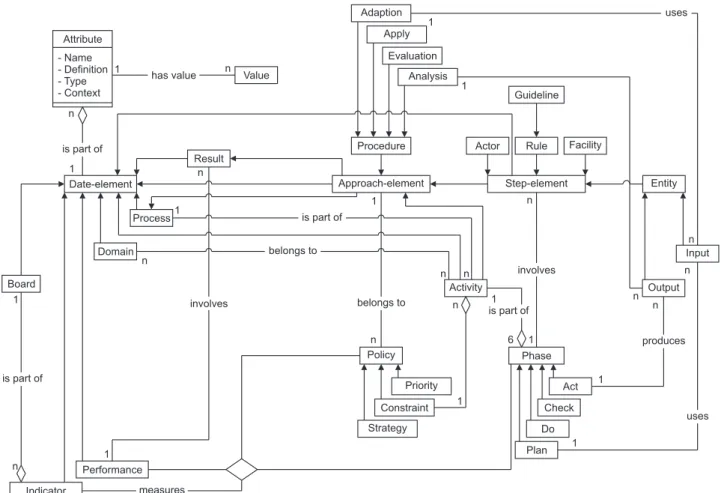
Figure 7. Object-oriented diagram of a process data model.
n 1 Attribute - Name - Definition - Type - Context
Date-element
Domain Process
Result Value
Indicator
Performance
Adaption Apply
Evaluation Analysis
Procedure
Approach-element
Policy
Priority Constraint Strategy
Guideline
Actor Rule Facility
Step-element
Phase
Act Check Do Plan
Entity
Input
Output Activity
has value
is part of
belongs to
uses produces
measures 1
n
n 1
n
1
involves
1 1
1 is part of
belongs to
n
1
1 1 1
6 n 1
n n
is part of involves
n n
n
n uses
n
Board 1
n is part of
element of the process (i.e., demand forecasting) are detailed in Table 2, including their entities, attributes, and allowance.
Regarding the involvement of the actors within the process, the related functions of the users are defined. For instance, the inventory manager’s profile is presented in Table 3. The users’ actions are integrated through the implementation of process steps. Figure 6 shows the dynamic IS actions chron- ologically as well as the data components that are generated, refined, modified, and exchanged within the system. A time and process-oriented analysis of the actions’ purpose and the merged process steps is provided.
2) Data dictionary
A data dictionary was developed from a top-level perspec- tive to understand where a data item fits in the structure, what values it may contain, and basically what its elements and attributes are in real-world terms. Figure 7 illustrates an abstract model of various entities and the characteristics of their relationships within the process.
(1) Step element: This element is associated with sub- processes and activities’ components and is extracted from the SADT “ICOM box” scheme. It includes the interactions between the process and the inputs and outputs that tie the process’ activities together.
(2) Approach element: The plan-do-check-act (PDCA) cy- cle and risk-based thinking push an organization to plan and make up its processes and interactions. This element ensures that the process is adequately resourced and managed, and opportunities for improvement are determined and acted on as well.
(3) Data element: The fundamental data structure in a data processing system consists of the logical definitions of the data units and the specific ranges of values discovered within the system. This element describes the step element and measures its related indicators and performance.
III. Discussion
Many studies have explored various aspects of techniques, process-based questions, and case studies applied to health- care process mining. In this regard, some process-based approaches have been recently adapted for blood inventory analysis [14,20]. The majority of the state-of-the-art process models search for complete, so-called “start-to-end” process- es. However, in highly dynamic and flexible settings, such as the one this study addresses, they fail to achieve appropriate results or appear to have limited effectiveness. This paper adds basic knowledge for efficiently improving blood bank-
ing quality and bridging existing models’ gaps by considering user requirements and real-time iterative dynamic processes.
It is recommended to apply a compatible mathematical op- timization model to the proposed model to provide optimal decisions. The presented model is also beneficial for design- ing the back-end of decision-support systems in practice.
Conflict of Interest
No potential conflict of interest relevant to this article was reported.
ORCID
Mahnaz Sohrabi (https://orcid.org/0000-0002-3037-6418) Mostafa Zandieh (https://orcid.org/0000-0003-1209-9514) Behrouz Afshar Nadjafi (https://orcid.org/0000-0002-3391-8411)
References
1. Hosseini-Motlagh SM, Samani MR, Homaei S.
Blood supply chain management: robust optimiza- tion, disruption risk, and blood group compatibility (a real-life case). J Ambient Intell Humaniz Com- put 2020:11(3):1085-104.
2. Haeri A, Hosseini‐Motlagh SM, Ghatreh Samani MR, Rezaei M. A mixed resilient‐efficient approach toward blood supply chain network design. Int Trans Oper Res 2020;27(4):1962-2001.
3. Jensen HG. IT in Blood banks, at present and tomor- row: a Nordic perspective. ISBT Sci Ser 2020;15(1):52-8.
4. Staccini P, Joubert M, Quaranta JF, Fieschi D, Fieschi M. Modelling health care processes for eliciting user re- quirements: a way to link a quality paradigm and clini- cal information system design. Int J Med Inform 2001;
64(2-3):129-42.
5. Miah SJ, Hasan N, Gammack J. Follow-up decision sup- port tool for public healthcare: a design research per- spective. Healthc Inform Res 2019;25(4):313-23.
6. Sligo J, Gauld R, Roberts V, Villa L. A literature review for large-scale health information system project plan- ning, implementation and evaluation. Int J Med Inform 2017;97:86-97.
7. Goossen WT. Detailed clinical models: representing knowledge, data and semantics in healthcare informa- tion technology. Healthc Inform Res 2014;20(3):163-72.
8. Kwon IH. Book Review: Process mining: discovery, conformance and enhancement of business process-
es. Healthc Inform Res 2014;20(2):157-8.
9. Pakdil F, Harwood TN, Isin FB. Implementing lean principles in the healthcare industry: a theoretical and practical overview. In: Wickramasinghe N, Bodendorf F, editors. Delivering superior health and wellness Man- agement with IoT and analytics. Cham, Switzerland:
Springer; 2020. p. 383-413.
10. dos Santos Garcia C, Meincheim A, Junior ER, Dalla- gassa MR, Sato DM, Carvalho DR, et al. Process min- ing techniques and applications: a systematic mapping study. Expert Syst Appl 2019;133:260-95.
11. Kim E, Kim S, Song M, Kim S, Yoo D, Hwang H, et al.
Discovery of outpatient care process of a tertiary univer- sity hospital using process mining. Healthc Inform Res 2013;19(1):42-9.
12. Pereira Detro S, Santos EA, Panetto H, Loures ED, Lezoche M, Cabral Moro Barra C. Applying process mining and semantic reasoning for process model customisation in healthcare. Enterp Inf Syst 2020;14(7):983-1009.
13. Quinn JG, Conrad DM, Cheng CK. Process mining is an underutilized clinical research tool in transfusion medicine. Transfusion 2017;57(3):501-3.
14. Farrugia B. WASP (write a scientific paper): Sampling in qualitative research. Early Hum Dev 2019;133:69-71.
15. Baghbani M. IDEF0 Modeling Standard: a tool for process map drawing under requirements of ISO 9001:
2015: a case study. J Mod Process Manuf Prod 2019;8(4):
57-66.
16. Walker AE, Grimshaw J, Johnston M, Pitts N, Steen N, Eccles M. PRIME: Process modelling in ImpleMEnta- tion research: selecting a theoretical basis for interven- tions to change clinical practice. BMC Health Serv Res 2003;3(1):22.
17. Blaschek G. Object-oriented programming: with pro- totypes. New York (NY): Springer Science & Business Media; 2012.
18. Ayatollahi H, Hosseini SF, Hemmat M. Integrating ge- netic data into electronic health records: medical geneti- cists’ perspectives. Healthc Inform Res 2019;25(4):289- 96.
19. Priestley M. Practical object-oriented design with UML.
Boston (MA): McGraw-Hill; 2003.
20. Cheng C, Kumar-Misir A, Watson S, Macleod J, Sadek I.
Evaluation of the real-world impact of the process min- ing methodology on a quality assurance process for auditing red blood cell inventory: two case studies. Can J Pathol 2017;9 Suppl:28-9.