https://doi.org/10.5624/isd.2019.49.4.257
Introduction
The emerging practicality of digital modeling has prom
p ted ongoing research into the accuracy of the technique.
Analyses using models must be accurate to ensure proper diagnosis and treatment planning. Therefore, many stud
ies have evaluated the precision of tooth measurements made using digital models and reported that digital mod
els appear to be clinically acceptable and reproducible for making orthodontic diagnoses, similar to conventional models.14 In recent years, digital models have been ap
plied to simulate virtual tooth alignment and to fabricate orthodontic appliances such as clear aligners and indirect bonding trays using 3dimensional(3D) printers.5 Howev
er, problems with the suitability of appliances can emerge if the accuracy of these models is lower than that of the plaster models conventionally used to manufacture appli
ances.
An alternative method is to construct a digital model using conebeam computed tomography(CBCT), which is a volume scanning method that can acquire data quick
ly without being influenced by the shape of the subject
Three-dimensional comparison of 2 digital models obtained from cone-beam computed tomographic scans of polyvinyl siloxane impressions and plaster models
JinYi Park 1, Dasomi Kim 1, SangSun Han 2,*, HyungSeog Yu 3, JungYul Cha 3,*
1Department of Orthodontics, College of Dentistry, Yonsei University, Seoul, Korea
2Department of Oral and Maxillofacial Radiology, College of Dentistry, Yonsei University, Seoul, Korea
3Department of Orthodontics, Institute of Craniofacial Deformity, College of Dentistry, Yonsei University, Seoul, Korea
AbsTrAcT
Purpose: This study was performed to evaluate the dimensional accuracy of digital dental models constructed from conebeam computed tomographic(CBCT) scans of polyvinyl siloxane(PVS) impressions and cast scan models.
Materials and Methods: A pair of PVS impressions was obtained from 20 subjects and scanned using CBCT (resolution, 0.1mm). A cast scan model was constructed by scanning the gypsum model using a model scanner.
After reconstruction of the digital models, the mesiodistal width of each tooth, intercanine width, and intermolar width were measured, and the Bolton ratios were calculated and compared. The 2 models were superimposed and the difference between the models was measured using 3dimensional analysis.
results: The range of mean error between the cast scan model and the CBCT scan model was -0.15mm to 0.13 mm in the mesiodistal width of the teeth and 0.03mm to 0.42mm in the width analysis. The differences in the Bolton ratios between the cast scan models and CBCT scan models were 0.87(anterior ratio) and 0.72(overall ratio), with no significant difference(P>0.05). The mean maxillary and mandibular difference when the cast scan model and the CBCT scan model were superimposed was 53μm.
conclusion: There was no statistically significant difference in most of the measurements. The maximum tooth size difference was 0.15mm, and the average difference in model overlap was 53μm. Digital models produced by scanning impressions at a high resolution using CBCT can be used in clinical practice.(Imaging Sci Dent 2019; 49: 257-63) Key words: ConeBeam Computed Tomography; Orthodontics; Dental Models
Copyright ⓒ 2019 by Korean Academy of Oral and Maxillofacial Radiology
This is an Open Access article distributed under the terms of the Creative Commons Attribution NonCommercial License(http://creativecommons.org/licenses/bync/3.0) which permits unrestricted noncommercial use, distribution, and reproduction in any medium, provided the original work is properly cited.
Imaging Science in Dentistry·pISSN 22337822 eISSN 22337830
*The study was based on work supported by the Ministry of Trade, Industry & Energy (MOTIE, Korea) under the Advanced Technology Center Program. No.10062362,
‘The development of dental and medical prosthetics modeling, rapid fabrication and integrated trading system based and converged on CBCT image, using Cloud networking.’
Received June 26, 2019; Revised August 19, 2019; Accepted August 30, 2019
*Correspondence to : Prof. SangSun Han
Department of Oral and Maxillofacial Radiology, College of Dentistry, Yonsei University, 501 Yonseiro, Seodaemungu, Seoul 03722, Korea
Tel) 82222288843, Email) [email protected] Prof. JungYul Cha
Department of Orthodontics, College of Dentistry, Yonsei University, 501 Yonsei
ro, Seodaemungu, Seoul 03722, Korea Tel) 82222283103, Email) [email protected]
around the area of undercut and proximal contact.6 In re
cent years, CBCT has been more frequently used, and the resolution of CBCT has improved to 0.070.1mm for 3D analysis and diagnosis of the maxillofacial region.7 Thus, digital model fabrication using scans of patient impres
sions obtained with CBCT in a dental office is a way to create a model without the aid of an intraoral scanner or a special model scanner, and without directly irradiating the patient. If necessary, digital models and plaster models can be fabricated using a single impression.8
In previous studies, the dimensional accuracy of dig
ital models obtained from CBCT scans of alginate im
pressions was examined according to the elapsed time.8,9 However, no published study has evaluated the dimen
sional accuracy of digital models obtained using CBCT.
Therefore, there is a lack of studies investigating the ac
curacy of digital models produced using CBCT, and the width of individual teeth and the entire arch obtained us
ing a digital model must be validated.
The purpose of this study was to evaluate the accuracy of measurements of the total dental arch by comparing the total arch geometry and tooth size in plaster models with scanned digital models constructed from CBCT scans of polyvinyl siloxane(PVS) impressions.
Materials and Methods
The subjects were 20 patients(5 men, 15 women; mean age, 23.8years) who visited the Department of Ortho
dontics, College of Dentistry, Yonsei University. All sub
jects provided informed written consent. The study was approved by the University’s Institutional Review Board Ethics Committee(IRB CRNo:220160021). All subjects fulfilled the following criteria: complete permanent den
tition from first molar to first molar; no fixed orthodontic treatment history; and <6mm of crowding. Patients with a history of orthognathic surgery, missing teeth, or mixed dentition were excluded.
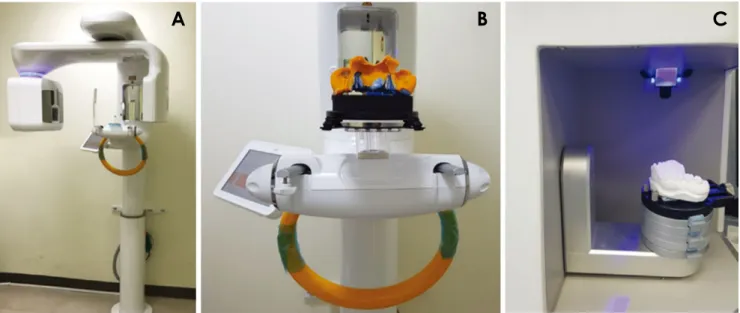
A pair of impressions was made using a plastic tray and PVS in each patient. Within 1 hour after taking the impression, the impression was scanned using CBCT (Rayscan α+, Ray Co., Ltd., Seongnam, Korea) with the following imaging parameters: a spatial resolution of 100 μm, 14.0seconds, 70kVp, and 16mA(Figs. 1A and B).
Cast models were fabricated using standard methods by pouring plaster(Rhombstone White; Ryoka Dental, Mie, Japan). Each plaster cast was scanned using a bluelight
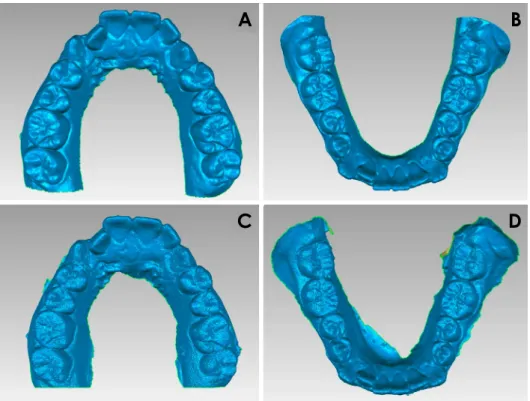
emitting diode model scanner with ±7μm precision (Identica Hybrid; Medit Co, Seoul, Korea, Fig. 1C) and a digital model of the cast was obtained(Figs. 2A and B).
The obtained CBCT data were also converted into stereo
lithography(STL) files using the RayDent converter pro
gram(Ray Co., Ltd., Seongnam, Korea) and stored(Figs.
2C and D). Linear values of the digital models were mea
sured using reverse engineering software(Geomagic Con
trol 2015; 3D Systems, Rock Hill, SC, USA) and saved to an accuracy of 1/100mm.
Tooth width was measured at the greatest width in the
Fig. 1. The conebeam computed tomography(CBCT) equipment and model scanner used in this study. A. CBCT equipment(Rayscan α+;
Ray Co., Ltd., Seongnam, Korea). B. CBCT scanning of a polyvinyl siloxane impression. C. Fabrication of a digital model from a model scanner(Identica Hybrid; Medit Co, Seoul, Korea).
A B C
occlusal view for the posterior teeth and the labial view for the anterior teeth(Figs. 3A and B). Before making the measurements, it was confirmed that the line between the 2 measuring points was parallel to the central groove and perpendicular to the axis of the crown when measuring the posterior teeth. It was confirmed that the line between
the 2 measuring points was perpendicular to the axis and that both measuring points were in the middle of the la
biolingual distance on the incisal view(Fig. 3C). If this was not the case, the measurement was repeated(Table 1).
Arch width was defined as the distance between the central fossae of both first molars and between the tips of
A B
C D
Fig. 2. Threedimensional digital models of the plaster casts were ob
tained using a model scanner(A and B) and conebeam computed tomog
raphy(C and D), respectively.
A B
C D
Fig. 3. Linear measurements of tooth width(A, B, and C), and arch width(D) were made on the digital models.
the cusp of the canines. The anterior and overall Bolton ratios were calculated for each model(Fig. 3D). Two examiners working independently repeated all measure
ments twice 23 weeks later.
To compare the cast scan model and the CBCT scan model of each participant, the 2 models were superim
posed using the bestfit method using reverse engineering software, and a 3D comparative analysis was performed to ascertain differences between the 2 models using the near
estneighbor method. The distance from 50,000 to 70,000 points was measured according to the resolution. The abso
lute value of 5% to 95% of the deviation values, excluding the 5% upper and lower values, was statistically processed.
Intraclass correlation coefficients(ICCs) were calculated to confirm reproducibility, after which the ShapiroWilk test was used to test the normality of the distribution of data for differences between the cast scan model and the CBCT scan model. Once a normal distribution was con
firmed, each measured value was divided into upper and lower parts using the paired ttest. The anterior Bolton ra
tio and overall ratio were compared using the paired ttest.
Differences in the digital model overlays according to the scanning method are reported as descriptive statistics(me
dian, mean, standard deviation [SD], maximum [max], minimum [min]). All statistical analyses were performed using SPSS version 23(IBM Corp., Armonk, NY, USA).
results
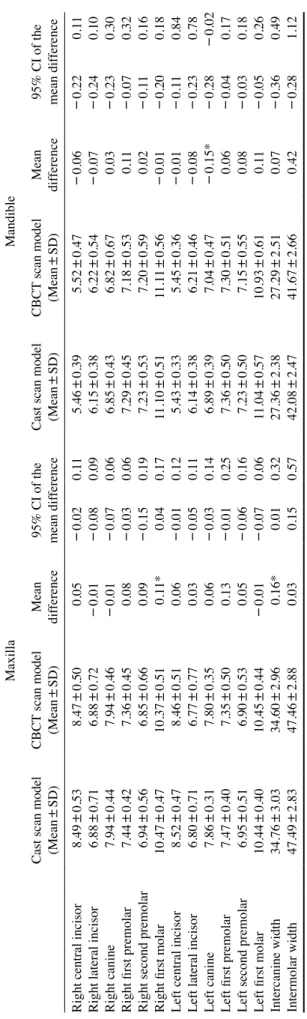
The range of ICC values for the two observers(0.987
0.999) indicated that the measurements were reliable. The differences in the measurements of the cast scan models ranged from -0.15mm to 0.16mm for the CBCT scan models. Statistically significant differences between the maxillary cast scan models and the CBCT scan models were found for the right first molar(P<0.05) and interca
nine width(P<0.05). For the mandibular models, a statis
tically significant difference was found for the left canine (P<0.05) between the cast scan models and the CBCT scan models; however, no difference exceeded 0.2mm(Ta
ble 2).
The differences in the Bolton ratio between the cast scan models and CBCT scan models were -0.87mm for the anterior Bolton ratio and -0.72 for the overall Bolton ra
tio. The anterior and overall Bolton ratios of the cast scan models were smaller than those of the CBCT scan models;
however, the difference was not statistically significant(Ta
ble 3).
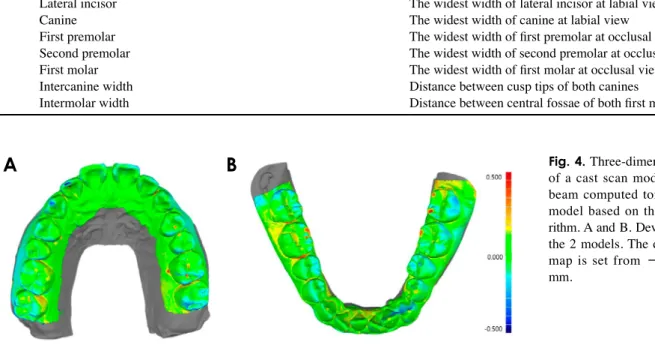
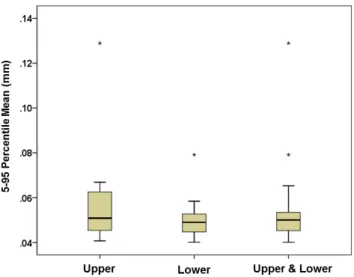
Based on the analysis of superimposed models, a signif
icant difference was found between the interproximal area and the cusp of the tooth in the maxillary canines and the mandibular first and second molars(Fig. 4). A quantitative analysis of the superimposed models revealed average dif
Table 1. Linear measurements used in this study
Site Definition
Central incisor The widest width of central incisor at labial view
Lateral incisor The widest width of lateral incisor at labial view
Canine The widest width of canine at labial view
First premolar The widest width of first premolar at occlusal view
Second premolar The widest width of second premolar at occlusal view
First molar The widest width of first molar at occlusal view
Intercanine width Distance between cusp tips of both canines
Intermolar width Distance between central fossae of both first molars
Fig. 4. Threedimensional analysis of a cast scan model and a cone
beam computed tomography scan model based on the bestfit algo
rithm. A and B. Deviations between the 2 models. The difference color map is set from -0.5mm to 0.5 mm.
A B
ferences of 56μm at the maxilla, 50μm at the mandible, and 53μm at the maxillary and mandibular arches(Fig. 5).
discussion
There was a significant difference between the cast scan models and the CBCT scan models in the mesiodistal width of the maxillary right first molar and mandibular left canine, as well as in the maxillary intercanine width.
However, inconsistent results have been reported in previ
ous studies regarding discrepancies in tooth size between plaster and digital models.6,10 Such discrepancies can result from variety in teeth alignment patterns, as well as varia
tion in tooth anatomy and the direction of visual inspec
tion. In many studies comparing plaster and digital models, differences in tooth width measurements of <0.20mm to 0.27mm relative to manual measurements have been con
sidered clinically acceptable.1,4,1113 In this study, the mean difference in tooth width was within 0.15mm, which was clinically acceptable.
In the present study, the differences between the 2 mod
els for the anterior and overall Bolton ratios were 0.87 and 0.72, respectively; however, these differences were not statistically significant. In a previous study, plaster models, CBCT scan models, and intraoral scan models demonstrat
ed differences in the anterior and overall Bolton ratios of 0.98 and 0.82, respectively.10 In this study, similar differ
ences were found. It is believed that the error in the Bolton ratio was larger than its magnitude for individual teeth be
cause it is calculated from the sum of many tooth widths.
Extreme discrepancies were excluded from the evalu
ation of arch distortion(s) and dimensional discrepancies of the cast scan and CBCT scan models. During impres
siontaking and modelmaking, bubbles can be generat
ed, which lead to errors, and a significant deviation was observed in the optimal superposition of the 2 models. To compensate for this error, the average of the remaining val
ues, except for the upper and lower 5% deviation values, was calculated to yield an average difference of 53μm. In a previous study, the 10% upper and lower deviation values were excluded.14 In contrast, by excluding only the upper and lower 5% of deviation values, this study took a more conservative approach to the comparison and analysis.
Overall, there was a significant difference between the interproximal area and the cusp of the tooth. In scans using a model scanner based on blue LED light, diffuse reflec
tion occurs at the undercut and line angle, resulting in an inaccurate 3D representation of the adjacent tooth.6 There
fore, if there is severe crowding, the optical approach to
Table 2. Comparison of linear measurements between the two groups(maxilla and mandible) MaxillaMandible Cast scan model (Mean
±SD)CBCT scan model (Mean±SD)Mean difference95% CI of the mean difference
Cast scan model (Mean
±SD)CBCT scan model (Mean±SD)Mean difference
95% CI of the mean dif
ference Right central incisor8.49±0.538.47±0.500.05-0.020.115.46±0.395.52±0.47-0.06-0.220.11 Right lateral incisor6.88±0.716.88±0.72-0.01-0.080.096.15±0.386.22±0.54-0.07-0.240.10 Right canine7.94±0.447.94±0.46-0.01-0.070.066.85±0.436.82±0.670.03-0.230.30 Right first premolar7.44±0.427.36±0.450.08-0.030.067.29±0.457.18±0.530.11-0.070.32 Right second premolar6.94±0.566.85±0.660.09-0.150.197.23±0.537.20±0.590.02-0.110.16 Right first molar10.47±0.4710.37±0.510.11*0.040.1711.10±0.5111.11±0.56-0.01-0.200.18 Left central incisor8.52±0.478.46±0.510.06-0.010.125.43±0.335.45±0.36-0.01-0.110.84 Left lateral incisor6.80±0.716.77±0.770.03-0.050.116.14±0.386.21±0.46-0.08-0.230.78 Left canine7.86±0.317.80±0.350.06-0.030.146.89±0.397.04±0.47-0.15*-0.28-0.02 Left first premolar7.47±0.407.35±0.500.13-0.010.257.36±0.507.30±0.510.06-0.040.17 Left second premolar6.95±0.516.90±0.530.05-0.060.167.23±0.507.15±0.550.08-0.030.18 Left first molar10.44±0.4010.45±0.44-0.01-0.070.0611.04±0.5710.93±0.610.11-0.050.26 Intercanine width34.76±3.0334.60±2.960.16*0.010.3227.36±2.3827.29±2.510.07-0.360.49 Intermolar width47.49±2.8347.46±2.880.030.150.5742.08±2.4741.67±2.660.42-0.281.12 CBCT: cone-beam computed tomography, SD: standard deviation, CI: confidence interval, *: P<0.05
the adjacent region in the model may be limited, possibly leading to errors in the mesiodistal width of the tooth or in the model analysis.15 There was no reference model in this study; therefore, the degree to which the accuracy of the interproximal area of the CBCT scan model could be eval
uated was limited.
Instead of an alginate impression material, which has large variation in deformation with respect to elapsed time and ambient humidity after setting, PVS was used to im
prove the accuracy of model fabrication because of its high volumetric consistency and finedetail reproducibility. In previous studies, the rate of volume change in PVS impres
sion material over time was reported to be 0.02% for 1hour and 0.07% for 24 hours,16 and CBCT was performed with
in 1hour of the impression to minimize time-dependent deformation. However, extendedpour alginate with high volumetric stability can be scanned using CBCT to produce a digital model.8,9 Although it is generally recommended to perform the CBCT scan immediately after impression tak
ing, it can be delayed up to 2 or 3 hours when a highstabil
ity impression material is used.9
This study performed CBCT scans at a resolution of 0.1mm, which improved the accuracy of the digital mod
els relative to those obtained by scanning at resolutions of >0.15mm to 0.3mm, as performed in previous stud
ies.8,17,18 Nevertheless, the differences in tooth width mea
surements found in this study are comparable to those from previous studies. This is because distances are measured on 2dimensional images even if those images are derived from a 3D model; therefore, deciding on the measurement point, reference axis, and/or teeth inclination is more com
plicated.3 Meanwhile, the accuracy of the 3D models, as
sessed using the superimposition method, improved to 53 μm because the program optimally superimposed the 2 dig
ital models, and the measurement points were configured automatically using the nearestneighbor algorithm.
The highest available resolution of CBCT is 100μm, which enables only a precise examination of 2 or 3 teeth within a 5 cm×5cm of fieldofview(FOV); however, CBCT scan data of the entire arch model could not be ob
tained using this scanning mode. In the object scanning mode used in the present study, the FOV was enlarged to 5 cm×8cm to capture the dental model or the entire body of the impression, while maintaining a resolution of 100μm.
Nevertheless, the surfaces of the CBCT scan models had an irregular texture compared with the surfaces of the cast scan models. This appears to have been due to the differ
ence in resolution between CBCT(100μm) and the model scanner(7μm), and the smoothing algorithm in the soft
ware of the model scanner used to obtain a uniform surface after scanning an image. In addition, the quality of CBCT was diminished by the presence of noise, including scatter
ing radiation, the beamhardening effect, and artifacts gen
erated during image processing. In this study, a conversion algorithm was applied with the expected maximization algorithm, marching cube algorithm, and smoothing algo
rithm, which were used to improve the transformation of CBCT impression data into 3D surface data in the STL for
mat.19 However, revised algorithms for the software need to be developed in order to improve surface precision and smoothness in a way that achieves the accuracy of a model scanner.
Recent developments in industrial CBCT technology and improvements in STL conversion algorithms have support
Table 3. Comparison of mean Bolton ratio between the two groups Cast scan model
(Mean±SD) CBCT scan
(Mean±SD) Mean difference 95% CI of the
mean difference
Anterior Bolton ratio 79.08±2.43 79.95±2.83 -0.87 -1.46 -0.28
Overall Bolton ratio 91.31±2.13 92.03±2.81 -0.72 -1.30 -1.45
CBCT: cone-beam computed tomography, SD: standard deviation, CI: confidence interval, *: P<0.05
Fig. 5. Boxplot of dimensional discrepancies between the cast scan models and conebeam computed tomography scan models.
*Maximum outliers.
ed the clinical use of digital models based on CBCT.10,18 Therefore, applying CBCT technology for these purposes is advantageous because it does not require the purchase of an additional model scanner or intraoral scanner. In addition, CBCT scans are acquired using a volume scan method, instead of a surface scan method using a laser or LED source; therefore, CBCT scans are not affected by the angle of irradiation or the shape of the subject. CBCT can even be used in cases of crowding without managing raw scanned data.
An average of 22 minutes is required for plaster model
ing, including pouring and trimming, after a conventional alginate impression.20 In this study, the digital models were acquired within 5minutes after a rubber impression, with 14 seconds for the CBCT scan of the impression, 1 minute for CBCT file export, and 2minutes for conversion to an STL file for each arch. In terms of efficiency, digital mod
eling using CBCT appears to be clinically feasible and is associated with a reduction in laboratory time.
In conclusion, no significant differences were found in most measurements between the cast scan models and CBCT digital models(the mesiodistal width difference was <0.15mm). Furthermore, the average model super
imposition difference was 53μm, which was clinically ac
ceptable. Therefore, CBCT may be suitable for use in clin
ical practice because of its advantages, including a reduced working time for digital model production.
conflicts of Interest: None
references
1. Fleming PS, Marinho V, Johal A. Orthodontic measurements on digital study models compared with plaster models: a sys
tematic review. Orthod Craniofac Res 2011; 14: 116.
2. Horton HM, Miller JR, Gaillard PR, Larson BE. Technique comparison for efficient orthodontic tooth measurements us
ing digital models. Angle Orthod 2010; 80: 25461.
3. Leifert MF, Leifert MM, Efstratiadis SS, Cangialosi TJ. Com
parison of space analysis evaluations with digital models and plaster dental casts. Am J Orthod Dentofacial Orthop 2009;
136: 16.e14.
4. Mullen SR, Martin CA, Ngan P, Gladwin M. Accuracy of space analysis with emodels and plaster models. Am J Orthod Dentofacial Orthop 2007; 132: 34652.
5. Reuschl RP, Heuer W, Stiesch M, Wenzel D, Dittmer MP. Re
liability and validity of measurements on digital study models and plaster models. Eur J Orthod 2016; 38: 226.
6. Lim MY, Lim SH. Comparison of model analysis measure
ments among plaster model, laser scan digital model, and cone beam CT image. Korean J Orthod 2009; 39: 617.
7. Maret D, Telmon N, Peters OA, Lepage B, Treil J, Inglèse
JM, et al. Effect of voxel size on the accuracy of 3D recon
structions with cone beam CT. Dentomaxillofac Radiol 2012;
41: 64955.
8. Lee SM, Hou Y, Cho JH, Hwang HS. Dimensional accuracy of digital dental models from conebeam computed tomogra
phy scans of alginate impressions according to time elapsed after the impressions. Am J Orthod Dentofacial Orthop 2016;
149: 28794.
9. Jiang T, Lee SM, Hou Y, Chang X, Hwang HS. Evaluation of digital dental models obtained from dental conebeam computed tomography scan of alginate impressions. Korean J Orthod 2016; 46: 12936.
10. Wiranto MG, Engelbrecht WP, Tutein Nolthenius HE, van der Meer WJ, Ren Y. Validity, reliability, and reproducibility of linear measurements on digital models obtained from intraoral and conebeam computed tomography scans of alginate im
pressions. Am J Orthod Dentofacial Orthop 2013; 143: 1407.
11. Stevens DR, FloresMir C, Nebbe B, Raboud DW, Heo G, Major PW. Validity, reliability, and reproducibility of plaster vs digital study models: comparison of peer assessment rating and Bolton analysis and their constituent measurements. Am J Orthod Dentofacial Orthop 2006; 129: 794803.
12. Bishara SE, Jakobsen JR, Abdallah EM, Fernandez Garcia A.
Comparisons of mesiodistal and buccolingual crown dimen
sions of the permanent teeth in three populations from Egypt, Mexico, and the United States. Am J Orthod Dentofacial Or
thop 1989; 96: 41622.
13. Mayers M, Firestone AR, Rashid R, Vig KW. Comparison of peer assessment rating(PAR) index scores of plaster and com
puterbased digital models. Am J Orthod Dentofacial Orthop 2005; 128: 4314.
14. Ender A, Mehl A. Accuracy of completearch dental impres
sions: a new method of measuring trueness and precision. J Prosthet Dent 2013; 109: 1218.
15. Redlich M, Weinstock T, Abed Y, Schneor R, Holdstein Y, Fischer A. A new system for scanning, measuring and ana
lyzing dental casts based on a 3D holographic sensor. Orthod Craniofac Res 2008; 11: 905.
16. Aalaei S, Adli AR, Mansoorali MR, Gholami F. Dimensional stability of two polyvinyl siloxane impression materials in dif
ferent time intervals. J Dent Biomater 2015; 2: 15561.
17. Akyalcin S, Dyer DJ, English JD, Sar C. Comparison of 3di
mensional dental models from different sources: diagnostic accuracy and surface registration analysis. Am J Orthod Den
tofacial Orthop 2013; 144: 8317.
18. de Waard O, Rangel FA, Fudalej PS, Bronkhorst EM, Kui
jpersJagtman AM, Breuning KH. Reproducibility and accu
racy of linear measurements on dental models derived from conebeam computed tomography compared with digital den
tal casts. Am J Orthod Dentofacial Orthop 2014; 146: 32836.
19. Bazi Y, Bruzzone L, Melgani F. Image thresholding based on the EM algorithm and the generalized Gaussian distribution.
Pattern Recogn 2007; 40: 61934.
20. Grünheid T, McCarthy SD, Larson BE. Clinical use of a direct chairside oral scanner: an assessment of accuracy, time, and patient acceptance. Am J Orthod Dentofacial Orthop 2014;
146: 67382.