Printed in the Republic of Korea DOI 10.5012/jkcs.2011.55.3.444
2-(Phenylamino)acetohydrazide 로부터 유도된 Hydrzone 리간드와 그들의 착물의 합성, 특성 및 항균활성
F. A. EL-Saied, M. M. E. Shakdofa†, and A. N. Al-Hakimi‡,*
Department of Chemistry, Faculty of Science, El-Menoufia University, Shebin El-Kom, Egypt
†Inorganic Chemistry Department, National Research Centre, P.O. 12622 Dokki, Cairo, Egypt
‡Department of Chemistry, Faculty of Science, Ibb University, P.O. 70270 Ibb, Yemen.
(접수 2011. 1. 12; 수정 2011. 3. 21; 게재확정 2011. 4. 25)
Synthesis, Characterization and Antimicrobial Activities of Hydrazone Ligands Derived from 2-(phenylamino)acetohydrazide and Their Metal Complexes
F. A. EL-Saied, M. M. E. Shakdofa†, and A. N. Al-Hakimi‡,*
Department of Chemistry, Faculty of Science, El-Menoufia University, Shebin El-Kom, Egypt
†Inorganic Chemistry Department, National Research Centre, P.O. 12622 Dokki, Cairo, Egypt
‡Department of Chemistry, Faculty of Science, Ibb University, P.O. 70270 Ibb, Yemen.
*E-mail: [email protected]
(Received January 12, 2011; Revised March 21, 2011; Accepted April 5, 2011)
요 약. N'-(2-hydroxybenzyl)-2-(phenylamino)acetohydrazide (H2L1, 1) 및 N'-((3-hydroxy-naphthalen-2-yl)methylene)-2-(phe- nylamino)acetohydrazide (H2L2, 13)에 대한 VO(II), ZrO(II), Hf(IV), UO2(II), Sn(II), V(V)O3, Ru(III), Cd(II), Ho(III) 및 Yb(III) 착물을 합성하여 원소분석, 1H NMR, IR, UV–Vis, 전기전도도 및 열분석 (DTA 및 TG)을 통해 특성을 조사하였다.
이들 리간드는 분광학적 결과에 의하면 중성 이배위, 일염기성 이배위, 일열기성 삼배위 또는 이염기성 삼배위 리간드로 행동한다. 그 결과 azomethine 질소원자, 양성자화 되어있거나 또는 탈양성자화 된 형태의 페놀 하이드록시 그룹 그리고 에놀 또는 케톤형 카드보닐 그룹을 통해 금속이온에 결합한다. 이들 리간드와 그 금속 착물들은 모체 리간드 및 금속이 온 용액에 비해 높은 항균 및 항박테리아 저해효과를 보인다. 대부분의 금속 착물은 표준 항균성 시약 (amphotricene B) 보다 더 높은 항균 활동성을 보인다. 또한 이들 리간드와 착물은 항박테리아 활성도보다는 항균활성도에서 더 높은 수치 를 보인다.
주제어: Aacetohydrazide, hydrazone, 금속착물, 생물활성도
ABSTRACT. VO(II), ZrO(II), Hf(IV), UO2(II), Sn(II), V(V)O3, Ru(III), Cd(II), Ho(III) and Yb(III) complexes of N'-(2- hydroxybenzyl)-2-(phenylamino)acetohydrazide (H2L1, 1) and N'-((3-hydroxy-naphthalen-2-yl)methylene)-2-(phenylamino)- acetohydrazide (H2L2, 13) have been synthesized and characterized by elemental analyses, 1H NMR, IR, UV-Vis, con- ductance, thermal analyses (DTA and TG). The spectral data showed that the ligands behave as neutral bidentate, monobasic bidentate, monobasic tridentate or bibasic tridentate ligand bonded to the metal ions through the azomethine nitrogen atoms, phenolic hydroxyl group in protonated or deprotonated form and enolic or ketonic carbonyl group. The ligands and their metal complexes exhibit higher antifungal and antibacterial inhibitory effects than parent ligands and the solution of metal ions.
Most of metal complexes exhibit higher antifungal activity than standard antifungal drug (amphotricene B). It is also clear that the ligands and their metal complexes have higher antifungal activity than antibacterial activity.
Keywords: Aacetohydrazide, Hydrazone, Metal complexes, Biological activity
INTRODUCTION
The interest in the study of hydrazone compounds and their metal complexes has recently been grown up due to their biological activities as antifungal,1-3 antibacterial1-4 anticonvulsant,5 anti-inflammatory,3 anti-malarial,6 anal- gesic,7 anti-platelets,8 anti-tuberculosis,9 anticancer,10 and
a treatment of leprosy and mental disorder diseases.11 Tuberculostatic activity is attributed to the formation of stable chelates with transition metals present in the cell.
Thus, many vital enzymatic reactions catalyzed by these transition metals cannot take place in the presence of hydrazones.8 Hydrazones also act as herbicides, insecti- cides, nematocides, rodenticides and plant growth regu-
lators. Also hydrazones are used as plasticizers and stabilizers for polymers, polymerization initiators, anti- oxidants. In analytical chemistry, hydrazones find appli- cation in detection, determination and isolation of compounds containing the carbonyl group. More recently, they have been extensively used in detection and deter- mination of several metals.12 Due to the coordination capability of isonicotinoyl hydrazide, which are a pri- mary anti-tuberculosis drug, and its hydrazones which has been widely exploited for many biochemical and phar- macological applications. Metal complexes of 2-acetylpyri- dine benzoylhydrazone were synthesized and crystallog- raphically characterized.13 Manganese(II), iron(III), nickel(II), cobalt(II) and zinc(II) complexes of 2,6- diformyl-4-methylphenoldibenzoylhydrazone have been prepared and characterized by elemental and spectro- scopic measurements.14 Cobalt(II), manganese(II), copper(II) complexes of 2-acetylpyridine salicyloylhydrazone and 2-benzoylpyridine salicyloylhydrazone, have been syn- thesized and characterized.15 Zinc(II) complexes of 2- Benzoylpyridine-phenylhydrazone, 2-benzoylpyridine-para- chloro-phenyl hydrazone and 2-benzoylpyridine-para- nitro-phenyl hydrazone have been prepared and charac- terized elemental, spectral and single-crystal X-ray dif- fraction analyses.16 Much work on metal complexes of hydrazones with different functional groups has been reported.17 The aim of this manuscript is the preparation and characterization of VO(II), ZrO(II), Hf(IV), UO2(II), Sn(II), V(V)O3, Ho(III), Ru(III), Cd(II) and Yb(III) complexes of N'-(2-hydroxybenzyl)-2-(phenylamino) acetohydrazide (H2L1,1) and N'-((3-hydroxy naphthalen-2-yl)methylene)- 2-(phenylamino) acetohydrazide (H2L2, 13).
EXPERIMENTAL Instrumentation and measurements
The starting chemicals were of analytical grade. IR spectra of the solid ligand and complexes were recorded on Perkin-Elmer infrared spectrometer 681 or Perkin- Elmer 1430 using KBr disc. The 1H-NMR spectra were recorded with a JEOL EX-270 MHz FT-NMR spectrom- eter in CDCl3 as solvent, where the chemical shifts were determined relative to the solvent peaks. The molar con- ductivity of the metal complexes in DMSO at 10-3M con- centration was measured using a dip cell and a Bibby conductimeter MC1 at room temperature. The resistance measured in ohms and the molar conductivities were cal- culated according to the equation: equation: ΛM= V×K×g/
Mw×Ω where: ΛM = molar conductivity (ohm-1cm2mol-1),
V = volume of the complex solution, K = cell constant (0.92 cm-1), Mw = molecular weight of the complex, g = weight of the complex, Ω = resistance measured in ohms.
Electronic absorption spectra were recorded on a Shimo- dzu 240 using 1 cm quartz cells taking DMSO as solvent.
The thermal analyses (DTA and TG) were carried out in the air on a Shimadzu DT-30 thermal analyzer from 27 to 800oC at a heating rate of 10oC per minute. Elemental anal- ysis (CHN) was performed in the Analytical Unit within Cairo University (Egypt) by the usual methods of analysis.
Preparation of ligands
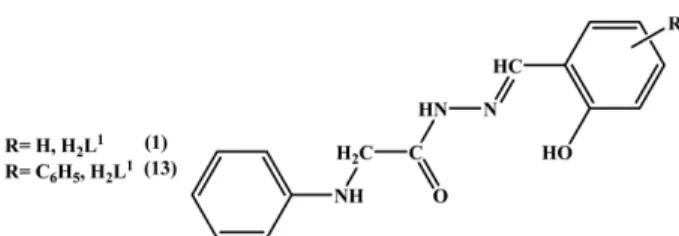
The acetohydrazide Schiff bases H2L1 and H2L2 were prepared by refluxing equimolar amounts of salicylalde- hyde (1.22 g, 0.01 mol) or 2-hydroxy-1-naphthaldehyde (1.72 g, 0.01 mol) to the solution of 2-(phenylamino)ace- tohydrazide (1.65 g, 0.01 mol.) in 50 ml absolute ethanol for an hour. The formed solid product was filtered off, washed with ethanol, crystallized from ethanol and dried under vacuum over anhydrous CaCl2.18 1H NMR (270 MHz, CDCl3, ppm) H2L1: δ(OH)=13.15 (s, 1H), δ(CONH)
=11.88 (s, 1H) δ(NHCH2)=9.8 (s, 1H), δ(N=CH)=8.65 (s, 1H), δ(C6H5)=8.43-7.10 (m, 9 H), and δ(CH2)=4.05;
H2L2: δ(OH)=12.85 (s, 1H), δ(CONH)=11.80 (s, 1H) δ (NHCH2)=10.1 (s, 1H), δ(N=CH)=8.6(s, 1H), δ(C6H5)=
8.33-6.90 (m, 11 H), and δ(CH2)= 4.25 (Fig. 1).
Preparation of metal complexes
Complexes 2-7, 10, 14, 17-19 and 21-22 were prepared by adding a solution of metal salts VOSO4·3H2O, ZrOCl2· 8H2O, UO2(OAc)2·2H2O, SnCl2·2H2O, Cd(OAc)2, (UO2(NO3)2· 6H2O, Yb(NO3)3·5H2O or RuCl3·3H2O (1 mmol) to the solution of the hydrazone ligands (2 mmol, in ethanol).
The mixture was refluxed while stirring for three hours.
The resulting solid complexes were filtered off, washed several times with ethanol and dried under vacuum.
Complexes 8, 9, 11-12, 15-16, 20 and 23-24 were pre- pared by adding a solution of metal salts HoCl3·6H2O, RuCl3·nH2O, NH4VO3, HfCl4, ZrOCl2·8H2O, and UO2
(OAc)2·2H2O (1 mmol) to the solution of the hydrazone ligands (1 mmol, in ethanol). The mixture was refluxed
Fig. 1. Structure representation of the ligands.
while stirring for four hours. The resulting solid com- plexes were filtered off, washed several times with eth- anol and dried under vacuum.
In-vitro antibacterial and antifungal activities The biological activities of the newly synthesized ligands, their metal complexes and metal salts were carried out in the Botany Department, Lab. of microbiology, Faculty of Science, El-Menoufia University. They have been studied for their antibacterial and antifungal activities by disc dif- fusion method.19,20 The antibacterial and antifungal activ- ities were done using Escherichia coli and Aspergillus niger at 1000 ppm concentrations in solvent DMSO.
Where DMSO poured disc was used as negative control.
The bacteria were subcultured in nutrient agar medium which, prepared using (g.L-1 distilled water) NaCl (5 g), peptone (5 g), beef extract (3 g), agar (20 g). The fungus was subcultured in Dox’s medium which prepared using (g.L-1 distilled water) yeast extract (1 g), sucrose (30 g), NaNO3, agar (20 g), KCl (0.5 g), KH2PO4 (1 g), MgSO4· 7H2O (0.5 g) and trace of FeCl3·6H2O. These mediums
were then sterilized by autoclaving at 120oC for 15 min.
After cooling to 45oC the medium was poured into 90 mm diameter Petri dishes and incubated at 37 or 28oC respec- tively. After few hours, Petri dishes were stored at 4 oC.
Microorganisms were spread over each dish by using ster- ile bent Loop rod. The test is carried out by placing filter paper disks with a known concentration of the com- pounds on the surface of agar plates inoculated with a test organism. Standard antibacterial drug (tetracycline), anti- fungal drug (amphotricene B) and solution of metal salts were also screened under similar conditions for compar- ison. The Petri dishes were incubated for 48-72 hours at 37 or 28 ºC for the two organisms respectively. The zone of inhibition was measured in millimeters carefully. All determination was made in duplicate for each of the com- pounds. An average of the two independent readings for each compound was record.
RESULTS AND DISCUSSION
The ligand H2L1, 1; H2L2, 13 and their metal com- Table 1. Analytical and some physical Characteristics for the ligands and their metal complexes
No. Compounds Color M. Wt. Calcd (Found) %
ΛaM Yeild
C H N (%)
1 H2L1 (C15H14N3O2) Yellow 269.31 67.20(67.90) 5.20(5.50) 19.60 (19.40) -- 90 2 [(HL1)2(VO)]·H2O green 621.55 57.97(57.90) 4.78(5.10) 13.52 (13.70) 13 70 3 [(HL1)2 ZrO]·5H2O Yellow 735.91 48.96 (49.20) 5.48(5.60) 11.42 (11.60) 5.3 82 4 [(H2L1)2UO2(OAc)2]·4H2O Orange 998.78 40.89 (40.9) 4.44 (4.10) 8.41 (9.62) 8.4 75 5 [(HL1)2 Sn]·3H2O Y. White 709.35 50.8 (51.00) 4.83 (4.61) 11.85 (12.02) 33.5 70 6 [(H2L1)2Cd(OAc)2] Y. White 767.09 53.24(53.00) 4.47(4.52) 10.96(13.11) 12.4 80 7 [(HL1)2UO2] Orange 806.62 44.67 (45.50) 3.50 (3.59) 10.42 (10.72) 15.3 73 8 [(HL1)HoCl2(H2O)]·4H2O Yellow 594.21 30.32(29.97) 4.07(4.25) 7.07 (7.32) 6.5 77 9 [(HL1)RuCl2(H2O)]·6H2O Dark Brown 566.41 31.81(31.70) 4.98(4.90) 7.43 (7.64) 4.7 83 10 [(HL1)2Yb]·(NO3) Y. white 771.64 46.70(47.10) 3.66(3.90) 12.71 (13.01) 90.1 80 11 NH4[H2L1)VO3]·2H2O Y. White 422.31 42.66 (43.11) 4.54 (4.20) 13.27 (13.55) 72.5 77 12 [HL1HfCl3]·2H2O Yellow 590.18 30.53(30.31) 3.25 (3.29) 7.12 (7.31) 17.5 65 13 H2L2 (C19H17N3O2) Yellow 319.36 71.46 (71.50) 5.37 (5.32) 13.16 (13.2) -- 85
14 [(HL2)2VO] green 703.65 64.8 (64.58) 4.58 (4.42) 11.94 (12.12) 0.5 73
15 [HL2ZrOCl]·2H2O Yellow 497.06 45.91 (45.49) 4.06 (4.05) 8.45 (8.54) 21.1 77 16 [(H2L2 )(UO2)(OAc)2] Orange 707.48 39.05 (38.81) 3.28 (3.47) 5.94 (6.17) 30.2 75 17 [(HL1)2 Sn] Black 755.42 60.42 (60.21) 4.27 (4.32) 11.13(11.26) 10.5 77 18 [(HL1)2Cd(OAc)2] Yellow 869.23 58.04 (57.91) 4.64 (4.52) 9.67(10.09) 11.5 73 19 [(HL2 )2(UO2)(NO3)2]·2H2O Pale yellow 1068.79 42.70 (42.54) 3.58 (3.63) 10.48 (10.71) 23.5 76 20 [(L2)HoCl(H2O)2] Yellow 552.76 41.21 (41.93) 3.46 (4.41) 7.59 (7.98) -- 75 21 [(HL2)2Ru]·Cl Brown 773.27 59.02 (58.89) 4.17 (4.22) 10.87 (11.02) 79.3 78 22 [(L2)Yb(NO3)(H2O)2] Pale Yellow 588.42 38.78(39.31) 3.25 (3.01) 8.52 (9.75) 13.8 79 23 NH4[(H2L2 )VO3] Y. White 436.34 52.30 (51.65) 3.93(3.78) 12.84 (12.59) 65.6 65 24 [HL2HfCl3]·6H2O Yellow 711.30 32.08 (31.89) 3.97(3.88) 5.91 (6.01) 9.8 59
aMolar conductivity as 10-3 M solutions (ohm-1 cm2 mol-1), Y. = yellowish
plexes 2-12 and 14-24 are stable at room temperature. The complexes are insoluble in H2O but sparingly soluble in common organic solvents such as ethanol, acetone, and chloroform but highly soluble in DMF and DMSO. The elemental analysis confirmed that the complexes 2-7, 10, 14, 17-19 and 21-22 composed form ligand and metal ions with molar ratios equal to 2L:1M, However, the com- plexes 8, 9, 11-12, 15-16, 20 and 23-24 composed form ligand and metal ion with molar ratios equal to 1:1 Table 1. The analytical, Table 1 and spectral data Tables 2 and 3 are compatible with the suggested structure. The structure was formulated as shown in Figs. 2-7.
Mass Spectra of the Ligands
The mass spectra of the Schiff base ligands H2L1 and H2L2 revealed the molecular ion peaks at m/e 269 and 319, which are coincident with the formula weights of the two ligands (269.31) and (319.36), respectively, support- ing the identity of their structures Fig. 1.
IR spectra
The infrared spectral data of the ligands and their metal
complexes 2-12 and 14-24 were presented in Table 2. The infrared spectra of the ligands H2L1 and H2L2 showed a strong band at 1680 and 1665 cm-1 which assigned to car- bonyl group n(C=O) of the two ligands respectively. The two medium bands in the 3320-3299 and 3270-3180 cm-1 ranges may be assigned to the n(NH) amino groups of NHCH2 and CONH, indicating that the ligand is present in the ketonic form in the solid state.21,22 The spectrum showed also broad bands at 3438 and 3425 cm-1 which may be assigned to the stretching vibration of the phe- nolic hydroxyl associated through an intra-molecular hydrogen bonding.21-23 The relatively strong bands located in the 1620-1606, 1275-1280, 958-979 cm-1 ranges assigned to the n(C=N) of the azomethine group, phenolic ν(C- OH)18 and ν(N-N) respectively.22
The mode of bonding of the ligands with the metal ions can be predicted by comparison the infrared spectra of the complexes 2-12 and 14-24 with that of the free ligands. In case of complexes 2, 3, 5, 7-9, 12-15, 17-20, 22 and 24 the bands characteristic to the phenolic hydroxyl group dis- appeared indicating that, it takes part in the bonding to the metal ions in the deprotonated form. In the case of com- Table 2. IR spectral assignment for the ligands and their metal complexes
No. Compounds ν(Coord.
H2O) νOH) ν(NH) ν(C=O) ν(C=N) ν(C-OH) ν(N-N) ν(M-O) ν(M-N) ν(M=O)/
νNO3
1 H2L1 (C15H14N3O2) ---- 3434(br) 3320, 3270 1675(s) 1620 1275 958 -- -- -- 2 [(HL1)2(VO)]·H2O 3347(br) --- 3306,3267 1674(s) 1607 1310 1030 688 461 972 3 [(HL1)2 ZrO]·5H2O 3388(br) --- 3300, 3162 1670(s) 1606 1299 1030 692 534 912 4 [(H2L1)2UO2(OAc)2]·4H2O 3350(br) 3388(m) 3303,3256 1675(s) 1611 1267 1031 594 509 902 5 [(HL1)2 Sn]·3H2O 3400(br) --- 3316,3256 1676(s) 1608 1313 1033 571 505
6 [(H2L1)2Cd(OAc)2] --- 3428(w) 3308,3267 1675(s) 1605 1266 1028 627 570
7 [(HL1)2UO2] --- --- 3300,3170 -- 1600 1311 1021 638 508 897
8 [(HL1)HoCl2(H2O)]·4H2O 3410(br) --- 3328,3203 1646 1609 1298 998 515 420 9 [(HL1)RuCl2(H2O)]·6H2O 3390(br) --- 3311,3268 1645 1595 1312 1034 571 506
10 [(HL1)2Yb]·(NO3) --- 3423(br) 3300 ---- 1613 1290 1035 581 506 1385 11 NH4[H2L1)VO3]·2H2O --- 3401(br) 3290,3201 1693(s) 1596 1294 1027 657 513 944,909 12 [HL1HfCl3]·2H2O 3480(br) ---- 3301, 3265 1693(s) 1596 1295 1012 584 489
13 H2L2 (C19H17N3O2) --- 3425(br) 3299, 3180 1665(s) 1606 1280 979 620 497
14 [(HL2)2VO] --- -- 3298,3191 1666(s) 1595 1305 1012 612 511
15 [HL2ZrOCl]·2H2O 3360(br) -- 3295, 3206 1665(s) 1590 1298 991 600 505
16 [(H2L2 )(UO2)(OAc)2] --- 3398(br) 3250,3150 1660(s) 1588 1299 1025 540 480 932
17 [(HL1)2 Sn] --- -- 3289,3200 1667(s) 1595 1285 1012 560 475
18 [(HL1)2Cd(OAc)2] --- --- 3300,3195 1665(s) 1585 1280 1022 540 468
19 [(HL2 )2(UO2)(NO3)2]·2H2O 3380(br) --- 3310,3200 1670(s) 1599 1276 1025 544 447 940
20 [(L2)HoCl(H2O)] 3400(br) --- 3310 --- 1583 1255 1027 570 475
21 [(HL2 )2Ru]Cl --- --- 3270,3140 1655(s) 1580 1311 1031 562 480
22 [(L2)Yb(NO3)] --- --- 3310 ---- 1598 1271 1027 575 465
23 NH4[(H2L2 )VO3] --- --- 3300,3180 1665(s) 1580 1284 1024 565 490 970, 918 24 [HL2HfCl3]·6H2O 3425(br) --- 3290,3170 1670(s) 1605 1325 1020 570 510
plexes 4, 6, 11, 16 and 23 the characteristic band of the phenolic hydroxyl group is present and shifted to lower wave number by 6-46 cm-1 indicated that the ligand coor- dinated to the metal ions through the protonated phenolic hydroxyl oxygen. This suggestion is supported by the higher or lower shifting of the ν(C-Ophenolic) band which
appeared in the spectra of the metal complexes in the 1330-1266 range.24-26 The bands of carbonyl ν(C=O) and ν(NH) amino groups are appeared at the same position indicating that these groups do not participate in the coor- dination to the metal ions except complexes 10 and 21 in which shifted to lower frequency indicating the partici- pation of the carbonyl oxygen in coordination with the Ru(III) or Yb(III) ions. But in case of complexes 20 and 22 the characteristic band of carbonyl ν(C=O) and amino ν(NH) groups disappeared indicating that, the ligand bonding with Ru(III) and Yb(III) in dibasic form through Table 3. Electronic spectra of the ligands and there metal com-
plexes
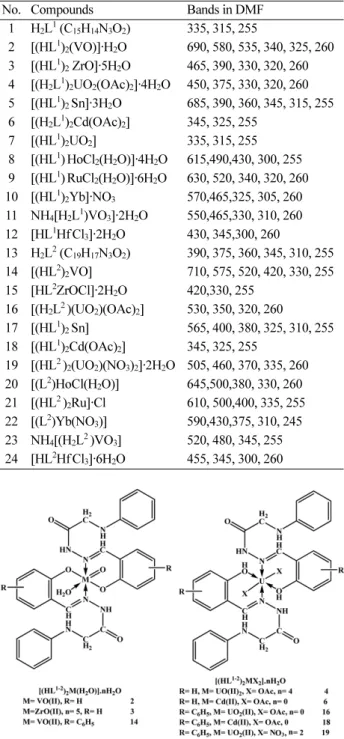
No. Compounds Bands in DMF
1 H2L1 (C15H14N3O2) 335, 315, 255
2 [(HL1)2(VO)]·H2O 690, 580, 535, 340, 325, 260 3 [(HL1)2 ZrO]·5H2O 465, 390, 330, 320, 260 4 [(H2L1)2UO2(OAc)2]·4H2O 450, 375, 330, 320, 260 5 [(HL1)2 Sn]·3H2O 685, 390, 360, 345, 315, 255 6 [(H2L1)2Cd(OAc)2] 345, 325, 255
7 [(HL1)2UO2] 335, 315, 255 8 [(HL1)HoCl2(H2O)]·4H2O 615,490,430, 300, 255 9 [(HL1)RuCl2(H2O)]·6H2O 630, 520, 340, 320, 260 10 [(HL1)2Yb]·NO3 570,465,325, 305, 260 11 NH4[H2L1)VO3]·2H2O 550,465,330, 310, 260 12 [HL1HfCl3]·2H2O 430, 345,300, 260
13 H2L2 (C19H17N3O2) 390, 375, 360, 345, 310, 255 14 [(HL2)2VO] 710, 575, 520, 420, 330, 255 15 [HL2ZrOCl]·2H2O 420,330, 255
16 [(H2L2 )(UO2)(OAc)2] 530, 350, 320, 260
17 [(HL1)2 Sn] 565, 400, 380, 325, 310, 255 18 [(HL1)2Cd(OAc)2] 345, 325, 255
19 [(HL2 )2(UO2)(NO3)2]·2H2O 505, 460, 370, 335, 260 20 [(L2)HoCl(H2O)] 645,500,380, 330, 260 21 [(HL2 )2Ru]·Cl 610, 500,400, 335, 255 22 [(L2)Yb(NO3)] 590,430,375, 310, 245 23 NH4[(H2L2 )VO3] 520, 480, 345, 255 24 [HL2HfCl3]·6H2O 455, 345, 300, 260
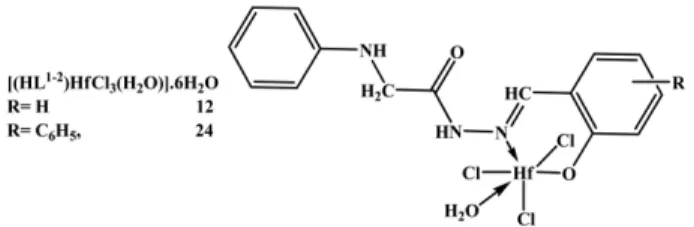
Fig. 2. structure representation of Cd(II), VO(II), ZrO(II) and UO2(II) complexes.
Fig. 3. structure representation of Sn(II) and UO2(II) complexes 5, 7 and 17.
Fig. 4. structure representation of Ho(III) Ru(III) and ZrO(II) complexes 8, 9 and 15.
Fig. 5. structure representation of Yb(III) and Ru(III) complexes 10 and 21.
the enolic carbonyl oxygen and deprotonated phenolic hydroxyl oxygen The characteristic band of the azome- thine group ν(C=N) was shifted to lower frequency com- pared to that of the free ligand by a value ranged between 6 and 31 cm-1. This indicated that, the azomethine nitro- gen atom coordinated with the metal ions.17 On the other hand the characteristic band of ν(N-N) was shifted from 958 and 979 cm-1 in the spectrum of the ligands to 991- 1035 cm-1 in the spectra of all complexes. The lowering of the C=N frequency and also the increasing in the fre- quency of N-N confirmed that the azomethine nitrogen atom participated in coordination with the metal ions.
This shifting in the ν(N-N) band to higher energy region is due to diminished repulsion between the ions pair of adja- cent nitrogen atoms upon coordination.17 The appearance of a new bands appeared in the ranges 504-692 and 420- 534 cm-1 for different complexes may be assigned to the ν(MO) and ν(MN) respectively.27,28 The νas(CO2-) and νs(CO2-) of the free acetate ion are ca. 1560 and 1416 cm-1 respectively. In unidentate acetate complexes ν(C=O) is higher than νs(CO2-) and ν(C-O) is lower than νas(CO2-).
As a result the separation between the two ν(CO) is much larger in unidentate than in free ion but in bidentate the separation is lower than in the free ion while in bridging bidentate the two ν(CO) is closer to the free ion.29 In the case of complexes 4, 6, 16 and 18, there are two new bands appeared in the 1550-1561 and 1348-1377 cm-1 ranges which are attributed to the symmetric and asym- metric stretching vibration of the acetate group. The dif- ferences between these two bands are in the 169-194 cm-1 range which indicates that, the acetate ion coordinates to the metal ion in unidentate manner.29,30 The infrared spec- tra of nitrato complexes 10, 19 and 22 show the presence
of coordinated or ionic nitrates. The two strong bands associated with the asymmetric stretch (C2v symmetry, coordinated NO3 group) appear at 1435, 1333 and 1426 1326 cm-1 for the complexes 19 and 22 respectively. The difference of the nitrate stretching fundamentals at ~1400 and ~1300 cm-1 (∆ν) has been used to distinguish between the degree of covlency of the nitrate coordination. This difference (∆ν) increases as the coordination of the nitrate group increases for monodentate to bidentate and/or bridging increases. The magnitude is used to establish the type of nitrate coordination. In these complexes 19 and 22 Dn are 99 and 101 cm-1 respectively and are typical of uni- dentate bonding of nitrates. The spectrum of complex 10 shows band at 1385 cm-1 which is characteristic for ionic nitrates (D3h symmetry, free NO3 ion).29,31-33
The infrared spectra of the vanadyl complexes 2 and 14 exhibit a sharp band in the 971-987 cm-1 was assigned to ν(V=O) stretch.34 The spectra of zirconyl complexes 3 and 15 show band at 736 and 798 respectively assigned to the ν(Zr=O).35 The infrared spectra of the uranyl com- plexes 4, 7, 16 and 19 reveal bands in the 940-954 cm-1 range which may be attributed to ν(O=U=O).36,37 The spec- tra of vanadate complexes 11 and 23 show bands at 3325, 1418 and 3300, 1432 cm-1 attributed to the NH stretching and deformation of NH4+ group respectively. In addition bands in the 977-946 cm-1 assigned to ν(V=O).34,38,39 In complexes 2-5 8-9, 11-12, 15, 19-20 and 24 there are a broad band appeared in the 3347-3480 cm-1 range assigned to lattice water molecules.39
The spectral and elemental analyses indicated that, the hydrazone ligands behave as neutral bidentate (H2L1-2), monobasic bidentate (HL1-2) or monobasic tridentate ligands toward the metal ions, bonded with the metal ion via pro- tonated or deprotonated phenolic hydroxyl oxygen atom, azomethine nitrogen atom or ketonic carbonyl oxygen atom.
The molar conductivity
The molar conductivity of 1×10⁻³M solution of the metal complexes in DMSO at room temperature are in the 8.4-90.1 Ω-1cm2mol-1 range indicating the non electro- lytic nature of these complexes except complexes 10, 11, 21 and 23. These confirmed that the anion is coordinated to metal ion. The considerably high values of some com- plexes may be due to the partial solvolysis by DMSO.
However, complexes 10, 11, 21 and 23 have values 72.5, 90.1, 79.3 and 65.6 Ω-1cm2mol-1,indicating the electro- lytic nature of this complex.40 These data are agreeable with Greenwood el al. studies.41 They have suggested 50- 70 Ω-1cm2mol-1 as the range for 1:1 electrolyte in DMSO.
Fig. 6. structure representation of Hf(IV) complexes 12 and 24.
Fig. 7. structure representation of Ho(III) and Yb(III) complexes 20 and 22.
Electronic absorption spectra of the ligands and their metal complexes
The electronic absorption spectral bands of the ligands and their metal complexes in DMSO are reported in Table 3. The data reveals that, the ligands comprise three sets of bands. The first set of the shortest wave length appeared at 250-265 nm may be assigned to the π→π* transition in the benzenoid moieties which nearly unchanged on com- plexation.22,42 The second set appears at 310-320 and 345- 395 nm may be assigned to n→π* of the azomethine and carbonyl group.22,39 These bands shifted to higher energy on complexation indicating the participation of these groups in coordination with metal ions. The spectra of vandyl(II) complexes 2 and 14 in DMSO solution show that, there are three bands at 690, 575, 520 and 710, 580, 535 nm respectively which may be assigned to 2B2(dxy)→E(dxz,dzy),
2B2(dxy)→2B1(dx2-y2) and 2B2(dxy)→2A1(dz2) transitions indicating that, the vanadyl(II) complexes have distorted octahedral structures (Fig. 2).43-45 However the electronic absorption spectra of ruthenium(III) complexes 9 and 21 in DMSO solution displays two bands at 520, 630 and 500, 610 nm. The first band is due to LMCT transition and the second is assigned to 2T2g→2A2g transition. The band positions are similar to those observed for other octahe- dral ruthenium(III) complex(Fig. 4, 5).46 The electronic spectra of the uranyl complexes 4, 7, 16 and 19 exhibit one band in the 490-530 nm which may be assigned to ligand to uranium charge-transfer transitions.47 The diamagnetic complexes zircony(II), tin (II), cadmium(II) and hafin- ium(IV) complexes 3, 5, 6, 12, 15, 17, 18 and 24 do not show d-d transitions. The bands observed in the 420-465 nm range may be due to intraligand transition and (LMCT) (Table 4).48,49 The electronic spectral data of the ytter-
bium(III) and holmium(III) complexes 8, 10, 20 and 22 show weak bands in the 430-645 nm range because of weak f-f transition.50-52
Thermal Analyses (DTA and TG)
The results of TG and DTA analyses of complexes are shown in Table 4. The results show good agreement with theoretical formula as suggested from the analytical data (Table 1). Complexes 3, 4, 8 and 9 lost hydrate water mol-
Table 4. Thermal data for some metal complexes
Comp. No. Temp. (C0) DAT (peak) TG (Wt. loss (%)
Assignment Calc. (Found)
(3) 90
540
Endo.
Exo.
12.24 (12.8) 73.19 (72.65)
Loss of hydration water (5 H2O)
Decomposition with the formation of ZrO2
(4)
100 260 540
Endo.
Endo.
Exo.
9.02 (9.20) 11.80 (12.00) 53.93 (52.86)
Loss of hydration water (5 H2O) Loss of two acetate atoms (2HOAc) Decomposition with the formation of UO3
(8)
95 285 295 550
Endo.
Endo.
Endo.
Exo
9.10 (8.89) 3.03 (3.00) 11.93 (12.20) 45.32 (46.20)
Loss of hydration water (3 H2O) Loss of coordinated water (1 H2O) Loss of two chloride atoms (2HCl) Decomposition with the formation of HoO2
(9)
80 140 270 530
Endo.
Endo.
Endo.
Exo
19.08 (18.90) 3.18 (2.95) 12.52 (12.25) 47.55 (47.80)
Loss of hydration water (6 H2O) Loss of coordinated water (1 H2O) Loss of hydrochloride molecules (2 HCl) Decomposition with the formation of Ru2O3 Table 5. biological activities of the ligands and their metal com- plexes against bacteria and fungus
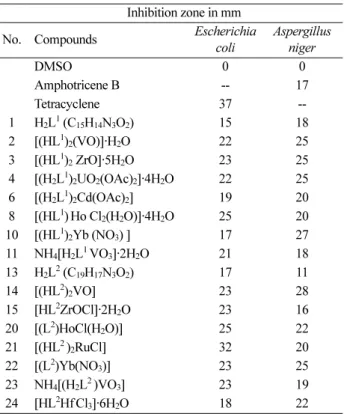
Inhibition zone in mm
No. Compounds Escherichia
coli Aspergillus niger
DMSO 0 0
Amphotricene B -- 17
Tetracyclene 37 --
1 H2L1 (C15H14N3O2) 15 18
2 [(HL1)2(VO)]·H2O 22 25
3 [(HL1)2 ZrO]·5H2O 23 25
4 [(H2L1)2UO2(OAc)2]·4H2O 22 25
6 [(H2L1)2Cd(OAc)2] 19 20
8 [(HL1)Ho Cl2(H2O)]·4H2O 25 20
10 [(HL1)2Yb (NO3) ] 17 27
11 NH4[H2L1 VO3]·2H2O 21 18 13 H2L2 (C19H17N3O2) 17 11
14 [(HL2)2VO] 23 28
15 [HL2ZrOCl]·2H2O 23 16
20 [(L2)HoCl(H2O)] 25 22
21 [(HL2 )2RuCl] 32 20
22 [(L2)Yb(NO3)] 23 25
23 NH4[(H2L2 )VO3] 23 19
24 [HL2HfCl3]·6H2O 18 22
ecules in the temperature 75-100oC range and were accompanied by an endothermic peak. The coordinated water molecules were eliminated from their complexes at relatively higher temperature than those of the hydrate water molecules (Table 4). The removal of an HCl mol- ecule was observed for 8 and 9 complexes in the tem- perature 240-310oC range, which was accompanied by an endothermic peak. The complexes decompose through degradation of the hydrazone ligand at a temperature over than 500oC C leaving metal oxides (530-550) range.
Biological activity
The antibacterial and antifungal activities of the ligand and its metal complexes were screened on bacterial and fungal strains using the disk diffusion method. It is impor- tant to note that the ligands and their metal complexes exhibit antifungal and antibacterial inhibitory effects than
parent ligands and the solution of metal ions. Most of metal complexes exhibit more antifungal activity than standard antifungal drug (amphotricene B). It is also clear that the ligand and its metal complexes have more anti- fungal activity than antibacterial activity. The inhibition zone diameter of the compounds is shown in Figs. 8 and 9.
The order of antifungal activity of the compounds is (14)>(10)>(4)>(2=(22)>(3)>(20)=(24)>(6)=(8)=(21)>(2 3)>(H2L1)=(11)>(Amphotricene B)>(15) =(H2L2), how- ever, the order of antibacterial activity of the compounds is Tetracycline>(21)>(8)=(20)>(3)>(14)=(15)=(22)=(23)>(2)=
(4)>(11)>(6)>(24)>(10)=(H2L2)>(H2L1). The increased activity of the metal complexes can be explained on the basis of chelation theory.53 It is known that the chelation tends to make the ligand act as more powerful and potent fungicidal and bactericidal agents, thus killing more fungi and bacteria than the ligand. It is known that, in a com-
Fig. 8. Antifungal activity of the ligand and its metal complexes against Fungus (Aspergillums Niger).
Fig. 9. Antibacterial activity of the ligands and their metal complexes against gram-negative bacterium (E. coli).
plex, the positive charge of the metal is partially shared with the donor atoms present in the ligands, and there may be π-electron delocalization over the whole chelating sys- tem.54 This increases the lipophilic character of the metal chelate and favors its permeation through the lipoid layer of the membranes. There are other factors which also increase the activity, which are solubility, conductivity, coordination mode and bond length between the metal and the ligand. The variation in the effectiveness of dif- ferent compound against different organisms also depends either on the impermeability of the cell of the microbes or differences in ribosomes of microbial cells.55,56 The vari- ation of biological activity of the complexes may be due to change in electronic configuration of the metal and also, the environment around the metal ion.
REFERENCES
1. Singh, V. P.; Katiyar, A.; Singh, S. Biometals, 2008, 21, 491.
2. Singh, V. P.; Katiyar, A.; Singh, S. J. Coord. Chem. 2009, 62(8), 1336.
3. Sharma, K. V.; Sharma, V.; Dubey, R. K.; Tripathi, U.N.
J. Coord. Chem. 2009, 62(3), 493.
4. Ibrahim, K. M.; Gabr, I. M.; Abu El-Reash, G. M.; Zaky, R. R. Monatsh Chem. 2009, 140, 625.
5. Küçükgüzel . G.; Mazi, A.; Sahin, F.; Öztürk, S.; Stables, J. Eur. J. Med. Chem. 2003, 38, 1005.
6. Melnyk, P.; Leroux, V.; Sergheraert, C.; Grellier, P.;
Bioorg. Med. Chem. Lett. 2006, 16, 31.
7. Lima, P. C.; Lima, L. M.; da Silva, K. C. M.; Léda, P. H.;
de Miranda, O. A. L. P., Fraga, C. A. M.; Barreiro, E. J.
Eur. J. Med. Chem. 2000, 35, 187.
8. Cunha, A. C.; Figueiredo, J. M.; Tributino, J. L. M.;
Miranda, A. L. P.; Castro, H. C.; Zingali, R. B.; Fraga, C.
A. M.; de Souza, M. C.; Ferreira, V. F.; Barreiro, E. J.
Bioorg. Med. Chem. 2003, 11, 2051.
9. Bedia, K. K.; Elçin, O.; Seda, U.; Fatma, K.; Nathaly, S.;
Sevim, R.; Dimoglo, A. Eur. J. Med. Chem. 2006, 41, 1253.
10. Terzioglu, N.; Gürsoy, A. Eur. J. Med. Chem. 2003, 38, 781.
11. Loncle, C.; Brunel, J. M.; Vidal, N.; Dherbomez, M.;
Letourneux, Y. Eur. J. Med. Chem. 2004, 39, 1067.
12. Guzar, S. H.; Qin-hang, J. Chem. Res. Chinese Univer- sities 2008, 24(2), 143.
13. Jang, Y. J.; Lee, U.; Koo, B. K. Bull. Korean Chem. Soc.
2005, 26, 925.
14. Cheng, P.; Liao, D.; Yan, S.; Jiang, Z.; Wang, G. Poly- hedron 1995, 14, 2355.
15. Shit, S.; Chakraborty, J.; Samanta, B.; Slawin, A. M. Z.;
Gramlich, V.; Mitra, S. Struct. Chem. 2010, 20, 633.
16. Recio Despaigne, A. A., Da Silva, J. G.; do Carmo, A. C.
M.; Piro, O. E.; Castellano, E. E.; Beraldo, H. Inorg.
Chim. Acta; 2009, 362, 2117.
17. El-Tabl, A. S.; El-Bahnasawy, R. M.; Hamdy, A. E. J.
Chem. Research, 2009, 659.
18. AbouEl-Enein, S. A.; El-Saied, F. A.; Kasher, T. I.; El- Wardany, A. H. Spectrochim. Acta Part A 2007, 67, 737.
19. Offiong, E. O.; Martelli, S. Il Farmaco, 1994, 49, 513.
20. Collee, J. G.; Duguid, J. P.; Farser, A. G.; Marmion, B. D.
(eds) “Practical Medical Microbiology” New York, Churchill Livingstone 1989.
21. Pouralimardan, O.; Chamayou, A. C.; Janiak, C.; Mon- fared, H. H. Inorg. Chim. Acta; 2006, 360, 1599.
22. Gup, R.; Kirkan, B. Spectrochim. Acta, Part A 2005, 62, 1188.
23. Maurya, M. R.; Khurana, S.; Schulzke, C.; Rehder, D.
Eur. J. Inorg. Chem. 2001, 779.
24. Kumar, K. N.; Ramesh, R. Polyhedron, 2005, 24, 1885.
25. Ismail, K. Z. Trans. Met. Chem. 2000, 25, 522.
26. Ghosh, T.; Roy, A.; Bhattacharya, S.; Banerjee, S. Trans.
Met. Chem. 2005, 30, 419.
27. Tossidis, A.; Bolos, C. A. Inorg. Chim. Acta. 1986, 112, 93.
28. Abd El-Wahab, Z. H.; Mashaly, M. M.; Salman, A. A.;
El-Shetary, B. A.; Faheim, A. A. Spectrochim. Acta Part A 2004, 60, 2861.
29. Nakamto, K. “Infrared and Raman spectra of inorganic and coordination compounds” 3rd Ed. John Wiley sons, New York 1977 p. 244-247.
30. Gupta, L. K.; Bansal, U.; Chandra, S. Spectrochim. Acta A 2007, 66, 972.
31. Paschalidis, D. G.; Tossidis, I. A.; Gdanie, M. Polyhedron 2000, 19, 2629.
32. Wang, B.-D.; Yang, Z.-Y.; Qin, D.-D.; Chen, Z. N. J.
Photochem. Photobiology A, 2008, 194, 49.
33. Tamboura, F. B.; Diop, M.; Gaye, M.; Sall, A. S.; Barry, A. H.; Jouini, T. Inorg. Chem. Comm. 2003, 6, 1004.
34. Remya, P. N.; Suresh, C. H.; Reddy, M. L. P. Polyhedron, 2007, 26, 5016.
35. El-Tabl, A. S.; El-Saied, F. A.; Al-Hakimi, A. N. Trans.
Met. Chem. 2007, 32, 689.
36. Abd El-Wahab, Z. H.; Mashaly, M. M.; Salman, A. A.;
El-Shetary, B. A.; Faheim, A. A. Spectrochim. Acta A 2004, 60, 2861.
37. Kurto_glu, M.; Da_gdelen, M. M.; Toro_glu, S. Trans.
Met. Chem. 2006, 31, 382.
38. P-Costa, B. S.; Piro, O. E.; Diez, R. P.; Castellano, E. E.;
G-Baro, A. C. Polyhedron 2006, 25, 2920.
39. Maurya, R. C. Rajput, S., J. Mol. Struct. 2007, 833, 133.
40. Geaey, W. J. Coord. Chem. Rev. 1971, 7, 81.
41. Greenwood, N. N.; Straughan, B. P.; Wilson, A. E. J. Chem.
Soc. A, 1968, 2209.
42. Fouda, M. F. R.; Abd-Elzaher, M. M.; Shakdofa, M. M.
E.; El Saied, F. A.; Ayad, M. I.; El Tabl, A. S. J. Coord.
Chem. 2008, 61, 1983.
43. Lever, A. B. P. “Inorganic Electronic Spectroscopy” El- Sevier Amsterdam, 1968.
S¸
44. Jadeja, R. N.; Shah, J. R. Polyhedron 2007, 26, 1677.
45. Bastos, A. M. B.; Da Silva, J. G.; Da Maia, P. I. S.; Deflon, V. M.; Batista, A. A.; Ferreira, A. V.; Botion, L. M.; Niquet, E.; Beraldo, H. Polyhedron 2008, 27, 1787.
46. Al-Hakimi, A. N.; El-Tabl, A. S.; Shakdofa, M. M. E. J.
Chem. Research, 2009, 770.
47. Gandhi, J. B.; Kulkarni, N. D. Trans. Met. Chem. 2001, 26, 96.
48. Singh, H. L. Spectrochim. Acta Part A 2010, 76, 253.
49. El-Asmy, A. A.; El-Gammal, O. A.; Radwan, H. A. Spec- trochim. Acta A 2010, 76, 496.
50. Li Zhang, X., Z. Y.; Song, H. B. J. Mole. Struct. 2005, 751, 33.
51. Paschalidisa, D. G.; Tossidis, I. A.; Gdanie, M.; Kumar, D. S.; Alexander, V. Inorg. Chim. Acta 1995, 238, 63.
52. Pandey, O. P.; Sengupta, S. K.; Tripathi, C. M. Molecules, 2005, 10(6), 653.
53. El-Wahab, Z. H.; Mashaly, M. M.; Salman, A. A.; El-Shetary, B. A.; Fahei, A. A. Spectrochim. Acta Part A 2004, 60, 2861.
54. Sengupta, S. K.; Pandey, O. P.; Srivastava, B. K.; Sharma, V. K. Trans. Met. Chem., 1998, 23, 349.
55. Glu, M. K.; Ispir, E.; Glu, N. K.; Glu, S. T.; Serin, S.
Trans. Met. Chem., 2005, 30, 765.
56. Glu, M. K.; Gdelen, M. M. D.; Glu, S. T. Trans. Met. Chem., 2006, 31, 382.