ISSN 2234-3806 • eISSN 2234-3814
https://doi.org/10.3343/alm.2017.37.1.9
Morning Spot Urine Glucose-to-Creatinine Ratios Predict Overnight Urinary Glucose Excretion in Patients With Type 2 Diabetes
So Ra Kim, M.D.1,2,*, Yong-ho Lee, M.D.1,2,*, Sang-Guk Lee, M.D.3, Sun Hee Lee, B.S.2, Eun Seok Kang, M.D.1,2, Bong-Soo Cha, M.D.1,2, Hyun Chul Lee, M.D.1,2, Jeong-Ho Kim, M.D.3, and Byung-Wan Lee, M.D.1,2
Division of Endocrinology and Metabolism1, Department of Internal Medicine, Graduate School, Yonsei University College of Medicine; Diabetes Center2, Severance Hospital; Department of Laboratory Medicine3, Yonsei University College of Medicine, Seoul, Korea
Background: With the advent of sodium glucose co-transporter 2 inhibitors to control glu- cose and treat diabetes, laboratory data aided by either timed or spot glucose levels in the urine could be used as an alternative marker of drug response. The aim of this study was to assess the agreement between overnight urinary glucose excretion (UGE) and morning spot urinary glucose-to-creatinine ratio (UGCR).
Methods: In this prospective cross-sectional study, we enrolled a total of 215 participants with either normal glucose tolerance (NGT), pre-diabetes, or type 2 diabetes mellitus (T2DM).
To exclude external factors such as food intake and physical activity, urine samples col- lected overnight at an 8-hr interval and the first-voided morning spot urine were collected and compared.
Results: The median values of overnight 8-hr UGE in participants with NGT (N=14), pre- diabetes (N=41), and T2DM (N=160) were 35.0 mg, 35.6 mg, and 653.4 mg, respec- tively. In participants with T2DM, the median values of overnight 8-hr UGCR and first-voided morning spot UGCR (M-UGCR) were 1.37 mg/mg and 0.16 mg/mg, respectively. Quanti- tative analyses using an intraclass correlation coefficient (ICC) demonstrated a good reli- ability of measurement of the overnight 8-hr UGCR and M-UGCR (ICC=0.943, P <0.001).
The M-UGCR was also significantly related to the overnight 8-hr UGE (r=0.828, P <0.001).
Conclusions: M-UGCR and overnight 8-hr UGCR showed good agreement, suggesting that M-UGCR be used as a simple index for estimating overnight amounts of UGE in pa- tients with T2DM.
Key Words: Type 2 diabetes mellitus, Urinary glucose excretion, Urinary glucose-to-creati- nine ratio
Received: May 15, 2016 Revision received: June 20, 2016 Accepted: September 28, 2016 Corresponding author: Byung-Wan Lee Department of Internal Medicine, Yonsei University College of Medicine, 50-1, Yonsei-ro, Seodaemun-gu, Seoul 03722, Korea
Tel: +82-2-2228-1938 Fax: +82-2-393-6884 E-mail: [email protected]
* These authors contributed equally to this work.
© The Korean Society for Laboratory Medicine This is an Open Access article distributed under the terms of the Creative Commons Attribution Non-Commercial License (http://creativecom- mons.org/licenses/by-nc/4.0) which permits unrestricted non-commercial use, distribution, and reproduction in any medium, provided the original work is properly cited.
INTRODUCTION
Glycosuria, the excretion of glucose in the urine, nearly always results from elevated plasma glucose levels, except for rare ab- normalities in glucose reabsorption within the tubules. Elevated urine glucose concentration therefore indicates either the pres- ence of hyperglycemia or a defect in tubular function [1]. Diag-
nosing diabetes or monitoring glycemic control by assessing the amount of urinary glucose has been replaced by more reliable and accurate blood or plasma glycemic indices. Glycated hemo- globin (HbA1c) levels, commonly used as the gold standard for glycemic index, exhibit a fairly good correlation with fasting plasma glucose in a single specimen and 24-hr urinary glucose secre- tion [2-4], which in turn helps to achieve target glycemic goals.
The recent advent of sodium-glucose co-transporter 2 (SGLT2) inhibitors, which prevent glucose reabsorption from renal proxi- mal tubules, promoting urinary glucose excretion (UGE) and decreasing plasma glucose levels [5], adds to the wide range of pharmacotherapeutic options for treating patients with diabetes.
Considering the pharmacokinetics of SGLT2 inhibitors, during the use of these drugs in diabetic patients, the traditional posi- tive relationship between levels of blood or plasma glycemic in- dices and the concentration or amount of secreted urinary glu- cose cannot be applied. The pharmacological effects of SGLT2 inhibitors include increased UGE and improvements in blood glucose indices [6, 7]. Therefore, collecting and assessing either timed or spot glucose levels in the urine in conjunction with HbA1c levels might be of use as an alternative marker of drug response when prescribing an SGLT2 inhibitor for glycemic con- trol. A 24-hr urine collection, however, can be bothersome to perform and is largely influenced by food intake. In contrast, overnight urine collections might exclude external factors, such as food intake, and solely be influenced by renal gluconeogene- sis in the post-absorptive state [8]. Nevertheless, no published data address whether glucose in a morning spot urine collection reflects the total amount of glucose excretion during the over- night period.
In this study, we aimed to investigate whether the first voided morning spot urinary glucose-to-creatinine ratio (M-UGCR) can predict overnight 8-hr urinary glucose-to-creatinine ratio (UGCR), and determine correlations between overnight UGE and other glucometabolic parameters in Korean patients with type 2 dia- betes mellitus (T2DM).
METHODS 1. Study population
In this prospective cross-sectional study, we enrolled participants with either normal glucose levels, pre-diabetes, or T2DM, who had newly visited the Severance Hospital Diabetes Center be- tween May 2014 and May 2015. Participants who met the fol- lowing criteria were excluded: 1)<20 or ≥80 yr of age; 2) hav- ing type 1 diabetes; 3) organ transplantation recipients; 4) esti- mated glomerular filtration rate (eGFR)<60 mL/min/1.73 m2; 5) currently taking an SGLT2 inhibitor; and 6) pregnant wo men. We classified participants into three groups: those with normal glu- cose tolerance (NGT), pre-diabetes, and T2DM. NGT was de- fined as a fasting plasma glucose<5.6 mmol/L and HbA1c <5.7%
(38.8 mmol/mol). Pre-diabetes was defined as a fasting plasma glucose of 5.6-6.9 mmol/L or HbA1c of 5.7-6.4% (38.8-46.4
mmol/mol). T2DM was defined on the basis of 1) the participant’s use of insulin or oral hypoglycemic agents, 2) fasting plasma glucose ≥7.0 mmol/L, or 3) HbA1c ≥6.5% (47.5 mmol/mol). A total of 215 participants (mean age 55±13 yr) were enrolled in this study. Baseline demographic and laboratory characteristics of the participants are shown in Table 1. The age and gender distributions were similar among the three groups. In the group with T2DM, the average duration of diabetes and HbA1c were 5.8±6.6 yr and 7.45 (6.70-9.00)% (57.9 [49.7-74.9] mmol/ mol), respectively, and basal and stimulated insulin and C-peptide levels did not significantly differ between the groups. The post- prandial C-peptide-to-glucose ratio (PCGR) value, a well-vali- dated marker of insulin secretory function, significantly decre- ased in the T2DM group (2.23 [1.36-3.54]), compared with the NGT and pre-diabetes groups (3.76 [2.92-5.58] and 3.99 [3.33- 5.41], respectively, P <0.001). The values of homeostatic model assessment of insulin resistance (HOMA-IR) increased with in- creasing severity of diabetes status (1.06 [0.82-1.72], 1.76 [1.31- 3.38], and 2.76 [1.68-5.09], respectively, P <0.001). Kidney function indices were not significantly different between groups.
Written informed consent was obtained from all participants be- fore the study, and the Ethics Committee of the Yonsei Univer- sity College of Medicine approved the study protocol (4-2014- 0220).
2. Measurements of blood glucometabolic parameters
After overnight fasting, blood samples were collected before (0 min; designated as basal) and after (90 min; designated as sti- mulated) ingestion of a standardized mixed-meal (Mediwell Dia- betic Meal, [Maeil Dairies Co., Yeongdong-gun, Chungbuk, Ko- rea] 2 cans; total 400 mL, 400 kcal, 18 g fat, 44 g carbohydrate, and 20 g protein) to measure glucose, insulin/C-peptide, and other parameters. Pancreatic beta cell function and insulin sen- sitivity were assessed by using the following indices [9]: Homeo- static model assessment of pancreatic β-cell function (HOMA-β)=[(basal insulin [pM]×0.48)/(basal glucose [mM]-3.5)]; HOMA- IR=[(basal insulin [pM] × glucose [mM]) / 156.3]; C-peptide increment (∆C-peptide=[stimulated C-peptide (pmol/mL)-basal C-peptide (pmol/mL)]; and insulin increment (∆insulin=[stimul- at ed insulin (pmol/L)-basal insulin (pmol/L)]. PCGR was defined as follows [10]: [(stimulated C-peptide [ng/mL]/stimulated glu- cose [mg/dL])×100]. The eGFR was derived from the Chronic Kidney Disease Epidemiology Collaboration (CKD-EPI) creati- nine-based equation [11]. HbA1c was measured by using an immunoassay on an Integra 800 CTS instrument (Roche, Her- cules, CA, USA). Serum glycated albumin (GA) levels were de-
termined by an enzymatic method (LUCICA GA-L, Asahi Kasei Pharma Co., Tokyo, Japan), by using a Hitachi 7600 P module auto-analyzer (Hitachi Instruments Service, Tokyo, Japan). Se- rum insulin and C-peptide were measured by an electrochemi- luminescence immunoassay with a Cobas 600 e501 analyzer (Roche Diagnostics, Basel, Switzerland). Urine glucose level was measured by the hexokinase method, by an AU680 chemistry analyzer (Beckman Coulter, Brea, CA, USA).
3. Measurements of urinary glucometabolic parameters
To exclude external factors like food intake on glucose homeo- stasis, participants were advised to fast after dinner, except for water, and an overnight 8-hr urine sample from bedtime (ap- proximately 10 P.M.) to the first-voided morning urine was col- lected. An 8-10-mL urine volume from the first-voided morning urine was separately collected for the first-voided morning spot urine analysis (See Supplemental Data Figure S1). The sam- pling day for the morning urine was the same one as for blood sampling for the standardized mixed-meal tolerance test. Uri- Table 1. Baseline demographic and laboratory characteristics of participantsBaseline characteristics Normal glucose tolerance
(N=14) Pre-diabetes
(N=41) T2DM
(N=160) P values
Demographics
Age (yr) 48.2±15.0 53.2±12.4 55.4±12.4 0.078
Men, n (%) 7 (53.3) 20 (47.6) 88 (54.7) 0.715
Duration of diabetes (yr) 5.80±6.60
Antidiabetic drug use
No, n (%) 66 (41.3)
Metformin, n (%) 64 (40.0)
Insulin, n (%) 14 (8.8)
Glycemic indices
Basal glucose (mmol/L) 5.14 (4.96-5.29) 6.00 (5.58-6.53) 7.92 (6.79-10.1) <0.001
Stimulated glucose (mmol/L) 6.44 (5.15-6.89) 7.78 (6.53-8.72) 12.0 (9.65-14.3) <0.001
Glycated albumin (%) 13.1 (12.2-14.0) 14.0 (13.0-15.3) 19.0 (16.0-24.0) <0.001
HbA1C (%) 5.60 (5.50-5.83) 5.80 (5.63-6.00) 7.45 (6.70-9.00) <0.001
HbA1C (mmol/mol) 37.7 (36.6-40.2) 39.9 (38.0-42.1) 57.9 (49.7-74.9) <0.001
Urinary glycemic indices
Overnight 8-hr UGE (mg) 35.0 (21.7-63.8) 35.6 (22.7-84.6) 653.4 (53.6-9136.5) <0.001
Overnight 8-hr UGCR (mg/mg) 0.06 (0.04-0.08) 0.07 (0.05-0.16) 1.37 (0.10-21.4) <0.001
M-UGCR (mg/mg) 0.05 (0.04-0.07) 0.06 (0.04-0.08) 0.16 (0.07-8.01) <0.001
Insulin secretory/resistant indices
Basal insulin (pmol/L) 28.3 (21.0-46.2) 36.5 (30.0-73.4) 43.1 (28.9-71.4) 0.102
Stimulated insulin (pmol/L) 125.7 (88.1-302.2) 241.6 (153.5-310.3) 174.9 (108.5-306.4) 0.072
Basal C-peptide (nmol/L) 0.55 (0.43-0.72) 0.67 (0.53-0.91) 0.72 (0.55-0.99) 0.056
Stimulated C-peptide (nmol/L) 1.36 (1.00-2.26) 1.81 (1.53-2.28) 1.50 (1.18-2.13) 0.049
∆Insulin (pmol/L) 105.3 (63.8-268.5) 188.6 (116.9-240.4) 118.6 (68.0-238.2) 0.052
∆C-peptide (nmol/L) 0.86 (0.55-1.54) 1.10 (0.89-1.56) 0.77 (0.45-1.34) 0.011
PCGR 3.76 (2.92-5.58) 3.99 (3.33-5.41) 2.23 (1.36-3.54) <0.001
HOMA-IR 1.06 (0.82-1.72) 1.76 (1.31-3.38) 2.76 (1.68-5.09) <0.001
HOMA-β 64.8 (45.5-101.2) 52.9 (38.2-86.8) 31.9 (20.9-54.8) <0.001
Renal function indices
Creatinine (µmol/L) 67.2 (56.1-84.6) 69.0 (52.6-80.4) 65.4 (54.8-74.0) 0.381
eGFR (mL/min/1.73 m2) 100.3±12.5 97.7±14.9 98.3±14.8 0.834
Continuous variables were described as mean±SD for parametric variables and median (interquartile range) for nonparametric variables.
Abbreviations: T2DM, type 2 diabetes mellitus; HbA1C, glycated hemoglobin; UGE, urinary glucose excretion; UGCR, urinary glucose-to-creatinine ratio; M- UGCR, first-voided morning spot UGCR; PCGR, postprandial C-peptide-to-glucose ratio; HOMA-IR, homeostatic model assessment of insulin resistance;
HOMA-β, homeostatic model assessment of pancreatic β-cell function; eGFR, estimated glomerular filtration rate.
nary glucose, sodium, albumin, and creatinine levels were also measured for each sample. Urinary glycemic indices were cal- culated as follows: 1) overnight 8-hr UGE (mg)=[(overnight 8-hr urine glucose [mg/dL]×overnight 8-hr urine volume [mL])/100];
2) overnight 8-hr UGCR (mg/mg)=[overnight 8-hr urine glucose (mg/dL)/overnight 8-hr urine creatinine (mg/dL)]; and 3) M-UGCR (mg/mg)=[first-voided morning spot urine glucose (mg/dL)/first- voided morning spot urine creatinine (mg/dL)]. We also calcu- lated overnight 8-hr and first-voided morning spot (M-) urinary sodium-to-creatinine ratios (UNCRs), which showed good agree- ment with each other in a previous study [12], for calculating the correlation coefficient with UGCR. Overnight 8-hr albumin- to-creatinine ratios (ACRs) were calculated for each of the over- night 8-hr urine samples, as [(overnight 8-hr urinary albumin
excretion [mg/dL]/overnight 8-hr urinary creatinine excretion [mg/dL])×1,000] and dividing by 8.84 to convert the units (from mg/g to mg/mmol), to classify the participants into normo-, mi- cro-, and macroalbuminuria groups: normoalbuminuria, over- night 8-hr ACR <3.4 mg/mmol; microalbuminuria, 3.4 ≤over- night 8-hr ACR <34 mg/mmol; and macroalbuminuria, over- night 8-hr ACR ≥34 mg/mmol.
4. Statistical analyses
All statistical analyses were performed by using SPSS version 20.0 for Windows (IBM Corp., Armonk, NY, USA) and PASS (ver- sion 12, NCSS, LLC, Kaysville, UT, USA). The characteristics of the study participants were analyzed according to their diabetes status by a one-way ANOVA or Kruskal-Wallis test for continu-
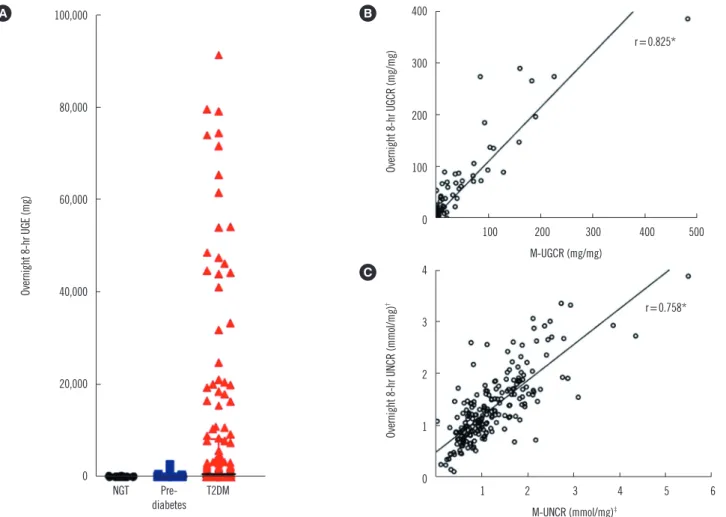
Fig. 1. Overnight 8-hr UGE and UGCR. (A) Distribution of overnight 8-hr UGE values. Outliers of overnight 8-hr UGE above 100,000 mg (N
= 2) were excluded in the graph. (B, C) Comparison of the correlation coefficient values between UGCRs and UNCRs.
*P <0.001; †Overnight 8-hr urinary sodium-to-creatinine ratio (UNCR)=overnight 8-hr urinary sodium excretion (mmol/L)/overnight 8-hr urinary creatinine excretion (mg/dL); ‡First-voided morning spot UNCR (M-UNCR) =first-voided morning spot urinary sodium excretion (mmol/L)/first-voided morning spot urinary creatinine excretion (mg/dL).
Abbreviations: UGE, urinary glucose excretion; UGCR, urinary glucose-to-creatinine ratio; M-UGCR, first-voided morning spot UGCR; NGT, normal glucose tolerance; T2DM, type 2 diabetes mellitus.
100,000
80,000
60,000
40,000
20,000
0
NGT Pre-
diabetes T2DM
Overnight 8-hr UGE (mg)
400
300
200
100
0 100 200 300 400 500
M-UGCR (mg/mg)
Overnight 8-hr UGCR (mg/mg)
B
r=0.825*
4
3
2
1
0 1 2 3 4 5 6
M-UNCR (mmol/mg)‡
Overnight 8-hr UNCR (mmol/mg)†
C
r=0.758*
A
ous variables and a χ2 test for categorical variables. Continuous variables are presented as the mean±SD for normally distrib- uted continuous variables and median (interquartile range) for non-normally distributed continuous variables. Categorical data are expressed as numbers and percentages. The correlation between the M-UGCR and overnight 8-hr UGCR was determined by calculating the Spearman’s correlation coefficient. Correlation statistics were interpreted as slight (0-0.2), fair ( >0.2 to 0.4), moderate (>0.4 to 0.6), substantial (>0.6 to 0.8), and almost perfect (>0.8) agreement [13]. The reliability of measurements between the M-UGCR and overnight 8-hr UGCR was analyzed by calculating the intraclass correlation coefficient (ICC). A Bland- Altman plot was used to assess the agreement between M-UGCR and overnight 8-hr UGCR. A Spearman’s correlation analysis was performed to determine the correlation between UGCRs and other parameters. Backward multiple linear regression anal- ysis was performed for modeling the relationship between over- night 8-hr UGE or M-UGCR and demographic, glycemic, insulin secretory/resistant, and biochemical parameters. All P values<
0.05 were considered statistically significant.
RESULTS
1. Urinary glycemic indices of study participants
In the group with T2DM, the values of overnight 8-hr UGE showed a marked variation ranging from 5 mg to 151,000 mg (Fig. 1A).
The median values of overnight 8-hr UGE in participants with NGT (N=14), pre-diabetes (N=41), and T2DM (N=160) were 35.0 mg, 35.6 mg, and 653.4 mg, respectively. In participants with T2DM, the median values of overnight 8-hr UGCR and M- UGCR were 1.37 mg/mg and 0.16 mg/mg, respectively.
2. Correlation between overnight 8-hr UGCR and M-UGCR
Spearman’s correlation analyses determined that M-UGCR show ed an almost perfect positive relationship with overnight 8-hr UGCR (r =0.825, P <0.001; Fig. 1B). We also calculated overnight 8-hr UNCR and M-UNCR, which are well known to exhibit good agreement with each other, for comparing the correlation coeffi- cient with that of UGCRs [12]. The value of Spearman’s r was 0.758 between UNCRs (P <0.001) in our study population (Fig.1C). Therefore, the statistical association of M-UGCR with over- night 8-hr UGCR was stronger than that of UNCRs. ICCs were calculated to assess the reliability of measurements between M- UGCR and overnight 8-hr UGCR (Table 2). The ICC value was 0.945 (95% confidence interval [CI] 0.923-0.960; P <0.001) for all participants. Among diabetes status subgroups, the cor- relation between M-UGCR and overnight 8-hr UGCR was statis- tically significant only in T2DM (ICC=0.943, 95% CI 0.914-0.961;
Table 2. Intraclass correlation coefficient (ICC) between the over- night 8-hr UGCR and M-UGCR
Subgroups ICC (95% CI) between overnight 8-hr UGCR and M-UGCR All participants (N=215) 0.945* (0.923-0.960) Diabetes status
Normal glucose tolerance (N=14) 0.155 (-1.368-0.719)
Pre-diabetes (N=41) 0.049 (-0.674-0.476)
T2DM (N=160) 0.943* (0.914-0.961)
Subgroup by albuminuria status
Normoalbuminuria (N=111) 0.948* (0.921-0.966) Microalbuminuria (N=40) 0.909* (0.810-0.954) Macroalbuminuria (N=9) 0.989* (0.948-0.998) Subgroup by HbA1c, % (mmol/mol)
<7 (<53) (N=55) 0.951* (0.914-0.972) 7-9 (53-75) (N=67) 0.914* (0.818-0.955) >9 (>75) (N=38) 0.925* (0.837-0.963) Normoalbuminuria, overnight 8-hr ACR <3.4 mg/mmol; microalbuminuria, 3.4 ≤overnight 8-hr ACR <34 mg/mmol; macroalbuminuria, overnight 8-hr ACR ≥34 mg/mmol.
*P <0.001.
Abbreviations: UGCR, urinary glucose-to-creatinine ratio; M-UGCR, first- voided morning spot UGCR; T2DM, type 2 diabetes mellitus; HbA1C, glycat- ed hemoglobin; ACR, albumin-to-creatinine ratio; CI, confidence interval.
200
150
100
50
0
-50
-100
0 100 200 300 400 500 ([Overnight 8-hr UGCR] + [M-UGCR])/2 (mg/mg)
[Overnight 8-hr UGCR] - [M-UGCR] (mg/mg)
+2 SD Mean
-2 SD 51.4
6.30
-38.8
Fig. 2. Bland-Altman plot for assessing the agreement between the overnight 8-hr UGCR and M-UGCR.
Abbreviations: UGCR, urinary glucose-to-creatinine ratio; M-UGCR, first- voided morning spot UGCR.
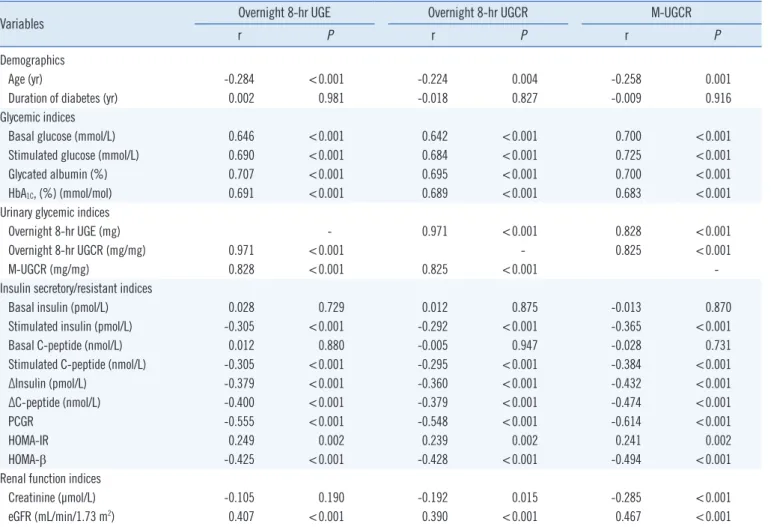
Table 3. Correlation between UGE or UGCRs and other parameters in T2DM (N=160)
Variables Overnight 8-hr UGE Overnight 8-hr UGCR M-UGCR
r P r P r P
Demographics
Age (yr) -0.284 <0.001 -0.224 0.004 -0.258 0.001
Duration of diabetes (yr) 0.002 0.981 -0.018 0.827 -0.009 0.916
Glycemic indices
Basal glucose (mmol/L) 0.646 <0.001 0.642 <0.001 0.700 <0.001
Stimulated glucose (mmol/L) 0.690 <0.001 0.684 <0.001 0.725 <0.001
Glycated albumin (%) 0.707 <0.001 0.695 <0.001 0.700 <0.001
HbA1C, (%) (mmol/mol) 0.691 <0.001 0.689 <0.001 0.683 <0.001
Urinary glycemic indices
Overnight 8-hr UGE (mg) - 0.971 <0.001 0.828 <0.001
Overnight 8-hr UGCR (mg/mg) 0.971 <0.001 - 0.825 <0.001
M-UGCR (mg/mg) 0.828 <0.001 0.825 <0.001 -
Insulin secretory/resistant indices
Basal insulin (pmol/L) 0.028 0.729 0.012 0.875 -0.013 0.870
Stimulated insulin (pmol/L) -0.305 <0.001 -0.292 <0.001 -0.365 <0.001
Basal C-peptide (nmol/L) 0.012 0.880 -0.005 0.947 -0.028 0.731
Stimulated C-peptide (nmol/L) -0.305 <0.001 -0.295 <0.001 -0.384 <0.001
∆Insulin (pmol/L) -0.379 <0.001 -0.360 <0.001 -0.432 <0.001
∆C-peptide (nmol/L) -0.400 <0.001 -0.379 <0.001 -0.474 <0.001
PCGR -0.555 <0.001 -0.548 <0.001 -0.614 <0.001
HOMA-IR 0.249 0.002 0.239 0.002 0.241 0.002
HOMA-β -0.425 <0.001 -0.428 <0.001 -0.494 <0.001
Renal function indices
Creatinine (µmol/L) -0.105 0.190 -0.192 0.015 -0.285 <0.001
eGFR (mL/min/1.73 m2) 0.407 <0.001 0.390 <0.001 0.467 <0.001
Abbreviations: T2DM, type 2 diabetes mellitus; UGE, urinary glucose excretion; UGCR, urinary glucose-to-creatinine ratio; M-UGCR, first-voided morning spot UGCR; HbA1C, glycated hemoglobin; PCGR, postprandial C-peptide-to-glucose ratio; HOMA-IR, homeostatic model assessment of insulin resistance;
HOMA-β, homeostatic model assessment of pancreatic β-cell function; eGFR, estimated glomerular filtration rate.
P <0.001). Moreover, regardless of the severity of albuminuria or glycemic control, M-UGCR and overnight 8-hr UGCR display ed good measurement reliability in participants with T2DM. A Bland- Altman plot showed that M-UGCR tended to underestimate over- night 8-hr UGCR (Fig. 2). We drew a calculation formula for 8-hr UGCR using M-UGCR by simple linear regression analysis. We propose the following formula:
8-hr UGCR (mg/mg)=1.22×M-UGCR (mg/mg)+3.30
3. Correlations between UGCRs and Other Parameters in T2DM
Correlations between overnight 8-hr M-UGCR and UGE, as well as other clinico-biochemical parameters are shown in Table 3.Age was negatively correlated with all UGCRs and UGE. Glyce- mic indices, including basal and stimulated glucose, GA, and HbA1c, showed a substantial positive correlation with UGCRs and UGE. Regarding insulin secretory/resistant indices, stimu-
lated insulin and C-peptide, ∆insulin, ∆C-peptide, PCGR, and HOMA-β, factors associated with insulin secretory capacity, showed fair to substantial negative linear relationships with UGCRs and UGE. The value of eGFR showed a moderate positive correlation with UGCRs and UGE. A sample size of 160 achieved 99.9999%
power in detecting a difference of -0.328 between the null hy- pothesis correlation of 0.50 (derived from the previous study [12] for correlations between spot and 24-hr urinary sodium ex- cretions) and the alternative hypothesis correlation of 0.828 (the correlation coefficient between M-UGCR and overnight 8-hr UGE) by a two-sided hypothesis test with a significance level of 0.05 [14-16].
4. Determinants of overnight 8-hr UGE or M-UGCR in T2DM by multiple linear regression analysis
To clarify independent relationships between clinico-biochemi-
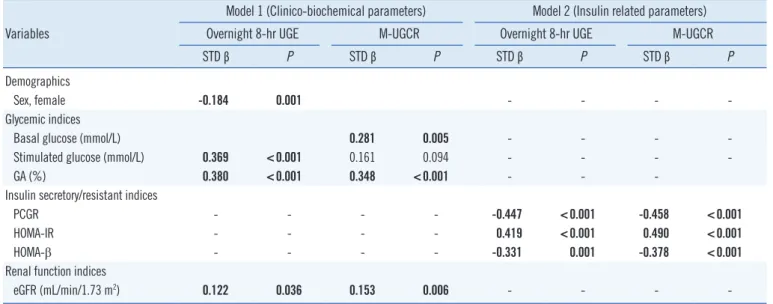
Table 4. Multiple linear regression models for overnight 8-hr UGE or M-UGCR in T2DM Variables
Model 1 (Clinico-biochemical parameters) Model 2 (Insulin related parameters)
Overnight 8-hr UGE M-UGCR Overnight 8-hr UGE M-UGCR
STD β P STD β P STD β P STD β P
Demographics
Sex, female -0.184 0.001 - - - -
Glycemic indices
Basal glucose (mmol/L) 0.281 0.005 - - - -
Stimulated glucose (mmol/L) 0.369 <0.001 0.161 0.094 - - - -
GA (%) 0.380 <0.001 0.348 <0.001 - - -
Insulin secretory/resistant indices
PCGR - - - - -0.447 <0.001 -0.458 <0.001
HOMA-IR - - - - 0.419 <0.001 0.490 <0.001
HOMA-β - - - - -0.331 0.001 -0.378 <0.001
Renal function indices
eGFR (mL/min/1.73 m2) 0.122 0.036 0.153 0.006 - - - -
Logarithm-transformed values of overnight 8-hr UGE and M-UGCR were used for analysis.
Model 1: adjusted for age, sex, duration of diabetes, basal glucose, stimulated glucose, GA, HbA1C, and eGFR.
Model 2: adjusted for PCGR, ∆Insulin, ∆C-peptide, HOMA-IR, and HOMA-β.
Bold values indicate statistical significance.
Abbreviations: T2DM, type 2 diabetes mellitus; UGE, urinary glucose excretion; M-UGCR, first-voided morning spot urinary glucose-to-creatinine ratio; STD, standardized; PCGR, postprandial C-peptide-to-glucose ratio; GA, glycated albumin; HOMA-IR, homeostatic model assessment of insulin resistance;
HOMA-β, homeostatic model assessment of pancreatic β-cell function; eGFR, estimated glomerular filtration rate; HbA1C, glycated hemoglobin.
cal variables and overnight 8-hr UGE or M-UGCR in T2DM par- ticipants, we performed multiple linear regression analyses (Ta- ble 4). The analyses were performed separately for two models:
In model 1, we entered clinico-biochemical parameters, includ- ing age, sex, duration of diabetes, basal glucose, stimulated glu- cose, GA, HbA1c, and eGFR, as independent factors and over- night 8-hr UGE as a dependent factor. Female sex (standard- ized [STD] β=-0.184, P =0.001), stimulated glucose level (STD β=0.369, P <0.001), GA (STD β=0.380, P <0.001), and eGFR (STD β=0.122, P =0.036) were significantly associated with overnight 8-hr UGE. In model 2, with the inclusion of insulin-re- lated parameters, such as PCGR, ∆insulin, ∆C-peptide, HOMA- IR, and HOMA-β, the three measures PCGR (STD β=-0.447, P <0.001), HOMA-IR (STD β=0.419, P <0.001), and HOMA-β (STD β=-0.331, P =0.001) were significantly associated with overnight 8-hr UGE. Analyses were conducted for M-UGCR, us- ing the same independent variables, and the patterns of M-UGCR regression equations were similar to those for overnight 8-hr UGE, except for sex.
DISCUSSION
In this study, we demonstrated that M-UGCR may be used as a simple index for estimating overnight UGE (8-hr UGE) in pati-
ents with T2DM. This study demonstrated three main findings:
First, we verified that overnight 8-hr UGE or UGCR is proportion- ally elevated with aggravated glucose tolerance. Second, with respect to the intra-class correlation between overnight 8-hr UGCR and M-UGCR, almost perfect, positive significance was found only in participants with T2DM, regardless of albuminuria stage or HbA1c levels. Third, glucose levels, beta cell response to stimulation, and eGFR were associated with overnight 8-hr UGE.
To achieve optimal glycemic control in diabetes management, we hypothesized that glucose monitoring in conjunction with HbA1c is beneficial in the context of SGLT2 inhibitor treatment.
Influential variables affecting UGE include the circulating glu- cose loading to the glomeruli, glomerular capacity to filter glu- cose into the renal tubule, and albuminuria [17-19]. On the ba- sis of previous studies [17-19], we attempted to minimize the effects of glomerular filtration capacity by excluding participants who had less than 60 mL/min/1.73 m2 of eGFR, and adjusted potential variables that may influence this analysis by adopting basal/stimulated glucose, HbA1c, and GA as glucose load to glo- meruli and staged albuminuria (normo-, micro-, and macroal- buminuria) classifications. As expected, the intra-class relation- ship between 8-hr UGCR and M-UGCR was significantly corre- lated in participants with T2DM (ICCs in NGT, pre-diabetes, and
T2DM were 0.155, 0.049, and 0.943, respectively). In addition, we attempted to outline interfering effects of glucose load on glomeruli and albuminuria on the relationship between 8-hr UGCR and M-UGCR through a subgroup analysis according to albuminuria status and HbA1c levels. From these subgroup anal- yses, we found a similar correlation between 8-hr UGCR and M- UGCR as seen in all participants with T2DM. To confer the reli- ability of M-UGCR reflecting 8-hr UGCR, we generated a Bland- Altman plot, which is commonly used to compare two different instruments or two measurement techniques that each are sus- ceptible to some errors in their measurement. Based on analy- sis of the Bland-Altman plot, M-UGCR tended to underestimate overnight 8-hr UGCR. One plausible explanation for this result might be a progressive decline in glucose from midnight to morn- ing, which has been noted in continuous glucose monitoring system (CGMS) device data for Korean type diabetes [20-22].
Based on this deduction, a glucose level at the morning fasting time could be lower than the average overnight glucose level.
On the basis of the results of the correlation analyses for UGCRs and UGE in relation to clinico-biochemical variables, we per- formed multiple linear regression analyses to predict the amount of 8-hr UGE or M-UGCR in participants with T2DM. Among all demographic factors and glycemic indices, fasting or postpran- dial glucose levels and GA were significantly associated with overnight 8-hr UGE or M-UGCR. Regarding glycated protein to monitor average glucose excursion, the use of HbA1c as an indi- cator of glycemic control over a 2- to 3-month period is inferior to GA as an intermediate glycation index over a 2- to 3-week period to provide the latest information on changes in glycemic control. Since glycemic indices are mainly dependent on insulin secretory beta cell function and peripheral insulin sensitivity [23], we also conducted a multiple linear regression analysis for these variables. We found that both insulin secretory function and sen- sitivity indices were significant determinants for the amount of overnight 8-hr UGE or M-UGCR. Finally, by comparing UGCRs with UNCRs, which showed strong agreement between 8-hr and M-UGCRs, we confirmed the reliability of the novel methods.
Our study has some distinct strengths and potential limita- tions. This was a rather pioneering study to verify that M-UGCR could be used as a simple index for estimating overnight UGE in only those with T2DM, which could be a potential method to monitor the effectiveness of SGLT2 inhibitors. Additionally, we performed a standardization of glucose homeostasis markers, including insulin secretion and sensitivity, notwithstanding stim- ulated glucose, through a mixed meal tolerance test. Finally, by comparing UGCRs and UNCRs, which showed strong agree-
ment between 8-hr and M-UGCR, we conferred greater reliabil- ity of the modified method for glucose monitoring.
Regarding the limitations of our study, we did not demonstrate a clear relationship between plasma glucose concentrations and urinary glucose amounts, because we could not calculate renal threshold for glucose excretion (RTG). Since the cut-off point of maximum glucose reabsorption in the renal tubules (maximal reabsorptive capacity, TmG) is not abrupt [24], assessing RTG was impossible in this study design. Second, despite excluding the participants with less than 60 mL/min/1.73 m2 of eGFR, the glu- cose loads into the renal tubules are also the result of glomeru- lar filtration rate and glucose load in the glomerular capillaries.
We did not fully control the influence of glomerular capacity to filter glucose into the renal tubule. Third, we did not adjust for the effects of anti-diabetic drugs being prescribed, which might have an influence on insulin secretory function, peripheral insu- lin resistance, or gluconeogenesis, etc. Fourth, we did not col- lect information about the time, type, and amount of the last meals consumed by participants, which could be one of the reasons why M-UGCR underestimated overnight 8-hr UGCR.
Finally, our study did not assess differences in UGE or UGCR in patients treated with SGLT2 inhibitors, because no participant was prescribed an SGLT2 inhibitor. Further studies enrolling sub- jects taking SGLT2 inhibitors are needed.
In conclusion, despite the relative underestimation of over- night 8-hr UGCR by M-UGCR, these two parameters showed strong agreement, suggesting that M-UGCR be used as a sim- ple index for estimating the amount of UGE occurring overnight in patients with T2DM. Combined monitoring of urinary glucose levels and blood glucose indices, including HbA1c and GA, may be a better indicator of glycemic control in patients who have been prescribed SGLT2 inhibitors. Further studies are needed to understand glucose homeostasis in relation to plasma and UGE by collecting both plasma and urinary glucose concentra- tions for designated periods and calculating both RTG and TmG.
Authors’ Disclosures of Potential Conflicts of Interest
No conflicts of interest relevant to this article were reported.
REFERENCES
1. Aires I, Fila M, Polidori D, Santos AR, Costa AB, Calado J. Determina- tion of the renal threshold for glucose excretion in familial renal glucos- uria. Nephron 2015;129:300-4.
2. Tuvemo T, Ewald U, Wålinder O. Reevaluation of home urine glucose measurements in diabetic children. A computerized study of short-term control variables in the prediction of long-term diabetic control. Ups J Med Sci 1984;89:244-53.
3. Kverneland A, Kirkegaard BC, Wiesniewski J, Svendsen PA, Deckert T, Nerup J. [Evaluation of blood glucose determination and 24-hour uri- nary glucose excretion as indicators of mean blood glucose as expressed by HbA1c in patients with insulin-dependent diabetes mellitus]. Ugeskr Laeger 1986;148:1899-901.
4. Kim JM, Hong JW, Won JC, Noh JH, Ko KS, Rhee BD, et al. Glycated hemoglobin value for fasting plasma glucose of 126 mg/dL in Korean:
The 2011 Korea National Health and Nutrition Examination Survey. Dia- betes Metab J 2014;38:480-3.
5. Jung CH, Jang JE, Park JY. A novel therapeutic agent for type 2 diabe- tes mellitus: SGLT2 inhibitor. Diabetes Metab J 2014;38:261-73.
6. List JF, Woo V, Morales E, Tang W, Fiedorek FT. Sodium-glucose cotrans- port inhibition with dapagliflozin in type 2 diabetes. Diabetes Care 2009;
32:650-7.
7. Rosenstock J, Aggarwal N, Polidori D, Zhao Y, Arbit D, Usiskin K, et al.
Dose-ranging effects of canagliflozin, a sodium-glucose cotransporter 2 inhibitor, as add-on to metformin in subjects with type 2 diabetes. Dia- betes Care 2012;35:1232-8.
8. Wilding JP. The role of the kidneys in glucose homeostasis in type 2 dia- betes: clinical implications and therapeutic significance through sodium glucose co-transporter 2 inhibitors. Metabolism 2014;63:1228-37.
9. Lee YH, Kown MH, Kim KJ, Lee EY, Kim D, Lee BW, et al. Inverse asso- ciation between glycated albumin and insulin secretory function may explain higher levels of glycated albumin in subjects with longer dura- tion of diabetes. PLoS One 2014;9:e108772.
10. Lee EY, Hwang S, Lee SH, Lee YH, Choi AR, Lee Y, et al. Postprandial C-peptide to glucose ratio as a predictor of β-cell function and its use- fulness for staged management of type 2 diabetes. J Diabetes Investig 2014;5:517-24.
11. Levey AS, Stevens LA, Schmid CH, Zhang Y, Castro AF 3rd, Feldman HI, et al. A new equation to estimate glomerular filtration rate. Ann In- tern Med 2009;150:604-12.
12. Brown IJ, Dyer AR, Chan Q, Cogswell ME, Ueshima H, Stamler J, et al.
Estimating 24-hour urinary sodium excretion from casual urinary sodi- um concentrations in Western populations: the INTERSALT study. Am J Epidemiol 2013;177:1180-92.
13. Landis JR and Koch GG. The measurement of observer agreement for categorical data. Biometrics 1977;33:159-74.
14. Graybill FA, ed. An introduction to linear statistical models. Vol 1. [An].
New York McGraw-Hill, 1959.
15. Guenther WC. Desk calculation of probabilities for the distribution of the sample correlation coefficient. The American Statistician 1977;31:45-8.
16. Zar JH. Biostatistical analysis. 2nd. Englewood Cliffs, NJ: Prentice Hall, 1984.
17. Hayford JT, Weydert JA, Thompson RG. Validity of urine glucose mea- surements for estimating plasma glucose concentration. Diabetes Care 1983;6:40-4.
18. Wolf S, Rave K, Heinemann L, Roggen K. Renal glucose excretion and tubular reabsorption rate related to blood glucose in subjects with type 2 diabetes with a critical reappraisal of the “renal glucose threshold” mo- del. Horm Metab Res 2009;41:600-4.
19. Walford S, Page MM, Allison SP. The influence of renal threshold on the interpretation of urine tests for glucose in diabetic patients. Diabetes Care 1980;3:672-4.
20. Kim SK, Kim HJ, Kim T, Hur KY, Kim SW, Lee MK, et al. Effectiveness of 3-day continuous glucose monitoring for improving glucose control in type 2 diabetic patients in clinical practice. Diabetes Metab J 2014;38:
449-55.
21. Suh S, Joung JY, Jin SM, Kim MY, Bae JC, Park HD, et al. Strong corre- lation between glycaemic variability and total glucose exposure in type 2 diabetes is limited to subjects with satisfactory glycaemic control. Dia- betes Metab 2014;40:272-7.
22. Baek JH, Jin SM, Kaku K, Jung JA, Kim JR, Ko JW, et al. Efficacy of miti- glinide and sitagliptin, alone or in combination, on postprandial excur- sion and glycemic variability assessed by continuous glucose monitor- ing: a post hoc analysis with single-day treatment. Expert Opin Pharma- cother 2015;16:1127-36.
23. Lee SW, Lee S, Kim SH, Kim TH, Kang BS, Yoo SH, et al. Parameters measuring beta-cell function are only valuable in diabetic subjects with low body mass index, high blood glucose level, or long-standing diabe- tes. Yonsei Med J 2011;52:939-47.
24. Polidori D, Sha S, Ghosh A, Plum-Mörschel L, Heise T, Rothenberg P.
Validation of a novel method for determining the renal threshold for glu- cose excretion in untreated and canagliflozin-treated subjects with type 2 diabetes mellitus. J Clin Endocrinol Metab 2013;98:E867-71.
Supplemental Data Figure S1. Collection method for the overnight 8-hr and first-voided morning spot urine.
Bedtime
(10 p.m.) First-voided morning urine
Overnight 8-hr urine collection
: Voiding urine
Spot urine collection (8-10 mL)