Comparison of remnant to total functional liver volume ratio and remnant to standard liver volume ratio as a predictor
of postoperative liver function after liver resection
Hee Joon Kim, Choong Young Kim, Young Hoe Hur, Yang Seok Koh, Jung Chul Kim, Chol Kyoon Cho, and Hyun Jong Kim
Department of Surgery, Chonnam National University College of Medicine, Gwangju, Korea
Backgrounds/Aims: The future liver remnant (FLR) is usually calculated as a ratio of the remnant liver volume (RLV) to the total functional liver volume (RLV/TFLV). In liver transplantation, it is generally accepted that the ratio of the graft volume to standard liver volume (SLV) needs to be at least 30% to 40% to fit the hepatic metabolic demands of the recipient. The aim of this study was to compare RLV/TFLV versus RLV/SLV as a predictor of postoperative liver function and liver failure. Methods: CT volumetric measurements of RLV were obtained retrospectively in 74 patients who underwent right hemihepatectomy for a malignant tumor from January 2010 to May 2013. RLV and TFLV were obtained using CT volumetry, and SLV was calculated using Yu's formula: SLV (ml)=21.585×body weight (kg)0.732×height (cm)0.225. The RLV/SLV ratio was compared with the RLV/TFLV as a predictor of postoperative hepatic function. Results: Postheptectomy liver failure (PHLF), morbidity, and serum total bilirubin level at postoperative day 5 (POD 5) were increased significantly in the group with the RLV/SLV ≤30% compared with the group with the RLV/SLV >30% (p=0.002, p=0.004, and p<0.001, respectively). But RLV/TFLV was not correlated with PHLF and morbidity (p=1.000 and 0.798, respectively). RLV/SLV showed a stronger correlation with serum total bilirubin level than RLV/TFLV (RLV/SLV vs. RLV/TFLV, R=0.706 vs. 0.499, R2=0.499 vs. 0.239). Conclusions: RLV/SLV was more specific than RLV/TFLV in predicting the postoperative course after right hemihepatectomy. To determine the safe limit of hepatic resection, a larger-scaled prospective study is needed. (Korean J Hepatobiliary Pancreat Surg 2013;17:
143-151)
Key Words: Liver volumetry; Future liver remnant; Liver resection; Liver failure
Received: August 20, 2013; Revised: September 18, 2013; Accepted: September 30, 2013 Corresponding author: Chol Kyoon Cho
Department of Surgery, Chonnam National University Hwasun Hospital, 322, Seoyang-ro, Hwasun 519-763, Korea Tel: +82-61-379-7646, Fax: +82-61-379-7661, E-mail: [email protected]
Copyright Ⓒ 2013 by The Korean Association of Hepato-Biliary-Pancreatic Surgery Korean Journal of Hepato-Biliary-Pancreatic Surgery ∙ ISSN: 1738-6349
INTRODUCTION
Over the recent decade, liver resection has become in- creasingly safe as a result of improvements in surgical technique. But, posthepatectomy liver failure (PHLF) re- mains one of the most serious complications after liver resection. The occurrence of PHLF after major liver re- section has been reported in up to 8% of liver resection patients, depending on the patient's condition and the functional reserve of the liver before resection.1-3 PHLF is closely related to the volume and function of the rem- nant liver. Patients with a small future liver remnant (FLR) are at a higher risk for developing PHLF. FLR is usually expressed as the ratio of the remnant liver volume (RLV) and the total functioning liver volume (TFLV).4,5
The TFLV is calculated using the following formula: total liver volume (TLV)-tumor volume (TV)=TFLV. The crit- ical minimum FLR has been estimated to be approx- imately 20% in normal livers, and 40% in cirrhotic livers.6 However, it is still unclear why some patients with a smaller FLR do not develop PHLF, whereas some with a greater FLR do. In liver transplantation, a major concern is determining the minimum graft volume required for a recipient to meet his or her metabolic demands.7-9 It is generally accepted that the ratio of the graft volume to the standard liver volume (SLV) needs to be at least 30%
to 40% to fit the hepatic metabolic demands of the recipient.7,10,11 The Indocyanine green retention rate at 15 minutes (ICG R15) is the most common preoperative test for evaluating hepatic functional reserve.12,13 The serum
total bilirubin level and prothrombin time (PT) at post- operative day 5 are known as markers of liver function and are predictive markers of hepatic failure after hepatic resection.14,15
Based on the above theories, the aim of the present study was to evaluate the significance of the standardized FLR (RLV/SLV) as a predictive factor of liver function and liver failure after hepatic resection, compared to the actual FLR (RLV/TFLV).
METHODS
From January 2010 to May 2013, 74 patients under- went right hemihepatectomy for malignant hepatic tumor at the Department of Surgery, Chonnam National University Hwasun Hospital. The records for 74 patients were reviewed retrospectively. Patients with perihilar cholangiocarcinomas and gallbladder cancers were ex- cluded because of the frequency of preoperative hyperbilirubinemia. No patient underwent preoperative portal vein embolization (PVE).
Operative procedures
The liver was exposed via a right subcostal abdominal incision with a midline extension to the xiphoid process.
Intraoperative ultrasonography was used to confirm tumor resectability and determine the appropriate line of resection. The liver was mobilized completely from the posterior abdominal wall and rotated anteromedially to ex- pose the retrohepatic inferior vena cava (IVC). Small trib- utaries draining into the IVC from the liver were ligated individually and divided. After separating the hepatocaval ligament, the right hepatic vein was looped. Hilar dis- section was undertaken to isolate and divide the right hep- atic artery and portal vein. Pringle's maneuver was not used in any of the patients. Hepatic parenchymal trans- ection was performed using an ultrasonic aspirator. After parenchymal dissection, the right hepatic vein was sub- sequently divided and sutured.
Postoperative care
All patients received the same postoperative care by the same team of surgeons in the intensive care unit during the early postoperative course. Parenteral nutritional sup- port was provided for patients with liver cirrhosis. Early
enteric nutrition was encouraged once bowel activity returned. All intraoperative and postoperative complica- tions were recorded prospectively. Liver function tests in- cluding the serum total bilirubin level and PT were sam- pled routinely on postoperative days (POD) 1, 3, 5, and 7. Serum total bilirubin level and PT at POD 5 were chos- en to evaluate the hepatic function after liver resection.14 The PHLF was defined as both a PT of <50% and a total serum bilirubin level >2.9 mg/dl after postoperative day 5 according to the "50-50 criteria", and the development of intractable ascites or hepatic encephalopathy.14,15 Postoperative mortality was defined as death occurring during the postoperative period during the hospital stay or within 30 days of surgery.
Standard liver volume calculation
The SLV was calculated using the following formula reported by Yu et al.16: SLV (ml)=21.585×body weight (kg)0.732×height (cm)0.225.
Volumetric liver analysis using Dr. Liver All patient underwent contrast-enhanced computed to- mography (CT) as part of the routine preoperative assessment. Arterial, portal, and venous phase series of images from the preoperative CT scans were used for the CT volumetry. Volumetric analysis using Dr. Liver (Humanopia co., Ltd, Pohang, Gyungbuk, Korea) was per- formed by two surgeons (HJ Kim and CY Kim). The liver was semi-automatically extracted once multiple seed points had been selected on 5 to 6 slices. The portal vein, hepatic vein, IVC, and tumor were extracted in the same manner. The total liver volume (TLV) and tumor volume (TV) were automatically calculated with Dr. Liver. The gall bladder and IVC were excluded in the liver volume, and the intrahepatic vascular and biliary structures were included. The total functional liver volume (TFLV) was calculated using the following formula: TLV-TV=TFLV.
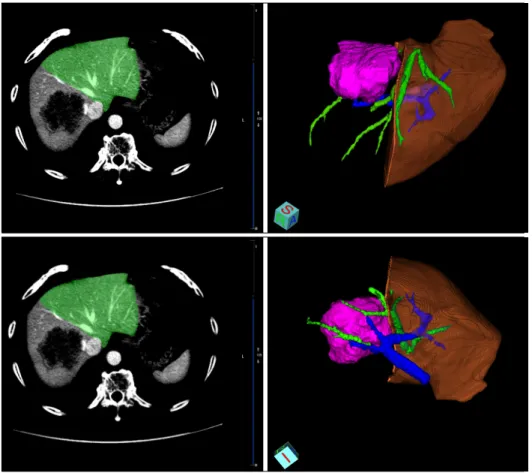
The transection line of the virtual liver resection followed the middle hepatic vein. The middle hepatic vein was ex- cluded from the virtual resection area (Fig. 1).
Statistics
Continuous variables were expressed as the median (range) or the mean±standard deviation and compared us- ing the Mann-Whitney U test. The impact of the
Fig. 1. Virtual resection of the liver. The transection line of the virtual liver resection followed the middle hepatic vein. The middle hepatic vein was ex- cluded from the virtual re- section area.
RLV/SLV and RLV/TFLV was evaluated both as catego- rical and continuous variables. Discrete variables were compared using the chi-square test or Fisher's exact test.
Correlations between continuous variables were assessed using regression analysis. The resulting regression line was described as a logarithmic equation, and the correla- tion coefficients (R and R2) were calculated. The RLV/SLV with cut-off values of 30% and 40% and the RLV/TFLV with a cut-off value of 40% were calculated to look for the occurrence of PHLF and elevation of the liver function test using receiver operating characteristic (ROC) curve analysis. A p-value of <0.05 was consid- ered to indicate statistical significance. Statistical analysis was performed using SPSS for windows version 18.0 (SPSS, Inc., Chicago, IL, USA).
RESULT
Patients
A total of 74 patients were evaluated in the present study. Their median age was 58 years (range: 34-81 years). 52 (70.3%) patients underwent right hemi-
hepatectomy because of hepatocellular carcinoma, 13 (17.6%) patients because of metastatic tumor, 8 (10.8%) patients because of intrahepatic cholangiocarcinoma, and 1 (1.4%) patient because of carcinosarcoma. A total of 37 (50%) patients had histologic evidence of liver cirrhosis.
All patients with cirrhotic liver were in the Child A class.
None of the patients had biliary obstruction, preoperative hyperbilirubinemia, or preoperative PT prolongation.
Clinicopathologic characteristics of the patients are shown in Table 1. For each ratio, the groups were comparable in terms of the preoperative data.
Liver volume assessment
There were no significant differences in TFLV, SLV, RLV/TFLV, and RLV/SLV between the liver cirrhosis (LC) positive group and negative group. The mean TFLV was smaller than SLV in each group, but it was not significant, statistically (Table 2). In 8 patients (10.8%), TFLV was sig- nificantly smaller than SLV (TFLV/SLV <70%). There was a good correlation between RLV/TFLV and RLV/SLV (p<0.001, R=0.718) (Fig. 2). However, some discordant re- sults were observed. Of the 46 patients in the RLV/TFLV
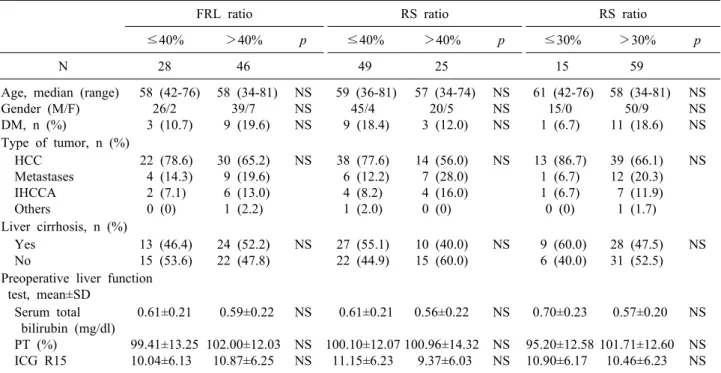
Table 1. Clinicopathologic and preoperative laboratory characteristics of 74 patients
FRL ratio RS ratio RS ratio
≤40% >40% p ≤40% >40% p ≤30% >30% p
N 28 46 49 25 15 59
Age, median (range) Gender (M/F) DM, n (%)
58 (42-76) 26/2 3 (10.7)
58 (34-81) 39/7 9 (19.6)
NS NS NS
59 (36-81) 45/4 9 (18.4)
57 (34-74) 20/5 3 (12.0)
NS NS NS
61 (42-76) 15/0 1 (6.7)
58 (34-81) 50/9 11 (18.6)
NS NS NS Type of tumor, n (%)
HCC Metastases IHCCA Others
22 (78.6) 4 (14.3) 2 (7.1) 0 (0)
30 (65.2) 9 (19.6) 6 (13.0) 1 (2.2)
NS 38 (77.6) 6 (12.2) 4 (8.2) 1 (2.0)
14 (56.0) 7 (28.0) 4 (16.0) 0 (0)
NS 13 (86.7) 1 (6.7) 1 (6.7) 0 (0)
39 (66.1) 12 (20.3) 7 (11.9) 1 (1.7)
NS
Liver cirrhosis, n (%) Yes
No
13 (46.4) 15 (53.6)
24 (52.2) 22 (47.8)
NS 27 (55.1) 22 (44.9)
10 (40.0) 15 (60.0)
NS 9 (60.0) 6 (40.0)
28 (47.5) 31 (52.5)
NS Preoperative liver function
test, mean±SD Serum total bilirubin (mg/dl) PT (%)
ICG R15
0.61±0.21 99.41±13.25 10.04±6.13
0.59±0.22 102.00±12.03
10.87±6.25 NS NS NS
0.61±0.21 100.10±12.07
11.15±6.23
0.56±0.22 100.96±14.32
9.37±6.03 NS NS NS
0.70±0.23 95.20±12.58 10.90±6.17
0.57±0.20 101.71±12.60
10.46±6.23 NS NS NS HCC, hepatocellular carcinoma; IHCCA, intrahepatic cholangiocarcinoma; PT, prothrombin time; ICG R15, indocyanine green retention rate at 15 minutes; NS, not significant
Table 2. Comparison of the total functional liver volume (TFLV), standard liver volume (SLV), remnant-to-total func- tional liver volume (RLV/TFLV), and remnant-to-standard liver volume (RLV/SLV) between cirrhotic patients (LC (+)) and non-cirrhotic patients (LC(-)) group
Total (mean±SD)
LC (+) (mean±SD)
LC (-)
(mean±SD) p-value*
TFLV (ml) SLV (ml) RLV/TFLV (%) RLV/SLV (%)
1,263±262 1,421±176 42.22±7.63 37.54±9.10
1,247±295 1,446±214 43.20±8.10 37.00±8.27
1,279±227 1,396±127 41.24±7.10 38.08±9.95
0.247 0.250 0.289 0.520 LC, Liver cirrhosis
*Statistical significance test was done by the Mann-Whitney U-test
Fig. 2. Correlation between RLV/SLV and RLV/TFLV. Some discordant results were observed.
>40% group, 23 patients (50.0%) were classified in the RLV/SLV ≤40% group, including 4 patients (8.7%) of the RLV/SLV less than 30% group (Table 3). Differences be- tween RLV/TFLV and RLV/SLV were over 10% in 13 pa- tients (17.6%). Only 2 patients had a RLV/TFLV less than 30%; therefore, the RLV/TFLV with a cut-off value of 30%
could not be analyzed.
Operative outcomes
Of the 74 patients who underwent right hemihepatec-
tomy, 15 patients developed a complication, with a peri- operative morbidity rate of 20.2%. Complications in- cluded ascites of over 1,000 ml/day at POD5 (n=8), wound infection (n=3), biloma requiring drainage (n=1), pleural effusion requiring drainage (n=1), pneumonia (n=1), and urinary complications (n=1). PHLF occurred in 9 patients (10.8%) including 4 patients who died (5.4%).
1 patient with PHLF underwent a liver transplantation and 4 patients recovered without a liver transplantation. As
Table 3. Comparison of the remnant-to-total functional liver volume ratio (RLV/TFLV) grade and remnant-to-standard liv- er volume ratio (RLV/SLV) grade
RLV/SLV (%)
Total
>40 30-40 ≤30 RLV/TFLV (%) >40
30-40
≤ 30 23
2 0
19 14 1
4 10 1
46 26 2
Total 25 34 15 74
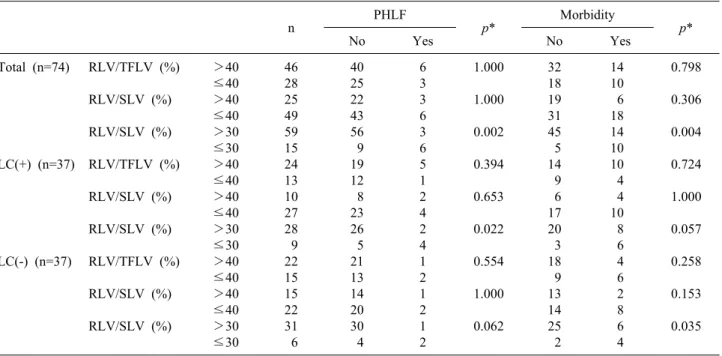
Table 4. Correlation between remnant-to-total functional liver volume ratio (RLV/TFLV), remnant-to-standard liver volume ratio (RLV/SLV) and morbidity
n PHLF
p* Morbidity
No Yes No Yes p*
Total (n=74)
LC(+) (n=37)
LC(-) (n=37)
RLV/TFLV (%) RLV/SLV (%) RLV/SLV (%) RLV/TFLV (%) RLV/SLV (%) RLV/SLV (%) RLV/TFLV (%) RLV/SLV (%) RLV/SLV (%)
>40
≤40
>40
≤40
>30
≤30
>40
≤40
>40
≤40
>30
≤30
>40
≤40
>40
≤40
>30
≤30
46 28 25 49 59 15 24 13 10 27 28 9 22 15 15 22 31 6
40 25 22 43 56 9 19 12 8 23 26 5 21 13 14 20 30 4
6 3 3 6 3 6 5 1 2 4 2 4 1 2 1 2 1 2
1.000 1.000 0.002 0.394 0.653 0.022 0.554 1.000 0.062
32 18 19 31 45 5 14 9 6 17 20 3 18 9 13 14 25 2
14 10 6 18 14 10 10 4 4 10 8 6 4 6 2 8 6 4
0.798 0.306 0.004 0.724 1.000 0.057 0.258 0.153 0.035
LC, Liver cirrhosis
*Each group was compared using Fisher's exact test shown in Table 4, the increase of PHLF and morbidity was statistically significant only when the RLV/SLV with a cut-off value of 30% was used. Four patients (5.4%) died in the postoperative period from liver failure. Of the 4 patients, 3 had liver cirrhosis and 1 patient had chronic hepatitis B without histologic evidence of liver cirrhosis.
Correlation between RLV/TFLV, RLV/SLV and postoperative liver function test
Total serum bilirubin and PT did not correlate with the RLV/TFLV in the liver cirrhosis-positive group. However, there were significant correlations in non-cirrhotic patients. RLV/SLV had a significant correlation with total serum bilirubin and PT, especially, in the non-cirrhotic
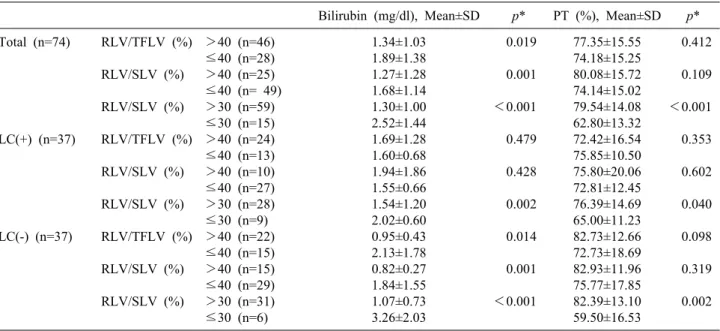
patients group (Table 5). When the correlations were ana- lyzed in continuous variables, serum total bilirubin was significantly correlated to RLV/TFLV and RLV/SLV.
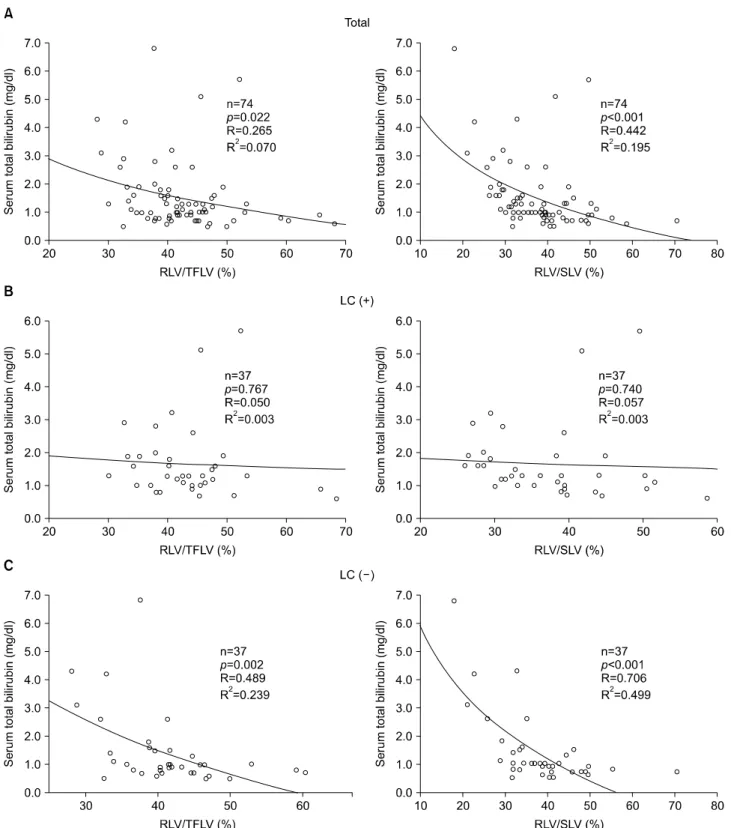
Especially, a very good correlation was observed for the group with RLV/SLV 30% in both the LC (+) and LC (-) groups. However, PT was correlated only with the RLV/SLV 30% group (Table 6). In regression analysis, serum total bilirubin level had a better correlation with the RLV/SLV (p<0.001, R=0.442, R2=0.195) than with the RLV/TFLV (p=0.022, R=0.265, R2=0.061) (Fig. 3).
When the patients were classified into LC-positive and LC-negative groups, significant correlations were found between the RLV/SLV and serum total bilirubin level in the LC-negative patients; however, no correlation was ob- served in LC-positive patients (Fig. 3). RLV/SLV showed a closer correlation with the postoperative serum total bi- lirubin level than the RLV/TFLV (R2, RLV/SLV vs.
RLV/TFLV, 0.499 vs. 0.239). ICG R15 was not correlated with PHLF and the postoperative liver function test in any of the groups.
DISCUSSION
Advances in surgical techniques and perioperative care,
Table 5. Correlation between RLV/TFLV, RLV/SLV and serum total bilirubin level Total
Serum total bilirubin (mg/dl) p*
PT (%)
≤1.5, p*
n (%)
1.5-2.9 n (%)
>2.9, n (%)
>70, n (%)
50-70, n (%)
≤50, n (%) Total
(n=74)
LC(+) (n=37)
LC(-) (n=37)
RLV/TFLV (%) RLV/SLV (%) RLV/SLV (%) RLV/TFLV (%) RLV/SLV (%) RLV/SLV (%) RLV/TFLV (%) RLV/SLV (%) RLV/SLV (%)
>40
≤40
>40
≤40
>30
≤30
>40
≤40
>40
≤40
≥30
≤30
>40
≤40
>40
≤40
>30
≤30 46 28 25 49 59 15 24 13 10 27 28 9 22 15 15 22 31 6
37 (80.4) 14 (50.0) 22 (88.0) 29 (59.2) 50 (84.7) 1 (6.7) 16 (66.7)
6 (46.2) 7 (70.0) 15 (55.6) 22 (78.6) 0 (0.0) 21 (95.5)
8 (53.3) 15 (100) 14 (63.6) 28 (90.3) 1 (16.7)
6 (13.0) 9 (32.1) 1 (4.0) 14 (28.6)
6 (10.2) 9 (60.0) 5 (20.8) 6 (46.2) 1 (10.0) 10 (37.0) 4 (14.3) 7 (77.8) 1 (4.5) 3 (20.0) 0 (0) 4 (18.2) 2 (6.5) 2 (33.3)
3 (6.5) 5 (17.9) 2 (8.0) 6 (12.2) 3 (5.1) 5 (33.3) 3 (12.5) 1 (7.7) 2 (20.0) 2 (7.4) 2 (7.1) 2 (22.2) 0 (0.0) 4 (26.7) 0 (0) 4 (18.2) 1 (3.2) 3 (50.0)
0.009 0.027
<0.001 0.300 0.481
<0.001 0.004 0.012 0.001
35 (76.1) 17 (60.7) 22 (88.0) 30 (61.2) 48 (81.4) 4 (26.7) 15 (62.5) 9 (69.2) 8 (80.0) 16 (59.3) 21 (75.0) 3 (33.3) 20 (90.9) 8 (53.3) 14 (93.3) 14 (63.6) 27 (87.1) 1 (16.7)
9 (19.6) 9 (32.1) 2 (8.0) 16 (32.7) 10 (16.9) 8 (53.3) 7 (29.2) 4 (30.8) 1 (10.0) 10 (37.0) 6 (21.4) 5 (55.6) 2 (9.1) 5 (33.3) 1 (6.7) 6 (27.3) 4 (12.9) 3 (50.0)
2 (4.3) 2 (7.1) 1 (4.0) 3 (6.1) 1 (1.7) 3 (20.0) 2 (8.3) 0 (0.0) 1 (10.0) 1 (3.7) 1 (3.6) 1 (11.1) 0 (0.0) 2 (13.3) 0 (0.0) 2 (9.1) 0 (0.0) 2 (5.4)
0.195 0.030
<0.001 0.734 0.440 0.042 0.017 0.056 0.002
LC, Liver cirrhosis
*If the percentage of cells with the expected count of less than 5 exceeded 20%, the serum total bilirubin and PT groups were regrouped in a 2×2 table and compared using Fisher's exact test
Table 6. Correlations between RLV/TFLV, RLV/SLV and postoperative liver function tests in continuous variables Bilirubin (mg/dl), Mean±SD p* PT (%), Mean±SD p*
Total (n=74)
LC(+) (n=37)
LC(-) (n=37)
RLV/TFLV (%) RLV/SLV (%) RLV/SLV (%) RLV/TFLV (%) RLV/SLV (%) RLV/SLV (%) RLV/TFLV (%) RLV/SLV (%) RLV/SLV (%)
>40 (n=46)
≤40 (n=28)
>40 (n=25)
≤40 (n= 49)
>30 (n=59)
≤30 (n=15)
>40 (n=24)
≤40 (n=13)
>40 (n=10)
≤40 (n=27)
>30 (n=28)
≤30 (n=9)
>40 (n=22)
≤40 (n=15)
>40 (n=15)
≤40 (n=29)
>30 (n=31)
≤30 (n=6)
1.34±1.03 1.89±1.38 1.27±1.28 1.68±1.14 1.30±1.00 2.52±1.44 1.69±1.28 1.60±0.68 1.94±1.86 1.55±0.66 1.54±1.20 2.02±0.60 0.95±0.43 2.13±1.78 0.82±0.27 1.84±1.55 1.07±0.73 3.26±2.03
0.019 0.001
<0.001 0.479 0.428 0.002 0.014 0.001
<0.001
77.35±15.55 74.18±15.25 80.08±15.72 74.14±15.02 79.54±14.08 62.80±13.32 72.42±16.54 75.85±10.50 75.80±20.06 72.81±12.45 76.39±14.69 65.00±11.23 82.73±12.66 72.73±18.69 82.93±11.96 75.77±17.85 82.39±13.10 59.50±16.53
0.412 0.109
<0.001 0.353 0.602 0.040 0.098 0.319 0.002
LC, Liver cirrhosis
*Each group was compared using the Mann-Whitney U test
and improvements in patent selection criteria were able to increase the number of patients who could undergo ma- jor and extended hepatectomy. With such extensive re- sections of the hepatic parenchyma, the risk of PHLF is increased, and it is associated with a high frequency of
postoperative complications, mortality and an increased length of hospital stay.17
The remnant liver volume after resection is a critical factor for predicting the postoperative outcome. The gen- erally accepted FLR ratio limit for safe resection in the
Fig. 3. Correlation between RLV/SLV and serum total bilirubin level at POD 5 in all patients (A). No correlation was observed in LC-positive patients (B), however, Significant correlations were found between RLV/SLV and serum total bilirubin level in LC-negative patients (C). RLV/SLV showed a more close correlation with postoperative serum total bilirubin level than RLV/TFLV.
normal liver ranges from 20 to 30% according to different authors.17-21 Several methods for liver volume determi- nation have been reported. The traditional method of
measuring liver volumes focused on the liver to be re- sected, with the CT measurement of the TFLV and volume of the liver to be left as a remnant.4,5 Shoup et al.17 re-
ported that patients without liver disease undergoing right trisectionectomy, with less than 25% of the actual FLR, demonstrated a 90% incidence of hepatic dysfunction.
However, several authors proposed that direct CT meas- urement of the TFLV may be inaccurate for the following reasons: (1) measurement of the TFLV is associated with a cumulative error associated with multiple tumors or in- trahepatic bile duct dilatation21-23; (2) tumors compressing or invading the portal vein or bile ducts induce atrophy of the involved liver and in such cases, the measured TFLV may not reflect accurate liver function; and (3) TFLV does not provide a fixed estimation for total func- tional liver volume before and after portal vein emboliza- tion (PVE); in cases of atrophy without contralateral hy- pertrophy from the PVE, the use of a smaller post-PVE TFLV as a denominator for the calculation of the FLR will falsely indicate volume change (hypertrophy).21 To over- come the errors associated with traditional liver volumetry, Urata et al.24 introduced the concept of the total estimated liver volume (TELV), based on the observation that in adults without chronic liver disease, the liver volume cor- relates linearly with body size and weight. Vauthey et al.
described a minimum safe standardized FLR of 25% in pa- tients who underwent extended right hepatectomy. The au- thors described the occurrence of major postoperative complications in 3 of 5 patients with standardized FLR volumes of ≤25% compared with no major complications in the remaining 10 of the resected group with a stand- ardized FLR of >25% (p=0.002).19 Abdalla et al.25 re- ported that postoperative complications occurred in 50%
of patients who underwent extended right hepatectomy with a standardized FLR of ≤20% versus only 13% for patients with a standardized FLR volume of over 20%, and Kishi et al.21 identified a significant increase in the fre- quency of liver insufficiency and death from liver failure in patients with a standardized FLR volume of ≤20% (34 and 11%, respectively), compared with patients with a standardized FLR of 20-30% (10 and 3%, respectively, p
<0.001 and p=0.038). More recently, Narita et al. have reported that the actual FLR and standardized FLR were independent predictive factors of the occurrence of post- operative liver failure.26 But, a direct comparison of the two ratios was not performed. In the present study, half of the 46 patients in the RLV/TFLV >40% group were classified in the RLV/SLV ≤40% group, including 4 pa-
tients (8.7%) of the RLV/SLV less than 30% group (Table 3). And, the standardized FLR (RLV/SLV) showed a stronger correlation with the postoperative total serum bi- lirubin level compared to the actual FLR (RLV/TFLV) (Fig. 3). In our series, among 4 patients who died of liver failure, a patient with chronic hepatitis had an RLV/TFLV of 37.65%, but the RLV/SLV was 18.00%.
Truant et al.27 have reported that the FLR measurement standardized to body weight was more specific than the actual FLR (RLV/TFLV) in predicting the postoperative course after extended hepatectomy. More recently, a com- parison of the FLR measurements standardized to the body weight and BSA showed that the two methods were highly correlated and yielded similar results in predicting postoperative hepatic dysfunction.28 The authors reported that in noncirrhotic patients, a FLR/BW ratio of ≤0.4 and FLR/SLV of ≤20% provide equivalent thresholds for per- forming safe hepatic resection.
The safe limit for liver resection in chronic liver dis- ease and cirrhosis is not well-established. Determination of the safe limit of liver resection in these patients is more complex because the degree of hepatic dysfunction which is not describable with the Child-Pugh classification is widely variable. Therefore, some authors proposed a dif- ferent surgical approach that depended on the ICG R15, with surgical procedures ranging from simple enucleation to major hepatectomy. Imamura et al. proposed a decision tree for the selection of the operative procedure in patients with impaired liver function.29 With this approach, the au- thors reported on every single death in over 1,400 liver resections during a 10-year period.
In conclusion, in the present study, the standardized FLR ratio (RLV/SLV) was more relevant than the actual FLR ratio (RLV/TFLV) in predicting postoperative hep- atic function after right hemihepatectomy. Cirrhotic pa- tients with a RLV/SLV of ≤30% were at considerable risk for PHLF. These results need to be confirmed in a larger-scaled prospective study.
REFERENCES
1. Benzoni E, Lorenzin D, Baccarani U, et al. Resective surgery for liver tumor: a multivariate analysis of causes and risk factors linked to postoperative complications. Hepatobiliary Pancreat Dis Int 2006;5:526-533.
2. Schroeder RA, Marroquin CE, Bute BP, et al. Predictive indices
of morbidity and mortality after liver resection. Ann Surg 2006;243:373-379.
3. Paugam-Burtz C, Janny S, Delefosse D, et al. Prospective vali- dation of the "fifty-fifty" criteria as an early and accurate pre- dictor of death after liver resection in intensive care unit patients.
Ann Surg 2009;249:124-128.
4. Ogasawara K, Une Y, Nakajima Y, et al. The significance of measuring liver volume using computed tomographic images be- fore and after hepatectomy. Surg Today 1995;25:43-48.
5. Kubota K, Makuuchi M, Kusaka K, et al. Measurement of liver volume and hepatic functional reserve as a guide to deci- sion-making in resectional surgery for hepatic tumors. Hepatol- ogy 1997;26:1176-1181.
6. Guglielmi A, Ruzzenente A, Conci S, et al. How much remnant is enough in liver resection? Dig Surg 2012;29:6-17.
7. Lo CM, Fan ST, Liu CL, et al. Minimum graft size for successful living donor liver transplantation. Transplantation 1999;68:
1112-1116.
8. Kawasaki S, Makuuchi M, Matsunami H, et al. Preoperative measurement of segmental liver volume of donors for living re- lated liver transplantation. Hepatology 1993;18:1115-1120.
9. Nishizaki T, Ikegami T, Hiroshige S, et al. Small graft for living donor liver transplantation. Ann Surg 2001;233:575-580.
10. Kawasaki S, Makuuchi M, Matsunami H, et al. Living related liver transplantation in adults. Ann Surg 1998;227:269-274.
11. Chen CL, Fan ST, Lee SG, et al. Living-donor liver transplan- tation: 12 years of experience in Asia. Transplantation 2003;75(3 Suppl):S6-S11.
12. Hemming AW, Scudamore CH, Shackleton CR, et al.
Indocyanine green clearance as a predictor of successful hepatic resection in cirrhotic patients. Am J Surg 1992;163:515-518.
13. Fan ST, Lai EC, Lo CM, et al. Hospital mortality of major hep- atectomy for hepatocellular carcinoma associated with cirrhosis.
Arch Surg 1995;130:198-203.
14. Balzan S, Belghiti J, Farges O, et al. The "50-50 criteria" on postoperative day 5: an accurate predictor of liver failure and death after hepatectomy. Ann Surg 2005;242:824-828.
15. Rahbari NN, Garden OJ, Padbury R, et al. Posthepatectomy liver failure: a definition and grading by the International Study Group of Liver Surgery (ISGLS). Surgery 2011;149:713-724.
16. Yu HC, You H, Lee H, et al. Estimation of standard liver volume for liver transplantation in the Korean population. Liver Transpl 2004;10:779-783.
17. Shoup M, Gonen M, D'Angelica M, et al. Volumetric analysis
predicts hepatic dysfunction in patients undergoing major liver resection. J Gastrointest Surg 2003;7:325-330.
18. Abdalla EK, Vauthey JN, Ellis LM, et al. Recurrence and out- comes following hepatic resection, radiofrequency ablation, and combined resection/ablation for colorectal liver metastases. Ann Surg 2004;239:818-825.
19. Vauthey JN, Chaoui A, Do KA, et al. Standardized measurement of the future liver remnant prior to extended liver resection: meth- odology and clinical associations. Surgery 2000;127:512-519.
20. Ribero D, Abdalla EK, Madoff DC, et al. Portal vein emboliza- tion before major hepatectomy and its effects on regeneration, re- sectability and outcome. Br J Surg 2007;94:1386-1394.
21. Kishi Y, Abdalla EK, Chun YS, et al. Three hundred and one consecutive extended right hepatectomies: evaluation of outcome based on systematic liver volumetry. Ann Surg 2009;250:
540-548.
22. Vauthey JN, Abdalla EK, Doherty DA, et al. Body surface area and body weight predict total liver volume in Western adults.
Liver Transpl 2002;8:233-240.
23. Vauthey JN, Pawlik TM, Abdalla EK, et al. Is extended hep- atectomy for hepatobiliary malignancy justified? Ann Surg 2004;239:722-730.
24. Urata K, Kawasaki S, Matsunami H, et al. Calculation of child and adult standard liver volume for liver transplantation.
Hepatology 1995;21:1317-1321.
25. Abdalla EK, Barnett CC, Doherty D, et al. Extended hepatectomy in patients with hepatobiliary malignancies with and without pre- operative portal vein embolization. Arch Surg 2002;137:675-680.
26. Narita M, Oussoultzoglou E, Fuchshuber P, et al. What is a safe future liver remnant size in patients undergoing major hep- atectomy for colorectal liver metastases and treated by intensive preoperative chemotherapy? Ann Surg Oncol 2012;19:2526-2538.
27. Truant S, Oberlin O, Sergent G, et al. Remnant liver volume to body weight ratio > or =0.5%: A new cut-off to estimate post- operative risks after extended resection in noncirrhotic liver. J Am Coll Surg 2007;204:22-33.
28. Chun YS, Ribero D, Abdalla EK, et al. Comparison of two meth- ods of future liver remnant volume measurement. J Gastrointest Surg 2008;12:123-128.
29. Imamura H, Sano K, Sugawara Y, et al. Assessment of hepatic reserve for indication of hepatic resection: decision tree in- corporating indocyanine green test. J Hepatobiliary Pancreat Surg 2005;12:16-22.