R E S E A R C H A R T I C L E Open Access
Prevalence of the Metabolic Syndrome among Korean Workers by Occupational Group: Fifth
Korean National Health and Nutrition Examination Survey (KNHANES) 2010
Ji Young Ryu1, Sukwoo Hong1, Chang-Hyo Kim2, Sangyoon Lee1, Jeong-Ho Kim3, Jong-Tae Lee3 and Dae Hwan Kim1*
Abstract
Objectives: The prevalence of the metabolic syndrome has increased rapidly in South Korea over the past 10 years.
However, the occurrence of the metabolic syndrome in workers grouped according to the specific type of work is not well understood in Korea. In this study, we assessed the differences in the prevalence of the metabolic syndrome by occupational group and evaluated the risk of the metabolic syndrome among occupational groups.
Methods: From the Fifth Korean National Health and Nutrition Examination Survey (2010), 3,303 employed participants were included in this study. The unadjusted and age-adjusted prevalences of the metabolic syndrome were estimated and multiple logistic regression analysis was conducted using the presence of the metabolic syndrome as a dependent variable, and adjusting for age, education level, household income, drinking behavior, smoking status, physical activity, work hours, and work scheduling pattern.
Results: Among male workers, non-manual workers had the greatest age-adjusted prevalence (26.4%, 95% CI:
22.3-30.5%) among the occupational groups. In a logistic regression analysis, male manual workers had a
significantly lower odds ratio for the metabolic syndrome relative to non-manual workers (0.59, 95% CI: 0.41-0.85).
Conclusion: Our study demonstrated differences in the prevalence of the metabolic syndrome by occupational group and identified the greatest risk for the metabolic syndrome in male non-manual workers.
Keywords: Metabolic syndrome, Prevalence, Workers, Occupation
Introduction
The metabolic syndrome is a condition that is defined by the combination of five factors: abdominal obesity, hypertension, hypertriglyceridemia, low HDL-cholesterol level, and hyperglycemia [1]. These components of the metabolic syndrome are major risk factors for cardiovas- cular disease and impaired glucose metabolism [1-4].
Recently, the prevalence of the metabolic syndrome has increased rapidly in South Korea [5,6]. According to a study using the data from the Korean National Health
and Nutrition Examination Survey (KNHANES), the age-adjusted prevalence of the metabolic syndrome in 2007 was 31.3%, while the age-adjusted prevalence of the metabolic syndrome in 1998 had been just 24.9% [6].
It is thought that the rapid increase in the prevalence of the metabolic syndrome may have arisen from lifestyle changes including a westernized diet and physical inac- tivity [5-7].
On the other hand, recent studies have shown that the prevalence of the metabolic syndrome varies in different occupational groups [8,9]. Among U.S. workers, the un- adjusted and age-adjusted prevalences of the metabolic syndrome were greatest in “transportation and material occupations” and “food preparation and food service workers,” respectively [9]. In male Spanish workers, the
* Correspondence:[email protected]
1Department of Occupational and Environmental Medicine, Inje University Haeundae Paik Hospital, 875 Heaundae-ro, Haeundae-Gu, Busan 612-862, South Korea
Full list of author information is available at the end of the article
© 2013 Ryu et al.; licensee BioMed Central Ltd. This is an Open Access article distributed under the terms of the Creative Commons Attribution License (http://creativecommons.org/licenses/by/2.0), which permits unrestricted use, distribution, and reproduction in any medium, provided the original work is properly cited.
Ryu et al. Annals of Occupational and Environmental Medicine 2013, 25:13 http://www.aoemj.com/content/25/1/13
highest age-adjusted prevalence of the metabolic syn- drome was found among “machine installers, operators and assemblers” while the prevalence of the metabolic syndrome in female workers was highest among “skilled workers in the agricultural and fishing industries” [8]. It is expected that the prevalence of the metabolic syn- drome among workers may differ by country, consider- ing the distinctive working environment of each country.
In Korea, only a few studies have assessed the associ- ation between the occupational group and the metabolic syndrome. Although previous research by Myoung et al.
has evaluated the relationship between occupations and the metabolic syndrome among Korean workers, the study was limited by the fact that the occupations were grouped into manual or non-manual workers only, with- out considering service and sales workers as a separate work group [10].
In this study, we assessed the differences in the preva- lence of the metabolic syndrome and its individual cri- teria by occupational group and evaluated the risk of the metabolic syndrome among occupational groups using KNHANES data.
Materials and methods Subjects
Data from the fifth KNHANES, gathered in 2010, was used for the analyses. The KNHANES is a multistage stratified complex design survey of a representative sam- ple of the entire Korean population conducted by the Korea Centers for Disease Control and Prevention. The total number of participants was 8,958, and the participa- tion rate was 81.9%. Trained interviewers and laboratory technicians conducted surveys in households, including administering questionnaires, performing health exami- nations, and collecting blood samples. Subjects who were at least 20 years old, who reported having jobs, and who had occupational information were included in this study (n = 3,667). Subjects who reported having no jobs (n = 4,595), who had no occupational information (n = 597), or who belonged to the armed forces group in the occupa- tional classification (n = 31) were excluded from this study.
After this exclusion, the workers who were aged below 20 years old were also excluded (n = 68). Among 3,667 included workers, 3,303 workers who had fully available data needed for diagnosis of the metabolic syndrome were analyzed. This study was approved by the Institutional Review Board of the Haeundae Paik Hospital.
Occupational classification
The subjects were classified into nine occupational sub- groups based on the KNHANES data. The KNHANES employed the major categories of the Korean Standard Classification of Occupations (KSCO) [11] as the occu- pational classification. These occupations were grouped
into three categories according to their degree of physical work: non-manual workers, service/sales workers, and manual workers. Non-manual workers were managers, professionals and related workers, and clerks. Service workers and sales workers constituted one distinctive group. Manual workers consisted of skilled agricultural, forestry and fishery workers, craft and related trades workers, equipment, machine operating and assembling workers, and elementary workers.
Definition of the metabolic syndrome
The presence of the metabolic syndrome was deter- mined by the consensus definition [1] incorporating International Diabetes Federation (IDF) worldwide crite- ria [12] and American Heart Association/National Heart, Lung, and Blood Institute (AHA/NHLBI) criteria [13].
An individual who had any three or more of the following five criteria was defined as having the metabolic syndrome:
1) waist circumference≥ 90 cm in men and ≥ 80 cm in women, 2) blood pressure≥ 130/85 mmHg or receiving anti-hypertensive medication, 3) triglycerides≥ 150 mg/dl, 4) HDL-cholesterol < 40 mg/dl in men and < 50 mg/dl in women, 5) fasting glucose≥ 100 mg/dl or taking blood glu- cose lowering drugs.
Covariates
Age, level of education, household income, smoking status, high-risk drinking behavior, vigorous physical activity, work hours, work scheduling pattern, and body mass index (BMI) were included as covariates in this study. The levels of education were categorized into elementary school graduates (6-year course), middle school graduates (3-year), high school graduates (3-year), and some university education or above (2 or more years). Household income was classified by quartile as low, low-middle, middle-high, or high levels. Smoking status was divided into non-smokers, ex-smokers, and current smokers. High-risk drinking was defined as at least 7 glasses per day in men and at least 5 glasses per day in women and drinking behavior was categorized into no, once a month, once a week, or every day expe- rience of high-risk drinking. Vigorous physical activity was defined as physical activities over 10 minutes that are more strenuous than usual activities or make one breathless, including carrying heavy loads, running, climbing, fast cycling, fast swimming, soccer, basketball, and so on. This variable was divided into none, below 5 days per week, and at least 5 days per week of vigorous physical activities. Work hours were categorized into 40 hours per week or less and over 40 hours per week.
Work schedule patterns were grouped as either daytime fixed work or non-daytime work, including night-time and shift work. BMI was classified into normal/underweight
Ryu et al. Annals of Occupational and Environmental Medicine 2013, 25:13 Page 2 of 14
http://www.aoemj.com/content/25/1/13
(below 25 kg/m2), overweight (between 25 and 30 kg/m2), and obese (more than 30 kg/m2).
Statistical analyses
The statistical analyses were performed using SAS Enter- prise Guide (version 4.2; SAS Institute Inc., Cary, NC) to take into account sample weights and complex sample design effects. All of the data are presented as an estimated percentage (standard error) or estimated mean (standard error) for the demographic variables and each component of the metabolic syndrome. The Rao-Scott chi-squared test was used to compare the prevalence of the categorical variables. The unadjusted and age-adjusted prevalences of the metabolic syndrome for nine occupa- tional groups were estimated. Age-standardization by the direct method was done for the prevalence estimates using 2010 Census population data of Korea. The prevalence estimate for each occupational group was considered significantly higher than that for workers overall if the estimate was above the upper bounds of the 95% confi- dence interval for the overall prevalence estimate [14]. For the occupational groups, multiple logistic regression analysis was conducted with the presence of the metabolic syndrome as a dependent variable after stratification for gender. The multiple logistic regression analysis was performed, adjusting for age (continuous variable), level of education, household income, drinking behavior, smoking status, physical activity, work hours, and work schedule pattern.
Results
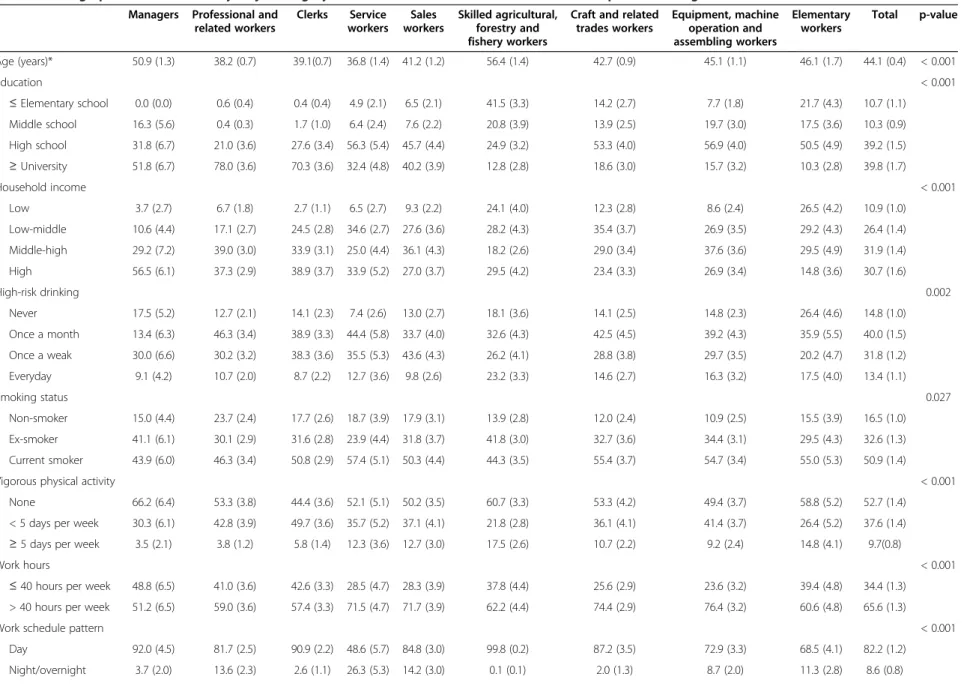
Tables 1 and 2 present the demographic characteristics by the major job categories of the KSCO among male and female workers, respectively. In both the male and female workers, “managers”, “professional and related”
workers, and “clerks” had high levels of education and household income. Among the male workers, the pro- portion doing vigorous physical activity at least 5 days per week was lowest in the“managers” (3.5%), followed by“professional and related” workers (3.8%) and “clerks”
(5.8%) and highest in the “skilled agricultural, forestry and fishery workers” (17.5%), followed by “elementary”
workers (14.8%), sales workers (12.7%), and service workers (12.3%). The proportion of those with less than 40 work hours per week was higher in the “managers”
(48.4%), “professional and related” workers (41%), and
“clerks” (42.6%) than in the other work groups in the men. Service workers reported the highest proportion of non-day work in both the male (51.4%) and female (29.8%) workers. “Managers”, “professional and related”
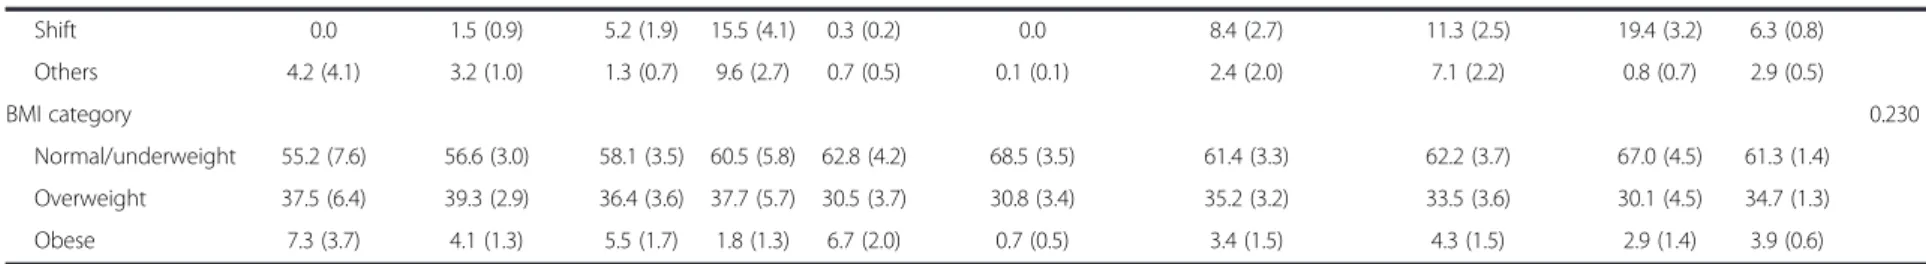
workers, and“clerks” were more likely to be overweight or obese than those of the other occupational groups in the male workers. On the other hand, in female workers,
the proportion of overweight or obese individuals was smaller among the “managers”, “professional and rela- ted” workers, and “clerks” than the other occupational groups.
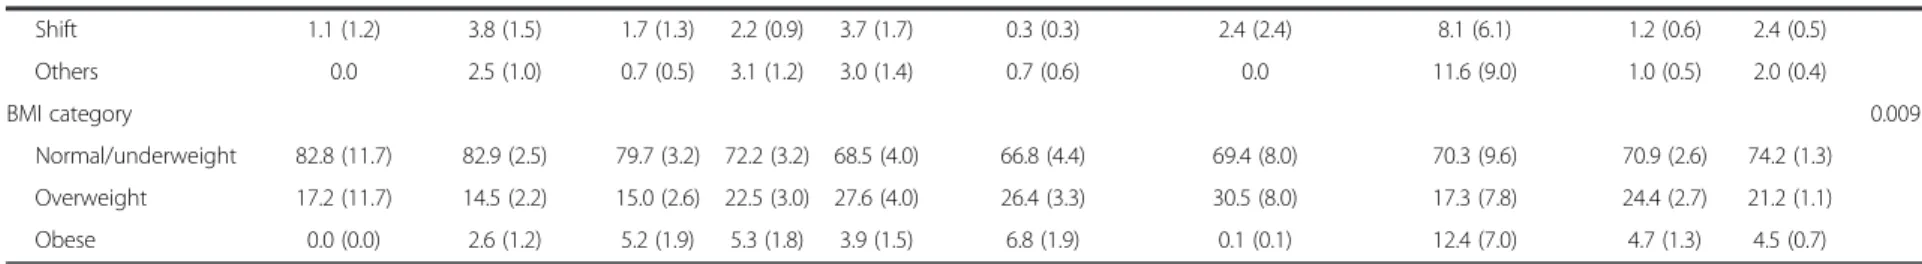
The prevalence estimates of the metabolic syndrome by demographic characteristics stratified by gender are shown in Table 3. Among the male workers, the subgroup with the highest prevalence of the metabolic syndrome was the obese group (68.3%), followed by the overweight group (39.1%) and the group engaging in high-risk drinking everyday (38.1%). In the female wor- kers, the group of those aged≥ 70 years (53.5%) showed the highest prevalence of the metabolic syndrome, followed by the obese group (46.1%).
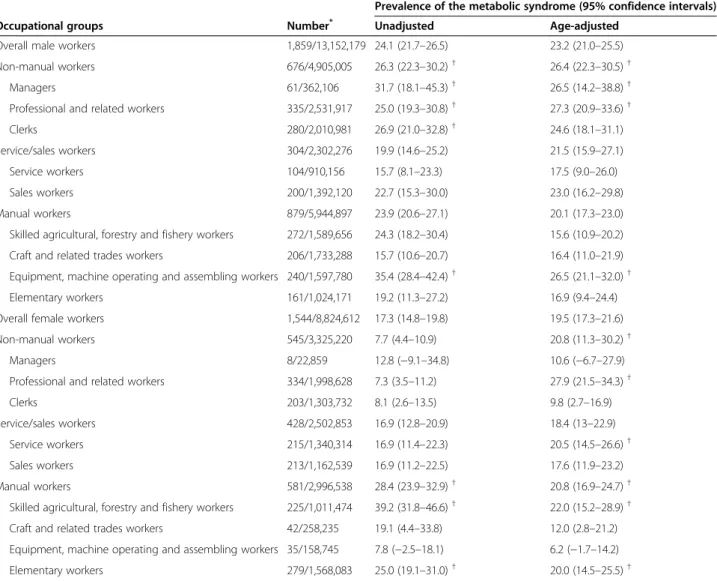
Unadjusted and age-adjusted prevalence estimates for each occupational group stratified by gender are pre- sented in Table 4. In the male workers, the overall unadjusted and age-adjusted prevalence estimates of the metabolic syndrome were 24.1% (95% CI: 21.7-26.5%) and 23.2% (95% CI: 21.0-25.5%), respectively. The preva- lence estimates in male non-manual workers were 26.3%
(95% CI: 22.3-30.2%) and 26.4% (95% CI: 22.3-30.5%), re- spectively, after age adjustment, which were the highest among the three occupational groups. In the occu- pational subgroups, “equipment, machine operation and assembling” workers showed the highest unadjusted prevalence of the metabolic syndrome (35.4%, 95% CI:
28.4-42.4%), followed by “managers” (31.7%, 95% CI:
18.1-45.3%) and “clerks” (26.9%, 95% CI: 21.0-32.8%).
The highest age-adjusted prevalence for male workers was found in “professional and related” workers (27.3%, 95% CI: 20.9-33.6%), followed by “equipment, machine operation and assembling” workers (26.5%, 95% CI:
21.1-32.0%) and“managers” (26.5%, 95% CI: 14.2-38.8%).
In the female workers, the estimates of overall unad- justed and age-adjusted prevalence of the metabolic syndrome were 17.3% (95% CI: 14.8-19.8%) and 19.5%
(95% CI: 17.3-21.6%), respectively. Among the female workers, the age-adjusted prevalence of the metabolic syndrome was similar in both non-manual (20.8%, 95%
CI: 11.3-30.2%) and manual (20.8%, 95% CI: 16.9-24.7%) workers, while the unadjusted prevalence was highest in manual workers (28.4%, 95% CI: 23.9-32.9%) and was lowest in non-manual workers (7.7%, 95% CI: 4.4-10.9%).
In the individual occupational groups, the highest unad- justed prevalence was documented in“skilled agricultural, forestry and fishery” workers (39.2%, 95% CI: 31.8-46.6%), followed by “elementary” workers (25.0%, 95% CI: 19.1- 31.0%) and“craft and related trades” workers (19.1%, 95%
CI: 4.4-33.8%).“Professional and related” workers showed the highest age-adjusted prevalence of the metabolic syndrome among the female workers (27.9%, 95% CI:
21.5-34.3%), followed by“skilled agricultural, forestry and fishery” workers (22.0%, 95% CI: 15.2-28.9).
Ryu et al. Annals of Occupational and Environmental Medicine 2013, 25:13 Page 3 of 14
http://www.aoemj.com/content/25/1/13
Table 1 Demographic characteristics by major category of the Korean Standard Classification of Occupations among male workers Managers Professional and
related workers
Clerks Service workers
Sales workers
Skilled agricultural, forestry and fishery workers
Craft and related trades workers
Equipment, machine operation and assembling workers
Elementary workers
Total p-value
Age (years)* 50.9 (1.3) 38.2 (0.7) 39.1(0.7) 36.8 (1.4) 41.2 (1.2) 56.4 (1.4) 42.7 (0.9) 45.1 (1.1) 46.1 (1.7) 44.1 (0.4) < 0.001
Education < 0.001
≤ Elementary school 0.0 (0.0) 0.6 (0.4) 0.4 (0.4) 4.9 (2.1) 6.5 (2.1) 41.5 (3.3) 14.2 (2.7) 7.7 (1.8) 21.7 (4.3) 10.7 (1.1)
Middle school 16.3 (5.6) 0.4 (0.3) 1.7 (1.0) 6.4 (2.4) 7.6 (2.2) 20.8 (3.9) 13.9 (2.5) 19.7 (3.0) 17.5 (3.6) 10.3 (0.9)
High school 31.8 (6.7) 21.0 (3.6) 27.6 (3.4) 56.3 (5.4) 45.7 (4.4) 24.9 (3.2) 53.3 (4.0) 56.9 (4.0) 50.5 (4.9) 39.2 (1.5)
≥ University 51.8 (6.7) 78.0 (3.6) 70.3 (3.6) 32.4 (4.8) 40.2 (3.9) 12.8 (2.8) 18.6 (3.0) 15.7 (3.2) 10.3 (2.8) 39.8 (1.7)
Household income < 0.001
Low 3.7 (2.7) 6.7 (1.8) 2.7 (1.1) 6.5 (2.7) 9.3 (2.2) 24.1 (4.0) 12.3 (2.8) 8.6 (2.4) 26.5 (4.2) 10.9 (1.0)
Low-middle 10.6 (4.4) 17.1 (2.7) 24.5 (2.8) 34.6 (2.7) 27.6 (3.6) 28.2 (4.3) 35.4 (3.7) 26.9 (3.5) 29.2 (4.3) 26.4 (1.4)
Middle-high 29.2 (7.2) 39.0 (3.0) 33.9 (3.1) 25.0 (4.4) 36.1 (4.3) 18.2 (2.6) 29.0 (3.4) 37.6 (3.6) 29.5 (4.9) 31.9 (1.4)
High 56.5 (6.1) 37.3 (2.9) 38.9 (3.7) 33.9 (5.2) 27.0 (3.7) 29.5 (4.2) 23.4 (3.3) 26.9 (3.4) 14.8 (3.6) 30.7 (1.6)
High-risk drinking 0.002
Never 17.5 (5.2) 12.7 (2.1) 14.1 (2.3) 7.4 (2.6) 13.0 (2.7) 18.1 (3.6) 14.1 (2.5) 14.8 (2.3) 26.4 (4.6) 14.8 (1.0)
Once a month 13.4 (6.3) 46.3 (3.4) 38.9 (3.3) 44.4 (5.8) 33.7 (4.0) 32.6 (4.3) 42.5 (4.5) 39.2 (4.3) 35.9 (5.5) 40.0 (1.5)
Once a weak 30.0 (6.6) 30.2 (3.2) 38.3 (3.6) 35.5 (5.3) 43.6 (4.3) 26.2 (4.1) 28.8 (3.8) 29.7 (3.5) 20.2 (4.7) 31.8 (1.2)
Everyday 9.1 (4.2) 10.7 (2.0) 8.7 (2.2) 12.7 (3.6) 9.8 (2.6) 23.2 (3.3) 14.6 (2.7) 16.3 (3.2) 17.5 (4.0) 13.4 (1.1)
Smoking status 0.027
Non-smoker 15.0 (4.4) 23.7 (2.4) 17.7 (2.6) 18.7 (3.9) 17.9 (3.1) 13.9 (2.8) 12.0 (2.4) 10.9 (2.5) 15.5 (3.9) 16.5 (1.0)
Ex-smoker 41.1 (6.1) 30.1 (2.9) 31.6 (2.8) 23.9 (4.4) 31.8 (3.7) 41.8 (3.0) 32.7 (3.6) 34.4 (3.1) 29.5 (4.3) 32.6 (1.3)
Current smoker 43.9 (6.0) 46.3 (3.4) 50.8 (2.9) 57.4 (5.1) 50.3 (4.4) 44.3 (3.5) 55.4 (3.7) 54.7 (3.4) 55.0 (5.3) 50.9 (1.4)
Vigorous physical activity < 0.001
None 66.2 (6.4) 53.3 (3.8) 44.4 (3.6) 52.1 (5.1) 50.2 (3.5) 60.7 (3.3) 53.3 (4.2) 49.4 (3.7) 58.8 (5.2) 52.7 (1.4)
< 5 days per week 30.3 (6.1) 42.8 (3.9) 49.7 (3.6) 35.7 (5.2) 37.1 (4.1) 21.8 (2.8) 36.1 (4.1) 41.4 (3.7) 26.4 (5.2) 37.6 (1.4)
≥ 5 days per week 3.5 (2.1) 3.8 (1.2) 5.8 (1.4) 12.3 (3.6) 12.7 (3.0) 17.5 (2.6) 10.7 (2.2) 9.2 (2.4) 14.8 (4.1) 9.7(0.8)
Work hours < 0.001
≤ 40 hours per week 48.8 (6.5) 41.0 (3.6) 42.6 (3.3) 28.5 (4.7) 28.3 (3.9) 37.8 (4.4) 25.6 (2.9) 23.6 (3.2) 39.4 (4.8) 34.4 (1.3)
> 40 hours per week 51.2 (6.5) 59.0 (3.6) 57.4 (3.3) 71.5 (4.7) 71.7 (3.9) 62.2 (4.4) 74.4 (2.9) 76.4 (3.2) 60.6 (4.8) 65.6 (1.3)
Work schedule pattern < 0.001
Day 92.0 (4.5) 81.7 (2.5) 90.9 (2.2) 48.6 (5.7) 84.8 (3.0) 99.8 (0.2) 87.2 (3.5) 72.9 (3.3) 68.5 (4.1) 82.2 (1.2)
Night/overnight 3.7 (2.0) 13.6 (2.3) 2.6 (1.1) 26.3 (5.3) 14.2 (3.0) 0.1 (0.1) 2.0 (1.3) 8.7 (2.0) 11.3 (2.8) 8.6 (0.8)
Ryuetal.AnnalsofOccupationalandEnvironmentalMedicine2013,25:13Page4of14http://www.aoemj.com/content/25/1/13
Table 1 Demographic characteristics by major category of the Korean Standard Classification of Occupations among male workers (Continued)
Shift 0.0 1.5 (0.9) 5.2 (1.9) 15.5 (4.1) 0.3 (0.2) 0.0 8.4 (2.7) 11.3 (2.5) 19.4 (3.2) 6.3 (0.8)
Others 4.2 (4.1) 3.2 (1.0) 1.3 (0.7) 9.6 (2.7) 0.7 (0.5) 0.1 (0.1) 2.4 (2.0) 7.1 (2.2) 0.8 (0.7) 2.9 (0.5)
BMI category 0.230
Normal/underweight 55.2 (7.6) 56.6 (3.0) 58.1 (3.5) 60.5 (5.8) 62.8 (4.2) 68.5 (3.5) 61.4 (3.3) 62.2 (3.7) 67.0 (4.5) 61.3 (1.4)
Overweight 37.5 (6.4) 39.3 (2.9) 36.4 (3.6) 37.7 (5.7) 30.5 (3.7) 30.8 (3.4) 35.2 (3.2) 33.5 (3.6) 30.1 (4.5) 34.7 (1.3)
Obese 7.3 (3.7) 4.1 (1.3) 5.5 (1.7) 1.8 (1.3) 6.7 (2.0) 0.7 (0.5) 3.4 (1.5) 4.3 (1.5) 2.9 (1.4) 3.9 (0.6)
*Estimated mean (standard error).
Ryuetal.AnnalsofOccupationalandEnvironmentalMedicine2013,25:13Page5of14http://www.aoemj.com/content/25/1/13
Table 2 Demographic characteristics by major category of the Korean Standard Classification of Occupations among female workers Managers Professional and
related workers
Clerks Service workers
Sales workers
Skilled agricultural, forestry and fishery workers
Craft and related trades workers
Equipment, machine operation and assembling workers
Elementary workers
Total p-value
Age (yr)* 54.1 (3.9) 34.2 (0.6) 33.7 (0.7) 43.2 (1.0) 43.2 (1.0) 57.4 (1.5) 49.1 (2.9) 41.8 (2.4) 51.7 (1.0) 45.4 (0.6) < 0.001
Education < 0.001
≤ Elementary school 0.0 (0.0) 0.6 (0.3) 0.3 (0.3) 21.7 (3.3) 18.4 (2.6) 67.2 (4.7) 30.4 (9.7) 16.5 (7.4) 39.8 (3.0) 22.3 (1.9)
Middle school 18.2 (15.1) 0.6 (0.4) 2.2 (1.0) 18.3 (2.9) 13.3 (2.5) 15.5 (4.5) 34.5 (8.4) 17.2 (7.6) 18.5 (3.4) 11.6 (1.1)
High school 18.4 (12.9) 17.1 (2.5) 50.1 (3.9) 47.3 (3.6) 47.6 (3.7) 15.0 (4.2) 31.8 (7.6) 60.4 (10.3) 34.7 (3.7) 34.5 (1.7)
≥ University 63.3 (18.0) 81.7 (2.5) 47.4 (4.1) 12.6 (2.7) 20.7 (3.0) 2.3 (1.4) 3.3 (2.3) 5.8 (4.1) 6.9 (1.8) 31.5 (1.8)
Household income < 0.001
Low 0.0 (0.0) 4.0 (1.4) 2.6 (1.2) 10.0 (2.3) 12.1 (2.3) 35.7 (4.9) 30.6 (9.4) 0.0 (0.0) 25.1 (2.9) 14.2 (1.3)
Low-middle 1.2 (1.2) 17.2 (2.7) 20.7 (3.8) 31.1 (3.6) 23.0 (3.8) 25.6 (3.2) 23.6 (6.1) 23.9 (7.7) 36.9 (3.4) 25.4 (1.5)
Middle-high 14.6 (13.3) 37.4 (3.3) 36.8 (4.2) 30.7 (3.8) 35.4 (3.8) 18.0 (3.3) 28.2 (7.6) 45.2 (10.9) 22.6 (2.5) 30.8 (1.5)
High 84.2 (13.4) 41.4 (3.4) 40.0 (3.8) 28.2 (3.3) 29.6 (3.7) 20.7 (3.2) 17.6 (6.5) 30.9 (9.5) 15.4 (2.6) 29.6 (1.6)
High-risk drinking < 0.001
Never 77.4 (15.6) 39.6 (3.5) 31.7 (3.9) 35.9 (3.9) 43.6 (3.8) 57.0 (5.4) 18.5 (6.7) 37.1 (11.3) 42.7 (5.0) 39.8 (1.7)
Once a month 22.6 (15.6) 45.0 (3.7) 52.9 (4.3) 43.5 (4.0) 37.8 (4.2) 38.4 (4.4) 58.6 (9.3) 59.8 (11.7) 35.9 (3.9) 43.6 (4.6)
Once a weak 0.0 (0.0) 15.4 (3.2) 14.7 (3.0) 13.6 (2.6) 17.2 (3.3) 4.0 (2.2) 19.5 (8.5) 3.1 (3.1) 14.3 (3.3) 13.8 (1.3)
Everyday 0.0 (0.0) 0.0 (0.0) 0.7 (0.7) 7.0 (2.0) 1.3 (1.3) 0.6 (0.6) 3.4 (2.6) 0.0 (0.0) 7.1 (3.0) 2.7 (0.6)
Smoking status 0.015
Non-smoker 100.0 (0.0) 88.5 (1.9) 86.3 (2.7) 86.0 (3.1) 83.4 (3.0) 96.4 (1.7) 91.8 (5.6) 96.7 (3.3) 83.0 (3.2) 87.4 (1.2)
Ex-smoker 0.0 (0.0) 7.5 (1.6) 7.9 (2.2) 4.9 (1.7) 9.5 (2.4) 2.3 (1.4) 8.0 (5.6) 0.0 (0.0) 5.4 (1.7) 6.3 (0.8)
Current smoker 0.0 (0.0) 4.0 (1.1) 5.8 (1.8) 9.2 (2.9) 7.1 (2.2) 1.3 (0.8) 0.1 (0.1) 3.3 (3.3) 11.6 (3.1) 6.3 (0.9)
Vigorous physical activity 0.007
None 55.8 (18.7) 74.1 (3.1) 70.2 (3.7) 70.1 (3.7) 69.5 (3.8) 76.1 (4.1) 86.3 (5.4) 61.5 (8.8) 75.0 (3.2) 72.9 (1.4)
< 5 days per week 44.2 (18.7) 21.8 (2.9) 26.2 (3.6) 20.4 (3.6) 23.7 (3.3) 11.4 (2.7) 6.5 (3.6) 23.9 (8.4) 16.2 (2.4) 19.8 (1.2)
≥ 5 days per week 0.0 (0.0) 4.1 (1.3) 3.6 (1.4) 9.5 (2.3) 6.8 (2.0) 12.5 (3.3) 7.2 (4.3) 14.6 (5.6) 8.8 (2.0) 7.3 (0.8)
Work hours < 0.001
≤ 40 hours per week 80.4 (13.9) 57.0 (3.5) 52.4 (4.2) 33.7 (4.0) 48.9 (4.0) 50.9 (4.0) 29.4 (7.3) 35.9 (9.9) 64.5 (3.6) 51.2 (1.6)
> 40 hours per week 19.6 (13.9) 43.0 (3.5) 47.6 (4.2) 66.3 (4.0) 51.1 (4.0) 49.1 (4.0) 70.6 (7.3) 64.1 (9.9) 35.5 (3.6) 48.8 (1.6)
Work schedule pattern <0.001
Day 93.8 (5.4) 74.8 (3.2) 94.3 (2.0) 70.2 (3.7) 77.7 (3.4) 99.0 (0.7) 93.0 (4.6) 74.2 (9.6) 85.8 (2.7) 82.7 (1.5)
Night/overnight 5.1 (5.1) 18.9 (3.0) 3.2 (1.5) 24.5 (3.4) 15.6 (2.9) 0.0 4.6 (2.6) 6.1 (3.8) 12.0 (2.6) 12.9 (1.3)
Ryuetal.AnnalsofOccupationalandEnvironmentalMedicine2013,25:13Page6of14http://www.aoemj.com/content/25/1/13
Table 2 Demographic characteristics by major category of the Korean Standard Classification of Occupations among female workers (Continued)
Shift 1.1 (1.2) 3.8 (1.5) 1.7 (1.3) 2.2 (0.9) 3.7 (1.7) 0.3 (0.3) 2.4 (2.4) 8.1 (6.1) 1.2 (0.6) 2.4 (0.5)
Others 0.0 2.5 (1.0) 0.7 (0.5) 3.1 (1.2) 3.0 (1.4) 0.7 (0.6) 0.0 11.6 (9.0) 1.0 (0.5) 2.0 (0.4)
BMI category 0.009
Normal/underweight 82.8 (11.7) 82.9 (2.5) 79.7 (3.2) 72.2 (3.2) 68.5 (4.0) 66.8 (4.4) 69.4 (8.0) 70.3 (9.6) 70.9 (2.6) 74.2 (1.3)
Overweight 17.2 (11.7) 14.5 (2.2) 15.0 (2.6) 22.5 (3.0) 27.6 (4.0) 26.4 (3.3) 30.5 (8.0) 17.3 (7.8) 24.4 (2.7) 21.2 (1.1)
Obese 0.0 (0.0) 2.6 (1.2) 5.2 (1.9) 5.3 (1.8) 3.9 (1.5) 6.8 (1.9) 0.1 (0.1) 12.4 (7.0) 4.7 (1.3) 4.5 (0.7)
*Estimated mean (standard error).
Ryuetal.AnnalsofOccupationalandEnvironmentalMedicine2013,25:13Page7of14http://www.aoemj.com/content/25/1/13
Table 3 The prevalence of the metabolic syndrome according to demographic characteristics
Male Female
Demographics Number*† Prevalence (95% confidence intervals)‡ Number*† Prevalence (95% confidence intervals)‡ Age group
20–29 years 152/1,942,533 9.2 (4.1–14.3) 231/1,733,502 3.5 (0.7–6.2)
30–39 years 428/3,276,013 17.8 (13.5–22.1) 291/1,634,571 5.5 (2.0–9.0)
40–49 years 477/3,659,709 25.9 (21.3–30.4) 371/2,433,142 12.5 (8.2–16.8)
50–59 years 392/2,681,787 35.7 (30.2–41.2) 374/1,891,022 30.8 (25.2–36.5)
60–69 years 297/1,176,249 36.4 (29.5–43.3) 188/758,966 38.0 (30.1–45.8)
≥ 70 years 113/415,885 17.4 (9.1–25.8) 93/373,407 53.5 (43.5–63.4)
Education
≤ Elementary school 262/1,377,314 28.7 (21.5–35.8) 407/1,912,522 40.9 (35.6–46.2)
Middle school 218/1,385,292 35.9 (29.0–42.8) 175/989,224 24.4 (16.6–32.3)
High school 637/5,078,713 20.1 (16.4–23.7) 491/3,089796 9.3 (6.1–12.5)
≥ University 742/5,310,859 23.6 (19.9–27.4) 481/2,833,069 7.6 (4.2–11.1)
Household income
Low 224/1,362,396 25.9 (18.9–32.9) 239/1,171,008 35.3(28.6–41.9)
Low–middle 476/3,488,782 21.4 (16.9–25.8) 366/2,177,822 19.8 (15.3–24.2)
Middle–high 568/4,173,072 23.8 (19.4–28.2) 448/2,712,764 14.3 (10.7–18.0)
High 575/4,051,739 25.5 (21.1–29.9) 481/2,648,160 10.4 (7.1–13.7)
High–risk drinking
Never 275/1,681,687 14.7 (9.6–19.9) 473/2,633,998 15.4 (11.2–19.7)
Once a month 644/4,713,082 21.2 (17.4–24.9) 494/2,956,125 12.8 (9.3–16.4)
Once a weak 490/3,727,662 26.0 (21.6–30.4) 130/932,867 17.4 (9.6–25.2)
Everyday 226/1,602,909 38.1 (30.7–45.5) 23/152,018 31.1 (8.8–53.4)
Smoking status
Non–smoker 320/2,194,133 19.5 (14.4–24.5) 1,394/7,721,944 17.5 (14.9–20.2)
Ex–smoker 697/4,369,598 27.0 (22.9–31.0) 81/546,406 16.0 (7.0–25.0)
Current smoker 841/6,585,245 23.7 (20.1–27.3) 78/547,078 15.8 (6.7–24.9)
Vigorous physical activity
None 1,035/6,872,680 25.0 (21.9–28.1) 1,144/6,444,936 17.8 (14.4–20.7)
< 5 days per week 659/4,976,027 23.7 (19.5–28.0) 293/1,726,743 17.3 (12.5–22.2)
≥ 5 days per week 164/1,300,269 20.2 (12.7–27.8) 115/633,191 14.8 (7.9–21.7) Work hours
≤ 40 hours per week 666/4,555,070 22.5 (18.6–26.5) 819/4,514,730 17.3 (13.9–20.7)
> 40 hours per week 1,193/8,597,108 24.9 (21.8–28.0) 735/4,309,882 17.3 (14.3–20.4) Work schedule pattern
Day working 1,526/10,805,797 24.5 (21.9–271) 1,312/7,305,852 18.3 (15.4–21.2) Non–day working 328/2,319,154 22.0 (16.6–27.4) 238/1,501,207 12.4 (6.8–18.1) BMI category
Underweight 40/272,239 0.0 (0.0–0.0) 85/539,963 0.0 (0.0–0.0)
Normal 1,099/7,673,502 12.9 (10.3–15.4) 1,053/6,039,293 9.4 (7.5–11.4)
Overweight 654/4,672,170 39.1 (34.3–43.9) 350/1,858,859 41.9 (35.7–48.1)
Obese 61/500,005 68.3 (54.1–82.5) 65/384,483 46.1 (32.3–59.9)
*Subject number/estimated population number.†Subject number varies due to item which was not answered.‡Unadjusted prevalence of the metabolic syndrome (95% confidence intervals).
Ryu et al. Annals of Occupational and Environmental Medicine 2013, 25:13 Page 8 of 14
http://www.aoemj.com/content/25/1/13
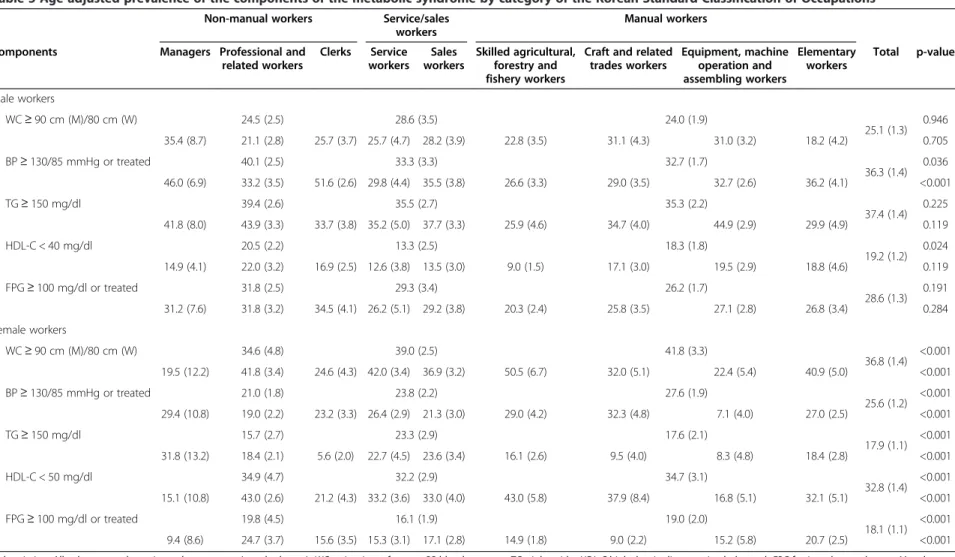
Table 5 shows the age-adjusted prevalence of the individual components of the metabolic syndrome by oc- cupational group. Among the three occupational groups of non-manual, service/sales, and manual workers, the non-manual workers had the highest prevalence of high blood pressure (40.1%), hypertriglyceridemia (39.4%), low HDL-cholesterol level (20.5%), and hyperglycemia (31.8%) among the male workers. The highest prevalence of ab- dominal obesity was found in the service/sales workers among the male workers (28.6%). In the occupational subgroups, the prevalence estimate of abdominal obesity for male workers was highest in the “managers” (35.4%), followed by“craft and related trades” workers (31.1%) and
“equipment, machine operation and assembling” workers (31.1%). “Clerks” also showed the highest prevalence of high blood pressure (51.6%) and hyperglycemia (34.5%) for male workers. Among the male workers, the highest
prevalence of hypertriglyceridemia was found in the
“equipment, machine operation and assembling” workers (44.9%), and the highest prevalence of low HDL- cholesterol levels was identified in the “professional and related” workers (22.0%), followed by “equipment, ma- chine operation and assembling” workers (19.5%). Unlike the male workers, the prevalence of abdominal obesity among the female workers was highest in the“skilled agri- cultural, forestry and fishery” workers (50.5%), followed by
“service” workers (42.0%), “professional and related”
workers (41.8%), and “elementary” workers (40.9%). The highest prevalence of high blood pressure among the female workers was documented in the“craft and related trades” workers (32.3%). The highest prevalence of hypertriglyceridemia was found in the“managers” (31.8%).
In the female workers, the “skilled agricultural, forestry and fishery” workers (43.0%) and “professional and Table 4 Unadjusted and age-adjusted prevalence of the metabolic syndrome by category of the Korean Standard Classification of Occupations stratified by gender
Prevalence of the metabolic syndrome (95% confidence intervals)
Occupational groups Number* Unadjusted Age-adjusted
Overall male workers 1,859/13,152,179 24.1 (21.7–26.5) 23.2 (21.0–25.5)
Non-manual workers 676/4,905,005 26.3 (22.3–30.2)† 26.4 (22.3–30.5)†
Managers 61/362,106 31.7 (18.1–45.3)† 26.5 (14.2–38.8)†
Professional and related workers 335/2,531,917 25.0 (19.3–30.8)† 27.3 (20.9–33.6)†
Clerks 280/2,010,981 26.9 (21.0–32.8)† 24.6 (18.1–31.1)
Service/sales workers 304/2,302,276 19.9 (14.6–25.2) 21.5 (15.9–27.1)
Service workers 104/910,156 15.7 (8.1–23.3) 17.5 (9.0–26.0)
Sales workers 200/1,392,120 22.7 (15.3–30.0) 23.0 (16.2–29.8)
Manual workers 879/5,944,897 23.9 (20.6–27.1) 20.1 (17.3–23.0)
Skilled agricultural, forestry and fishery workers 272/1,589,656 24.3 (18.2–30.4) 15.6 (10.9–20.2)
Craft and related trades workers 206/1,733,288 15.7 (10.6–20.7) 16.4 (11.0–21.9)
Equipment, machine operating and assembling workers 240/1,597,780 35.4 (28.4–42.4)† 26.5 (21.1–32.0)†
Elementary workers 161/1,024,171 19.2 (11.3–27.2) 16.9 (9.4–24.4)
Overall female workers 1,544/8,824,612 17.3 (14.8–19.8) 19.5 (17.3–21.6)
Non-manual workers 545/3,325,220 7.7 (4.4–10.9) 20.8 (11.3–30.2)†
Managers 8/22,859 12.8 (−9.1–34.8) 10.6 (−6.7–27.9)
Professional and related workers 334/1,998,628 7.3 (3.5–11.2) 27.9 (21.5–34.3)†
Clerks 203/1,303,732 8.1 (2.6–13.5) 9.8 (2.7–16.9)
Service/sales workers 428/2,502,853 16.9 (12.8–20.9) 18.4 (13–22.9)
Service workers 215/1,340,314 16.9 (11.4–22.3) 20.5 (14.5–26.6)†
Sales workers 213/1,162,539 16.9 (11.2–22.5) 17.6 (11.9–23.2)
Manual workers 581/2,996,538 28.4 (23.9–32.9)† 20.8 (16.9–24.7)†
Skilled agricultural, forestry and fishery workers 225/1,011,474 39.2 (31.8–46.6)† 22.0 (15.2–28.9)†
Craft and related trades workers 42/258,235 19.1 (4.4–33.8) 12.0 (2.8–21.2)
Equipment, machine operating and assembling workers 35/158,745 7.8 (−2.5–18.1) 6.2 (−1.7–14.2)
Elementary workers 279/1,568,083 25.0 (19.1–31.0)† 20.0 (14.5–25.5)†
*Subject number/estimated population number.†The prevalence estimate for each occupational group was above the upper bound of the 95% confidence interval for the overall prevalence estimate.
Ryu et al. Annals of Occupational and Environmental Medicine 2013, 25:13 Page 9 of 14
http://www.aoemj.com/content/25/1/13
Table 5 Age-adjusted prevalence of the components of the metabolic syndrome by category of the Korean Standard Classification of Occupations
Non-manual workers Service/sales
workers
Manual workers
Components Managers Professional and
related workers
Clerks Service workers
Sales workers
Skilled agricultural, forestry and fishery workers
Craft and related trades workers
Equipment, machine operation and assembling workers
Elementary workers
Total p-value
Male workers
WC≥ 90 cm (M)/80 cm (W) 24.5 (2.5) 28.6 (3.5) 24.0 (1.9)
25.1 (1.3) 0.946
35.4 (8.7) 21.1 (2.8) 25.7 (3.7) 25.7 (4.7) 28.2 (3.9) 22.8 (3.5) 31.1 (4.3) 31.0 (3.2) 18.2 (4.2) 0.705
BP≥ 130/85 mmHg or treated 40.1 (2.5) 33.3 (3.3) 32.7 (1.7)
36.3 (1.4) 0.036
46.0 (6.9) 33.2 (3.5) 51.6 (2.6) 29.8 (4.4) 35.5 (3.8) 26.6 (3.3) 29.0 (3.5) 32.7 (2.6) 36.2 (4.1) <0.001
TG≥ 150 mg/dl 39.4 (2.6) 35.5 (2.7) 35.3 (2.2)
37.4 (1.4) 0.225
41.8 (8.0) 43.9 (3.3) 33.7 (3.8) 35.2 (5.0) 37.7 (3.3) 25.9 (4.6) 34.7 (4.0) 44.9 (2.9) 29.9 (4.9) 0.119
HDL-C < 40 mg/dl 20.5 (2.2) 13.3 (2.5) 18.3 (1.8)
19.2 (1.2) 0.024
14.9 (4.1) 22.0 (3.2) 16.9 (2.5) 12.6 (3.8) 13.5 (3.0) 9.0 (1.5) 17.1 (3.0) 19.5 (2.9) 18.8 (4.6) 0.119
FPG≥ 100 mg/dl or treated 31.8 (2.5) 29.3 (3.4) 26.2 (1.7)
28.6 (1.3) 0.191
31.2 (7.6) 31.8 (3.2) 34.5 (4.1) 26.2 (5.1) 29.2 (3.8) 20.3 (2.4) 25.8 (3.5) 27.1 (2.8) 26.8 (3.4) 0.284
Female workers
WC≥ 90 cm (M)/80 cm (W) 34.6 (4.8) 39.0 (2.5) 41.8 (3.3)
36.8 (1.4) <0.001
19.5 (12.2) 41.8 (3.4) 24.6 (4.3) 42.0 (3.4) 36.9 (3.2) 50.5 (6.7) 32.0 (5.1) 22.4 (5.4) 40.9 (5.0) <0.001
BP≥ 130/85 mmHg or treated 21.0 (1.8) 23.8 (2.2) 27.6 (1.9)
25.6 (1.2) <0.001
29.4 (10.8) 19.0 (2.2) 23.2 (3.3) 26.4 (2.9) 21.3 (3.0) 29.0 (4.2) 32.3 (4.8) 7.1 (4.0) 27.0 (2.5) <0.001
TG≥ 150 mg/dl 15.7 (2.7) 23.3 (2.9) 17.6 (2.1)
17.9 (1.1) <0.001
31.8 (13.2) 18.4 (2.1) 5.6 (2.0) 22.7 (4.5) 23.6 (3.4) 16.1 (2.6) 9.5 (4.0) 8.3 (4.8) 18.4 (2.8) <0.001
HDL-C < 50 mg/dl 34.9 (4.7) 32.2 (2.9) 34.7 (3.1)
32.8 (1.4) <0.001
15.1 (10.8) 43.0 (2.6) 21.2 (4.3) 33.2 (3.6) 33.0 (4.0) 43.0 (5.8) 37.9 (8.4) 16.8 (5.1) 32.1 (5.1) <0.001
FPG≥ 100 mg/dl or treated 19.8 (4.5) 16.1 (1.9) 19.0 (2.0)
18.1 (1.1) <0.001
9.4 (8.6) 24.7 (3.7) 15.6 (3.5) 15.3 (3.1) 17.1 (2.8) 14.9 (1.8) 9.0 (2.2) 15.2 (5.8) 20.7 (2.5) <0.001
Abbreviation: All values were the estimated percentage (standard error). WC waist circumference, BP blood pressure, TG triglyceride, HDL-C high-density lipoprotein cholesterol, FPG fasting plasma glucose, M male, F female.
Ryuetal.AnnalsofOccupationalandEnvironmentalMedicine2013,25:13Page10of14http://www.aoemj.com/content/25/1/13
related” workers (43.0%) showed the highest prevalence of low HDL-cholesterol levels. However, the prevalence of low HDL-cholesterol levels among male workers was lowest in the “skilled agricultural, forestry and fishery”
workers (9.0%). The prevalence of hyperglycemia among the female workers was highest in the “professional and related” workers (24.7%).
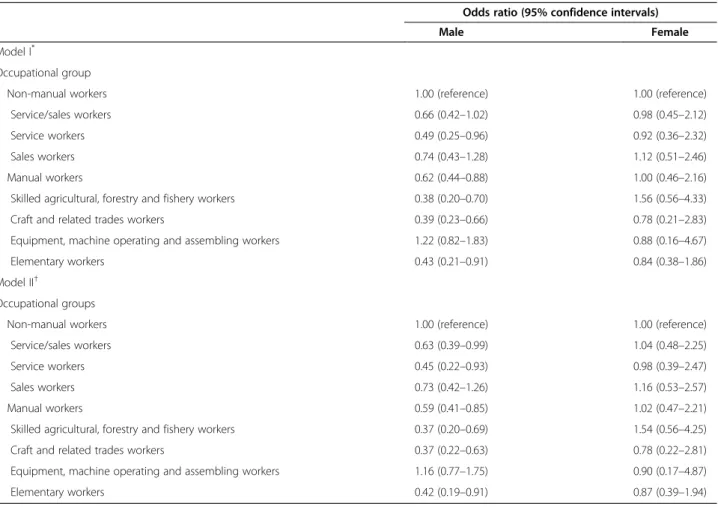
Table 6 shows the results of multiple logistic regres- sion analyses. Manual workers were significantly less likely to have the metabolic syndrome (odds ratio: 0.62, 95% CI: 1.19-5.86) relative to non-manual workers among male workers after adjustment for age, level of education, household income, high risk drinking, smo- king status, and vigorous physical activity (Model I).
After additional adjustment for work hours and work schedule pattern, both manual (0.63, 95% CI: 0.39-0.99) and service/sales (0.59, 95% CI: 0.41-0.85) workers had significantly lower odds of having the metabolic syndrome compared to non-manual workers among the male wor- kers (Model II). There were no significant associations between the metabolic syndrome and the occupational
group among female workers in either model. When com- paring the subgroups of service/sales and manual workers with the non-manual workers as a reference, “service”
workers,“craft and related trades” workers, and “elemen- tary” workers showed significantly lower odds among the male workers.
Discussion
In this study, we assessed the prevalence of the meta- bolic syndrome by occupational group among Korean workers and evaluated the risk of the metabolic syn- drome among each of the occupational groups. Our study demonstrates variability in the prevalence of the metabolic syndrome by occupational group, and found the greatest risk for the metabolic syndrome in male non-manual workers.
Several studies have identified differences in the preva- lence of the metabolic syndrome by occupational group [8-10]. In Spanish workers, the presence of the meta- bolic syndrome after age adjustment was greatest in the
“machine installers, operators, and assemblers” (15.1%)
Table 6 Multiple logistic regression to assess the relationship between occupation and meeting criteria for the metabolic syndrome among Korean workers aged≥20 years
Odds ratio (95% confidence intervals)
Male Female
Model I*
Occupational group
Non-manual workers 1.00 (reference) 1.00 (reference)
Service/sales workers 0.66 (0.42–1.02) 0.98 (0.45–2.12)
Service workers 0.49 (0.25–0.96) 0.92 (0.36–2.32)
Sales workers 0.74 (0.43–1.28) 1.12 (0.51–2.46)
Manual workers 0.62 (0.44–0.88) 1.00 (0.46–2.16)
Skilled agricultural, forestry and fishery workers 0.38 (0.20–0.70) 1.56 (0.56–4.33)
Craft and related trades workers 0.39 (0.23–0.66) 0.78 (0.21–2.83)
Equipment, machine operating and assembling workers 1.22 (0.82–1.83) 0.88 (0.16–4.67)
Elementary workers 0.43 (0.21–0.91) 0.84 (0.38–1.86)
Model II†
Occupational groups
Non-manual workers 1.00 (reference) 1.00 (reference)
Service/sales workers 0.63 (0.39–0.99) 1.04 (0.48–2.25)
Service workers 0.45 (0.22–0.93) 0.98 (0.39–2.47)
Sales workers 0.73 (0.42–1.26) 1.16 (0.53–2.57)
Manual workers 0.59 (0.41–0.85) 1.02 (0.47–2.21)
Skilled agricultural, forestry and fishery workers 0.37 (0.20–0.69) 1.54 (0.56–4.25)
Craft and related trades workers 0.37 (0.22–0.63) 0.78 (0.22–2.81)
Equipment, machine operating and assembling workers 1.16 (0.77–1.75) 0.90 (0.17–4.87)
Elementary workers 0.42 (0.19–0.91) 0.87 (0.39–1.94)
* Model I: Adjusted for age, level of education, household income, high-risk drinking, smoking status, and vigorous physical activity.
†Model II: Adjusted for Model I factors, plus work hours, and work schedule.
Ryu et al. Annals of Occupational and Environmental Medicine 2013, 25:13 Page 11 of 14
http://www.aoemj.com/content/25/1/13
group among males, with an overall prevalence of 9.5%
(11.6% in male workers and 4.1% in female workers).
Manual workers had a higher prevalence than non- manual workers in both males and females [8].
According to a study of the U.S. working population, the overall prevalence of the metabolic syndrome was 20.6%
(20.2% in male workers and 21.4% in female workers) with the greatest unadjusted prevalence among “trans- portation and material occupations” (33.1%) and the greatest age-adjusted prevalence among “food prepar- ation and food service workers” (31.1%) [9]. In a study using the KNHANES (2005) data, the prevalence of the metabolic syndrome among Korean workers was found to be 21.8% (22.5% in male worker and 15.9% in female), and the prevalence was higher in manual workers than in non-manual workers [10].
In this study, non-manual workers showed higher un- adjusted and age-adjusted prevalences of the metabolic syndrome than service/sales and manual workers among the male workers. Most of the workers in the non- manual groups spend most of their work hours seden- tary [15]. Furthermore, they may also engage in less physical activity relative to other workers. Actually, the proportion of those engaging in vigorous physical acti- vity at least 5 days a week in these groups was lower than in the other workers in this study.
In the male non-manual group, the “managers”
showed the highest prevalence estimate (31.7%), but the prevalence in the “equipment, machine operating and assembling” workers was the highest (35.4%) among the nine occupational subgroups before age adjustment. On the other hand, after age adjustment, the highest preva- lence was observed in“professional and related” workers (27.3%), followed by “managers” (26.5%) and “equip- ment, machine operating and assembling” workers (26.5%). The subgroups of non-manual workers includ- ing “managers”, “professional and related” workers, and
“clerks” had a higher level of education and household income than the manual working groups in both the male and female workers. Several studies have shown an inverse association between socioeconomic status and the metabolic syndrome in women, but no association in men [16-18]. However, a recent study of the Korean population using 2007–2008 KNHANES data has reported that socioeconomic status (SES) had a positive association with the metabolic syndrome for men and an inverse association for women [19]. The researchers sug- gested differences in health behaviors including smoking and drinking, food consumption, heath care assessment, and psychological stress according to SES as possible explanations for the inverse association in women. The authors explained that the finding of high prevalence of metabolic syndrome in men with highest household income was consistent with an earlier study using data
from the 1998 to 2001 KNHANES, which showed a positive relationship between obesity and higher SES in men [20]. This positive association among men might be applied to explain the data on the male workers in our study. The subgroups of non-manual male workers in- cluding “managers”, “professional and related” workers, and “clerks” had a higher proportion of overweight and obese individuals than the other occupational groups in our study.
Among the subgroups of male manual workers, only
“equipment, machine operating and assembling” workers showed a significantly higher prevalence of the meta- bolic syndrome than the prevalence for the male workers overall before and after age adjustment, and the pre- valence was similar to the prevalence in non-manual workers. This observation was in concordance with a previous study in Spain, which showed the highest prevalence of the metabolic syndrome in the “machine installers, operators and assemblers” group among all of the occupational groups [8]. When the demographic characteristics of this group were considered, they were found to have a higher level of education (high school education and more) and household income (middle to high) in the manual worker groups. It seems that higher socioeconomic status, among other factors, might have influenced this result.
Among the female workers, although the unadjusted prevalence was greatest in the manual workers (28.4%) and lowest in the non-manual workers (7.3%), this differ- ence disappeared after age standardization (20.8% versus 20.8%, respectively). Among the subgroups of the female non-manual workers, “professional and related” workers showed the lowest unadjusted prevalence of the meta- bolic syndrome (7.3%) and the highest age-adjusted prevalence (27.9%). This was the main cause for the in- crease in the overall prevalence in non-manual workers after age adjustment. Although not presented in this paper, the age distribution of female “professional and related” workers was skewed toward younger ages. At this age group, the prevalence of the metabolic syn- drome was lower, but compared to the younger group, the prevalence in the older age group was extremely high. In the multiple logistic regression analysis, there was no significant association found between occupa- tional groups and the metabolic syndrome in female workers.
Unlike the prevalence estimate of the male “skilled agricultural, forestry and fishery” workers, which was significantly lower than the overall male prevalence after age adjustment, female workers of the same occu- pational group continued to show significantly higher prevalence of the metabolic syndrome compared to the overall prevalence after age adjustment. This distinct feature was also evident in the analysis of individual
Ryu et al. Annals of Occupational and Environmental Medicine 2013, 25:13 Page 12 of 14
http://www.aoemj.com/content/25/1/13