© 2014 Korean Breast Cancer Society. All rights reserved. http://ejbc.kr | pISSN 1738-6756
INTRODUCTION
The Gail model is one of the most widely used breast cancer risk assessment tools. The original Gail model [1] was devel- oped from case-control subsamples of patients undergoing annual mammographic screening through the Breast Cancer
Detection and Demonstration Project (BCDDP). It used five risk factors: age, age at menarche, the number of previous breast biopsies, age at first live birth, and the number of first- degree relatives with breast cancer. The National Surgical Ad- juvant Breast and Bowel Project (NSABP) modified this mod- el by excluding the incidence of ductal carcinoma in situ (DCIS) and including the risk factor of atypical ductal hyper- plasia. This modified Gail model was used for the inclusion criteria of the NSABP P-1 [2] and P-2 [3] trials.
The incidence of breast cancer in Asian women is lower than that in Western women, and the Gail model for Ameri- can women has been shown to overestimate the risk of breast cancer for Asian women [4]. As such, it is necessary to devel- op a breast cancer risk assessment tool especially for Asian
Validation of Risk Assessment Models for Predicting the Incidence of Breast Cancer in Korean Women
Jun Won Min, Myung-Chul Chang, Hae Kyung Lee1, Min Hee Hur1, Dong-Young Noh2, Jung Han Yoon3, Yongsik Jung4, Jung-Hyun Yang5, Korean Breast Cancer Society
Department of Surgery, Dankook University College of Medicine, Cheonan; 1Department of Surgery, Cheil General Hospital and Women’s Healthcare Center, Kwandong University College of Medicine, Seoul; 2Department of Surgery, Seoul National University College of Medicine, Seoul; 3Department of Surgery, Chonnam National University Hwasun Hospital, Hwasun; 4Department of Surgery, Ajou University School of Medicine, Suwon; 5Department of Surgery, Konkuk University School of Medicine, Seoul, Korea
ORIGINAL ARTICLE
Purpose: The Gail model is one of the most widely used tools to assess the risk of breast cancer. However, it is known to over
estimate breast cancer risk for Asian women. Here, we validate the Gail model and the Korean model using Korean data, and subsequently update and revalidate the Korean model using re
cent data. Methods: We validated the modified Gail model (model 2), Asian American Gail model, and a previous Korean model us
ing screening patient data collected between January 1999 and July 2004. The occurrence of breast cancer was confirmed by matching the resident registration number with data from the Korean Breast Cancer Registration Program. The expectedto
observed (E/O) ratio was used to validate the reliability of the program, and receiver operating characteristics curve analysis was used to evaluate the program’s discriminatory power. There has been a rapid increase in the incidence of breast cancer in Korea, and we updated and revalidated the Korean model using incidence and mortality rate data from recent years. Results:
Among 40,229 patients who were included in the validation, 161 patients were confirmed to have developed breast cancer within 5 years of screening. The E/O ratios and 95% confidence inter
vals (CI) were 2.46 (2.10–2.87) for the modified Gail model and 1.29 (1.11–1.51) for the Asian American Gail model. The E/O ra
tio and 95% CI for the Korean model was 0.50 (0.43–0.59). For the updated Korean model, the E/O ratio and 95% CI were 0.85 (0.73–1.00). In the discriminatory power, the area under curve and 95% CI of the modified Gail model, Asian American Gail model, Korean model and updated Korean model were 0.547 (0.500–0.594), 0.543 (0.495–0.590), 0.509 (0.463–0.556), and 0.558 (0.511–0.605), respectively. Conclusion: The updated Kore
an model shows a better performance than the other three mod
els. It is hoped that this study can provide the basis for a clinical risk assessment program and a future prospective study of breast cancer prevention.
Key Words: Breast neoplasms, Risk assessment, Validation studies
Correspondence to: Myung-Chul Chang
Department of Surgery, Dankook University College of Medicine, 119 Dandae-ro, Dongnam-gu, Cheonan 330-997, Korea Tel: +82-41-550-3930, Fax: +82-41-550-7006 E-mail: [email protected]
The present research has been supported by Korea Breast Cancer Foundation.
Received: November 6, 2013 Accepted: June 23, 2014
Cancer
women. A web-based breast cancer risk assessment program has been developed for Korean women using Korean data from 1999 to 2001 [5]. It uses seven risk factors: age, body mass index, menopausal status, breast feeding status, family history, previous breast test, and age at first delivery [6]. It can calculate the risk of developing breast cancer in the next 5 or 10 years, up to the age of 64 or 74 years. However, to date, the accuracy of the program has not been validated.
Although the incidence of breast cancer in Korean women is lower than that of American women, it has rapidly in- creased in recent years [7]. As such, the Korean model [5], de- veloped using old data, it could underestimate the recent risk of developing breast cancer. It is therefore necessary to update the model with more recent Korean data.
In this study, we initially validate the modified Gail, Asian American Gail, and Korean models using data from the Korean Breast Cancer Registration Program. We then update the Korean model using more recent data on breast cancer inci- dence and mortality in order to improve its performance. We compare the reliability and discriminatory power of the up- dated Korean model with the modified Gail, Asian American Gail, and original Korean models.
METHODS
The modified Gail, Asian American Gail, and Korean models We validated the modified Gail model (model 2) [2], Asian American Gail model [8], and original Korean model [5]. We could not validate the original Gail model (model 1) [1] be- cause it includes the risk of DCIS and its source code is not opened to the public. The characteristics of the risk assess- ment models validated in this study, and the original Gail
model, are summarized in Table 1.
Although the BCDDP was a cohort study, the original Gail model was developed using a case-control subsample of the BCDDP data set [1]. It included 2,852 white cases and 3,146 white controls from the BCDDP data. The original Gail model was subsequently modified to exclude the risk of developing DCIS and to include the risk factor of atypical ductal hyperpla- sia, this model is referred to as model 2. The modified Gail model uses incidence rate data from the Surveillance, Epidemi- ology, and End Results (SEER) program rather than that of the BCDDP. The code for the modified Gail model is available from the National Cancer Institute (NCI)’s website (http://dceg.
cancer.gov/tools/risk-assessment). The log-relative risks of the modified Gail model are described in Supplementary Table 1.
The Asian American Gail model [8] was developed using data from the Asian American Breast Cancer Study [9]. It in- cludes the data from 589 Asian cases and 952 Asian controls who were living in California and Hawaii. It also uses the SEER data on Asian ethnicity. Similar to the modified Gail model, it uses five risk factors. The code for the Asian Ameri- can Gail model is also available from the NCI website. The log-relative risks of the Asian American Gail model are de- scribed in Supplementary Table 2.
The Korean model [5] was developed using data from a Korean case-control study [6]. After logistic regression analy- sis, the Korean model selected seven risk factors. In this mod- el, family history is not limited to first-degree relatives, and previous breast tests include biopsy and imaging tests such as mammography and sonography. The Korean model only esti- mates the risk of invasive breast cancer excluding in situ can- cer. The log-relative risks for the Korean model are described in Supplementary Table 3.
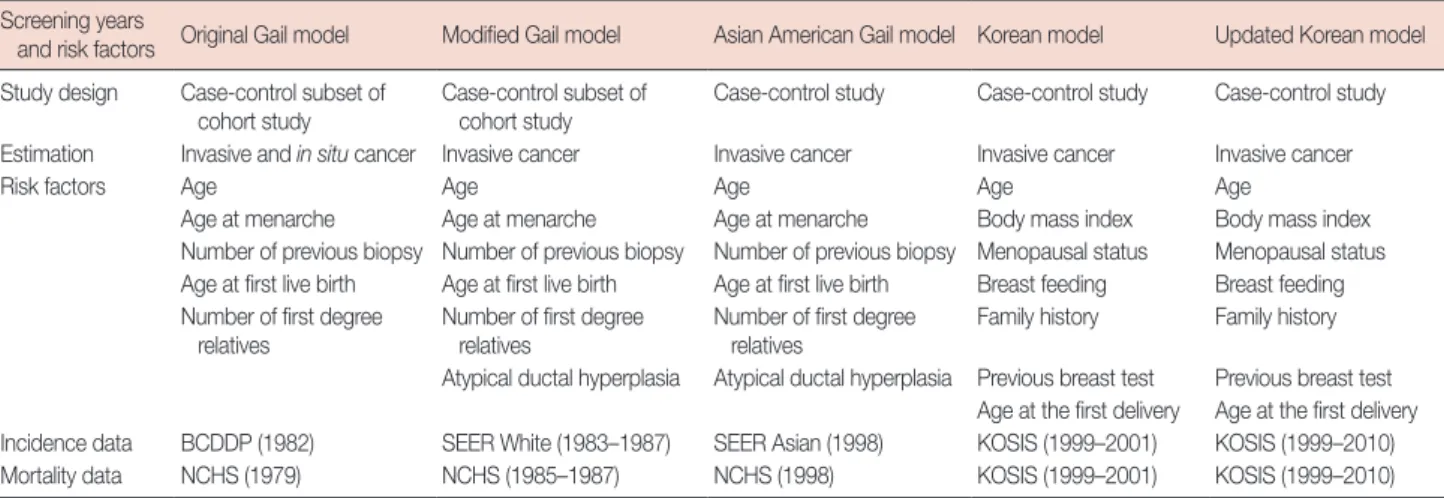
Table 1. The characteristics of breast cancer risk assessment model Screening years
and risk factors Original Gail model Modified Gail model Asian American Gail model Korean model Updated Korean model Study design Case-control subset of
cohort study Case-control subset of
cohort study Case-control study Case-control study Case-control study Estimation Invasive and in situ cancer Invasive cancer Invasive cancer Invasive cancer Invasive cancer
Risk factors Age Age Age Age Age
Age at menarche Age at menarche Age at menarche Body mass index Body mass index Number of previous biopsy Number of previous biopsy Number of previous biopsy Menopausal status Menopausal status Age at first live birth Age at first live birth Age at first live birth Breast feeding Breast feeding Number of first degree
relatives Number of first degree
relatives Number of first degree
relatives Family history Family history Atypical ductal hyperplasia Atypical ductal hyperplasia Previous breast test Previous breast test
Age at the first delivery Age at the first delivery Incidence data BCDDP (1982) SEER White (1983–1987) SEER Asian (1998) KOSIS (1999–2001) KOSIS (1999–2010) Mortality data NCHS (1979) NCHS (1985–1987) NCHS (1998) KOSIS (1999–2001) KOSIS (1999–2010) BCDDP=Breast Cancer Detection and Demonstration Project; SEER=Surveillance, Epidemiology, and End Results; KOSIS=Korean Statistical Information Sys- tem; NCHS=National Center for Health Statistics.
After construction of the log-relative risks, all three models followed the procedure presented below. The log-relative risks were converted to relative risks by exponentiation.
Relative risks (r)=exp (log-relative risks) (1) The risk of breast cancer in all three models was calculated using the competing risk analysis proposed by Gail et al. [1].
The baseline hazard rate (h1) refers to the risk for patients who have no risk factors, and was calculated using the age specific breast cancer incidence rate (h1*), relative risk (ri) and the pro- portions of each risk factor (pi).
h1 (t)= h1*(t)∑iI=1{pi (t)/ri(t)} (2) The risk of breast cancer was calculated by the summation of the products of age specific baseline hazard (h1) by relative risks (r) and adjusted by the probability of surviving compet- ing risks (S2). The risk of breast cancer (P) at the age (α) to time (τ) was calculated as follows:
P{a,τ,r(t)}=∫αα+τh1(t)r(t)exp{-∫αt h1(u)r(u)du}{S2(t)}dt (3) The probability of surviving competing risk (S2) was calculat- ed using the mortality of other causes except breast cancer (h2).
S2(t)=exp{-∫0t h2 (u)du} (4) The incidence rate used for the modified Gail model was estimated by using SEER data from 1983 to 1987, whereas the Asian American Gail model used 1998 SEER data. The mor- tality rate used for the modified Gail model was calculated us- ing National Center for Health Statistics (NCHS) data from 1985 to 1987, whereas the Asian American Gail model used NCHS data from 1998. The Korean model uses incidence and mortality rate data from the Korean Statistical Information System for the years 1999 to 2001 (Table 1).
Data set for the validation study
To evaluate each of the three breast cancer risk assessment models, we used data from breast cancer screening patients at the Women’s Healthcare Center of Cheil General Hospital from January 1999 to July 2004. We collected the patients’
screening dates, their resident registration number, and data regarding the seven risk factors for the Korean model (age, body mass index, menopausal status, breast feeding status, family history, previous breast tests, and age at first delivery).
In addition to collecting the Korean model risk factor data, we also collected data for the for the modified Gail and Asian
American Gail models, namely, the patients’ age at menarche and the number of first-degree relatives they had with breast cancer. Data on the number of previous breast biopsies and the presence of atypical ductal hyperplasia in a biopsy was not available; we were only able to know whether women had previously any breast biopsy. We entered ‘0’ for no biopsy and
‘1’ for any biopsy. In the case of atypical ductal hyperplasia, we entered ‘unknown’ into the atypical ductal hyperplasia field for all biopsy cases.
If patients had been screened for breast cancer more than once, we used the data from their first visit. Cases with en er- ror in the resident registration number or with missing vari- ables were excluded.
Resident registration numbers were used to confirm breast cancer occurrence. With the committee’s permission, the resi- dent registration number was matched with data from the Korean Breast Cancer Registration Program. DCIS data were excluded. In cases where breast cancer occurrence was identi- fied, the date of diagnosis was verified to be within 5 years of breast cancer screening.
Validation of the three risk models
To validate the reliability of the models, we compared the observed number of breast cancers with the number expected from the models according to the risk factors and quintiles of predicted risk. Expected numbers of cases were calculated by summation of the 5-year individual absolute risk as predicted by each model, using equations (1)–(4), given the risk factors for each patient at the start of follow-up. The 95% confidence intervals (CI) of the expected-to-observed (E/O) ratio were calculated as follows:
The discriminatory power of the models was evaluated by the area under the curve (AUC) of the receiver operating char- acteristics (ROC) curve analysis.
Update and revalidation of the Korean model
After validation of the three risk models, we updated the Korean model [5]. The original Korean model used breast cancer incidence and mortality rates from Korean data, but the data from 1999 to 2001 was used. We updated the model by using more recent breast cancer incidence and mortality rates and overall mortality rate [10]. The updated Korean model calculated the breast cancer risk according to the year of the screening visit. We revalidated the updated Korean model using data from the Korean Breast Cancer Registration Program. Microsoft Excel 2007 (Microsoft Inc., Redmond, S2(α)
95% CI for E/O ratio=E-O e±1.96×√ 1-O
Table 2. Expected and observed cancers for categories by screening years and risk factors using modified Gail model Screening years and risk factors No. of cases Expected (E)
breast cancers Observed (O)
breast cancer E/O 95% CI
Overall 40,229 395.46 161 2.46 2.10–2.87
Screening years
1999 10,702 103.70 36 2.88 2.08–3.99
2000 8,028 74.73 13 5.75 3.34–9.90
2001 3,144 32.27 16 2.02 1.24–3.29
2002 3,017 32.52 12 2.71 1.54–4.77
2003 7,422 71.61 33 2.17 1.54–3.05
2004 7,916 80.63 51 1.58 1.20–2.08
Age (yr)
≤29 588 0.43 4 0.11 0.04–0.29
30–39 4,415 15.53 11 1.41 0.78–2.55
40–49 13,026 105.53 53 1.99 1.52–2.61
50–59 16,456 185.89 64 2.90 2.27–3.71
≥60 5,744 88.07 29 3.04 2.11–4.37
Menopausal status
Postmenopausal 23,212 243.27 79 3.08 2.47–3.84
Premenopausal 17,017 152.19 82 1.86 1.49–2.30
Age at menarche (yr)
≥14 34,135 333.63 130 2.57 2.16–3.05
12–13 5,640 56.76 30 1.89 1.32–2.71
≤11 454 5.08 1 5.08 0.72–36.04
No. of affected first degree relatives
0 39,526 382.32 157 2.44 2.08–2.85
1 697 12.94 4 3.23 1.21–8.62
2 or more 6 0.20 0
No. of biopsy
0 38,460 371.62 151 2.46 2.10–2.89
1 1,769 23.84 10 2.38 1.28–4.43
Age at the first birth (yr)
≤19 855 6.55 3 2.18 0.70–6.77
20–24 14,277 125.22 48 2.61 1.97–3.46
25–29 or nulliparous 21,721 221.68 94 2.36 1.93–2.89
≥30 3,376 42.00 16 2.63 1.61–4.29
CI=confidence interval.
USA) and SPSS 19.0 (IBM Inc., Armonk, USA) were used for statistical analyses. The study was approved by the institution- al review board of the Cheil General Hospital (CGH-IRB- 2011-78) and the Dankook University Hospital (DKUH IRB 2011-11-0427).
RESULTS
Validation of the modified Gail, Asian American Gail, and Korean models
A total of 76,727 patients were screened during the study period. After excluding patients who had visited more than once, or had data errors or missing data, 40,229 patients were included in the validation (Figure 1). Among them, 161 pa- tients were confirmed to have developed breast cancer within 5 years of screening.
The expected and observed counts calculated according to
the screening years and risk factors using the modified Gail model are shown in Table 2. Overall, 395.46 patients with can-
Figure 1. Flow chart of data selection process.
76,727 Breast cancer screening patients (1999–2004)
32,591 Visited more than once
225 Errors in resident registration number
3,682 Missing data
40,229 Included for validation
Excluded
Excluded
Excluded
cer were expected and 161 were observed. Overall, the modi- fied Gail model showed an overestimation and the E/O ratio was 2.46 (95% CI, 2.10–2.87). A similar over-estimation was found in the predicted 5-year risk quintiles (Supplementary Table 4).
The Asian American Gail model (Table 3, Supplementary Ta- ble 5) also showed overestimation, and the overall E/O ratio was 1.29 (95% CI, 1.11–1.51). The magnitude of overestimation by the Asian American Gail model was less than that by the modi- fied Gail model.
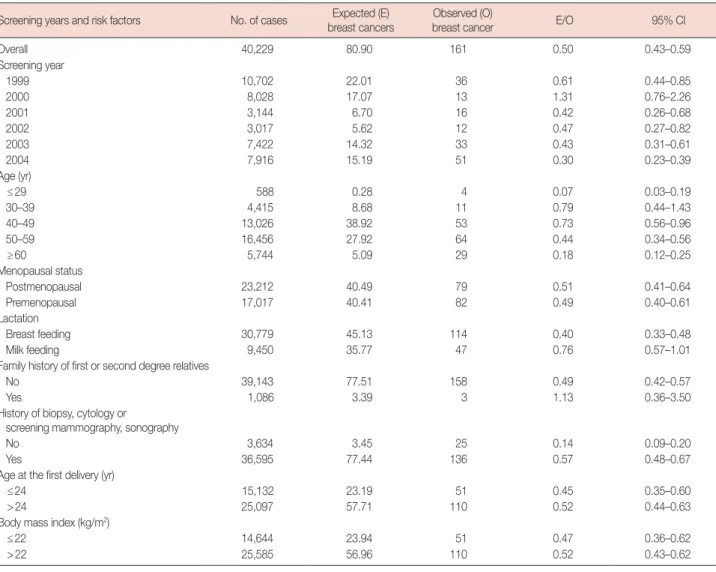
Contrary to the modified Gail and Asian American Gail models, the Korean model (Table 4, Supplementary Table 6) showed an underestimation. Overall, 80.90 patients with can- cer were expected and the E/O ratio was 0.50 (95% CI, 0.43–
0.59). The risk factor and predicted 5-year quintiles were simi- lar to those predicted by the other models.
Update of the Korean model
Having found that the risk of breast cancer is overestimated by the Gail models and underestimated by the Korean model, we proceeded to update the Korean model to achieve a better performance. We updated the models using more recent inci- dence and mortality rate data.
The updated Korean model is available at http://surgery.
dankook.ac.kr/brca2/. In this model, we included the screen- ing year, and breast cancer risk was calculated according to that year. For example, the estimated 5-year breast cancer risk of a 50-year-old postmenopausal woman who is 160 cm tall, 50 kg in weight, delivered her first baby at the age of 22, breast fed her child, had no family and no previous breast tests had a risk of 0.06% in 1999 and 0.12% in 2004. Figure 2 shows the baseline hazards for breast cancer with no risk factors. The baseline hazard increases according to the year, especially for Table 3. Expected and observed cancers for categories by screening years and risk factors using Asian American Gail model
Screening years and risk factors No. of cases Expected (E) breast cancers
Observed (O)
breast cancer E/O 95% CI
Overall 40,229 208.22 161 1.29 1.11–1.51
Screening year
1999 10,702 54.94 36 1.53 1.10–2.12
2000 8,028 39.76 13 3.06 1.78–5.27
2001 3,144 16.95 16 1.06 0.65–1.73
2002 3,017 16.99 12 1.42 0.80–2.49
2003 7,422 37.82 33 1.15 0.81–1.61
2004 7,916 41.76 51 0.82 0.62–1.08
Age (yr)
≤29 588 0.28 4 0.07 0.03–0.19
30–39 4,415 9.43 11 0.86 0.47–1.55
40–49 13,026 58.80 53 1.11 0.85–1.45
50–59 16,456 103.80 64 1.62 1.27–2.07
≥60 5,744 35.91 29 1.24 0.86–1.78
Menopausal status
Postmenopausal 23,212 126.33 79 1.60 1.28–1.99
Premenopausal 17,017 81.90 82 1.00 0.80–1.24
Age at menarche (yr)
≥14 34,135 175.57 130 1.35 1.14–1.60
12–13 5,640 30.03 30 1.00 0.70–1.43
≤11 454 2.62 1 2.62 0.37–18.60
No. of affected first degree relatives
0 39,526 199.97 157 1.27 1.09 –1.49
1 697 8.10 4 2.03 0.76–5.40
2 or more 6 0.15 0
No. of biopsy
0 38,460 192.73 151 1.28 1.09–1.50
1 1,769 15.49 10 1.55 0.83–2.88
Age at the first birth (yr)
≤19 855 2.90 3 0.97 0.31–2.99
20–24 14,277 62.30 48 1.30 0.98–1.72
25–29 or nulliparous 21,721 119.21 94 1.27 1.04–1.55
≥30 3,376 23.81 16 1.49 0.91–2.43
CI=confidence interval.
patients aged 45–49. The baseline hazard for patients aged 45–
49 in 2004 are more than twofold those for patients aged 45–49 in 1999.
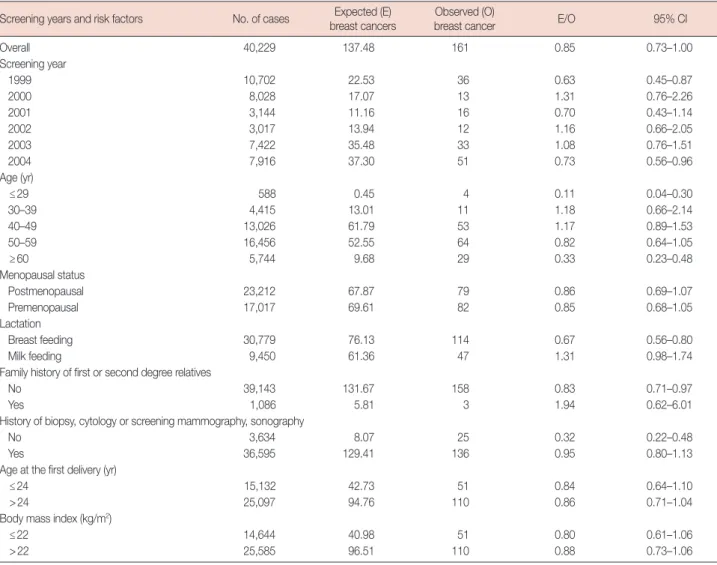
Validation of the updated Korean model
The expected versus observed counts calculated according to the risk factors and screening year using the updated Korean model are shown in Table 5. Overall, 137.48 patients with can- cer were expected and 161 were observed. The tendency to- wards underestimation remained in the updated Korean mod- el, but the performance was improved when compared with the modified Gail, Asian American Gail and original Korean models. The overall E/O ratio was 0.85 (95% CI, 0.73–1.00). In the screening years 1999 and 2004, the E/O ratio was 0.63 (95%
CI, 0.45–0.87) and 0.73 (95% CI, 0.56–0.96), respectively. The E/O ratio was 0.11 (95% CI, 0.04–0.30) in patients aged 29 years or less and 0.33 (95% CI, 0.23–0.48) in patients aged 60 Figure 2. Baseline hazards according to the years of the screening visit.
12
10
8
6
4
2
0
Age groups
Baseline hazards
10–14 15–19
20–24 25–29
30–34 35–39
40–44 45–49
50–54 55–59
60–64 65–69
70–74 75–79
80–84 85
– 2004 2003 2002 2001 2000 1999
Table 4. Expected and observed cancers for categories by screening years and risk factors using original Korean model Screening years and risk factors No. of cases Expected (E)
breast cancers
Observed (O)
breast cancer E/O 95% CI
Overall 40,229 80.90 161 0.50 0.43–0.59
Screening year
1999 10,702 22.01 36 0.61 0.44–0.85
2000 8,028 17.07 13 1.31 0.76–2.26
2001 3,144 6.70 16 0.42 0.26–0.68
2002 3,017 5.62 12 0.47 0.27–0.82
2003 7,422 14.32 33 0.43 0.31–0.61
2004 7,916 15.19 51 0.30 0.23–0.39
Age (yr)
≤29 588 0.28 4 0.07 0.03–0.19
30–39 4,415 8.68 11 0.79 0.44–1.43
40–49 13,026 38.92 53 0.73 0.56–0.96
50–59 16,456 27.92 64 0.44 0.34–0.56
≥60 5,744 5.09 29 0.18 0.12–0.25
Menopausal status
Postmenopausal 23,212 40.49 79 0.51 0.41–0.64
Premenopausal 17,017 40.41 82 0.49 0.40–0.61
Lactation
Breast feeding 30,779 45.13 114 0.40 0.33–0.48
Milk feeding 9,450 35.77 47 0.76 0.57–1.01
Family history of first or second degree relatives
No 39,143 77.51 158 0.49 0.42–0.57
Yes 1,086 3.39 3 1.13 0.36–3.50
History of biopsy, cytology or
screening mammography, sonography
No 3,634 3.45 25 0.14 0.09–0.20
Yes 36,595 77.44 136 0.57 0.48–0.67
Age at the first delivery (yr)
≤24 15,132 23.19 51 0.45 0.35–0.60
>24 25,097 57.71 110 0.52 0.44–0.63
Body mass index (kg/m2)
≤22 14,644 23.94 51 0.47 0.36–0.62
>22 25,585 56.96 110 0.52 0.43–0.62
CI=confidence interval.
years or more. There was a tendency to underestimate breast cancer risk in the breast-feeding (E/O ratio, 0.67; 95% CI, 0.56–
0.80), no family history (E/O ratio, 0.83; 95% CI, 0.71–0.97), and no history of biopsy, cytology, screening mammography or sonography (E/O ratio, 0.32; 95% CI, 0.22–0.48) groups.
We categorized the predicted 5-year risk into quintiles (Supplementary Table 7). In the 40-59 years age group, ex- pected and observed counts were not different, except for those with a risk of less than 0.127. In the more than 60 years age group, there was a tendency of underestimation for pa- tients with a risk less than 0.194, which was in the 40th per- centile of the predicted 5-year risk. A similar tendency was observed in the overall age group.
Validation of the discriminatory power of the four models The AUC after ROC analysis of the four models is summa- rized in Table 6. The AUC of the modified Gail model was
0.547 (95% CI, 0.500–0.594; p=0.039); the Asian-American Gail model AUC was 0.543 (95% CI, 0.495–0.590; p=0.061);
the original Korean model AUC was 0.509 (95% CI, 0.463–
0.556; p=0.690); and the updated Korean model AUC was 0.558 (95% CI, 0.511–0.605; p=0.011). The updated Korean model showed the best discriminatory power.
Table 5. Expected and observed cancers for categories by screening years and risk factors using updated Korean model Screening years and risk factors No. of cases Expected (E)
breast cancers
Observed (O)
breast cancer E/O 95% CI
Overall 40,229 137.48 161 0.85 0.73–1.00
Screening year
1999 10,702 22.53 36 0.63 0.45–0.87
2000 8,028 17.07 13 1.31 0.76–2.26
2001 3,144 11.16 16 0.70 0.43–1.14
2002 3,017 13.94 12 1.16 0.66–2.05
2003 7,422 35.48 33 1.08 0.76–1.51
2004 7,916 37.30 51 0.73 0.56–0.96
Age (yr)
≤29 588 0.45 4 0.11 0.04–0.30
30–39 4,415 13.01 11 1.18 0.66–2.14
40–49 13,026 61.79 53 1.17 0.89–1.53
50–59 16,456 52.55 64 0.82 0.64–1.05
≥60 5,744 9.68 29 0.33 0.23–0.48
Menopausal status
Postmenopausal 23,212 67.87 79 0.86 0.69–1.07
Premenopausal 17,017 69.61 82 0.85 0.68–1.05
Lactation
Breast feeding 30,779 76.13 114 0.67 0.56–0.80
Milk feeding 9,450 61.36 47 1.31 0.98–1.74
Family history of first or second degree relatives
No 39,143 131.67 158 0.83 0.71–0.97
Yes 1,086 5.81 3 1.94 0.62–6.01
History of biopsy, cytology or screening mammography, sonography
No 3,634 8.07 25 0.32 0.22–0.48
Yes 36,595 129.41 136 0.95 0.80–1.13
Age at the first delivery (yr)
≤24 15,132 42.73 51 0.84 0.64–1.10
>24 25,097 94.76 110 0.86 0.71–1.04
Body mass index (kg/m2)
≤22 14,644 40.98 51 0.80 0.61–1.06
>22 25,585 96.51 110 0.88 0.73–1.06
CI=confidence interval.
Table 6. Discriminatory accuracy of the modified Gail model, Asian American Gail model, previous Korean model and updated Korean model
Model AUC (95% CI) p-value
Modified Gail model 0.547 (0.500–0.594) 0.039 Asian-American Gail model 0.543 (0.495–0.590) 0.061
Korean model 0.509 (0.463–0.556) 0.690
Updated Korean model 0.558 (0.511–0.605) 0.011 CI=confidence interval; AUC=area under the curve.
DISCUSSION
In this study, we have validated the modified Gail model (model 2), Asian American Gail model, and Korean model using a dataset of Korean breast cancer screening patients.
Breast cancer occurrences were confirmed by matching the data with the Korean Breast Cancer Registration Program.
The modified Gail model showed a 146% overestimation and the Asian American Gail model showed a 29% overestimation of breast cancer risk in Korean women.
The Gail model has been validated in many studies, but there are few validation studies for Asians. The modified Gail model and Asian American Gail model have been validated for the 5-year risk of breast cancer in 28,104 Singaporean women [4].
In this study, the modified Gail model showed a 151% overes- timation and the Asian American Gail model showed a 43%
overestimation; these results are similar to those of our. The authors of the Singaporean validation study suggested that the reason for the Gail model overestimation might be a inci- dence of breast cancer and reduced mammographic screening in Singapore. Interestingly, they also showed the results of a 10-year risk of breast cancer validation study. In this study, the modified Gail model showed an 85% overestimation but the Asian American Gail model showed an underestimation of just 1%. They attributed this change to an increase in breast cancer incidence and mammographic screening.
Contrary to the Gail models, the Korean model showed a 50% underestimation of breast cancer risk. The Korean model was developed using risk factors from a Korean case-control study, and Korean incidence and mortality data. At the begin- ning of this study, we hypothesized that the Korean model would be capable of precisely estimating the risk of breast cancer for Korean women. However, the results indicate a se- vere underestimation. One of the reasons for this underesti- mation could be a recent increase in the incidence of breast cancer. The validation study population dataset was collected between 1999 and 2004, but the Korean model was developed using data from the years 1999 and 2001. In the year 1999, the incidence of breast cancer in Korean women was 24.3 per 100,000, and increased to 37.6 per 100,000 by the year 2004 [10]; a 55% increase in 5 years. To account for this, we updat- ed the Korean model with data of incidence and mortality for each individual year. The resulting updated Korean model showed a 15% underestimation of breast cancer risk, which was more accurate than the modified Gail, Asian American Gail and original Korean models.
In accordance with our findings, we believe that it is of the utmost importance to periodically update the incidence and mortality data in prediction models, particularly if there is a
rapid rate of change in a given population. However, we have been unable to find any studies detailing such updating in countries with rapidly changing incidence and mortality sta- tistics, such as Asia. In North America, which has a relatively stable incidence of breast cancer, updating the model data would also improve the performance, even if this updating was not periodic. A validation study of the Gail model has been performed using data from the National Institutes of Health-American Association of Retired Persons (NIH- AARP) from 1995 to 2003, and the Prostate, Lung, Colorectal and Ovarian Cancer Screening Trial (PLCO) from 1993 to 2006 [11]. Using SEER data from 1983 to 1987, the Gail mod- el showed a 13% underestimation in NIH-AARP patients and a 14% underestimation in PLCO patients. After updating the model with SEER data from 1995 to 2003, the updated Gail model showed well-calibrated results (a 3% overestimation in the NIH-AAPR data and a 1% overestimation in the PLCO data). This study illustrates the importance of updating inci- dence data, even in relatively stable populations.
Despite updating the incidence and mortality data, the up- dated Korean model showed a 15% underestimation of breast cancer risk, although this was not statistically significant.
There are a number of reasons that this underestimation might have occurred. Firstly, the validation data in this study was not a prospective cohort of the general population. We used data from breast cancer screening patients, most of whom were routinely screened. Routinely screened patients show a higher incidence rate than unscreened patients, which results in a comparatively high number of cases been observed and therefore an underestimating model. Conversely, a model developed using data from routinely screened patients will show a relatively high expected rate of incidence, and will therefore overestimate risk if applied to unscreened patients.
The original Gail model, which was developed using data from the annual mammographic screening BCDDP, showed a 33% overestimation in validation using data from the Nurse’s Health Study, which did not enforce regular screening [12].
A second possible reason for the updated Korean model un- derestimation is that in our study we confirmed the occur- rence of breast cancer by retrospective matching with the Ko- rean Breast Cancer Registration Program data, not by prospec- tive follow-up. Given that the Korean Breast Cancer Registra- tion Program does not include all the breast cancer cases in Korea, it is possible that the observed incidence of breast can- cer in our study is inaccurate. Although the National Cancer Registration Program in Korea has more accurate cancer inci- dence data, we were unable to access the data because of the Personal Information Protection Act, which was introduced in 2011. To overcome this limitation, a prospective study with
participant permission would need to be conducted.
The AUC of the modified Gail model was 0.547, the Asian American model AUC was 0.543, the Korean model AUC was 0.509, and the AUC of the updated Korean model was 0.558 (Table 6). The AUC has the same significance as the concordance statistic. The AUC of the modified Gail model using the data from the Nurses’ Health Study was 0.58 (95%
CI, 0.56–0.60) [13]. The AUC of the Asian American Gail model using the data from the Women’s Health Initiative was 0.614 (95% CI, 0.587–0.640) [8]. Compared with the concor- dance statistic of the modified Gail model and the Asian American Gail model, the updated Korean model has a com- parable discriminatory power. A prediction model with only clinical information cannot have strong discriminatory power.
For a greater discriminatory power, biochemical data, such as estrogen level, radiological data, such as mammographic den- sity, and molecular markers, such as single nucleotide poly- morphisms should be included.
Assessment of breast cancer risk is important for the screen- ing and prevention of disease. In high-risk patients, more fre- quent screening is required. In Western countries, mammo- graphic screening has produced a sharp reduction in breast cancer mortality in women aged over 50 [14]. However, the position is less clear for women aged 40 to 49. For women aged 40 to 49 with a risk of developing breast cancer greater than the baseline risk of a 50-year-old, it would be reasonable to conduct screening mammography. In Korean women, screening mam- mography is recommended for those aged over 40. However, Korean women show denser breast tissue on mammography than Western women [15], and so sonography is frequently used for screening. As such, a risk assessment model to guide sonographic screening in Korean women would be useful.
Tamoxifen and raloxifene have been approved for breast cancer prevention in the United States. It has been confirmed that 49% of breast cancer in women assessed as having a breast cancer risk greater than 1.66% by the Gail model could be prevented. However, tamoxifen and raloxifene are not commonly used for breast cancer prevention because of po- tentially fatal complications, such as endometrial cancer, deep vein thrombosis, and cerebral stroke. Gail et al. [16] have pro- posed a risk-benefit index to assess the risks and potential benefits of tamoxifen chemoprevention. Korean women have different risks and benefits, and so a Korean breast cancer risk assessment model would be crucial in order to develop a risk- benefit index for Koreans [17].
In conclusion, we have validated the modified Gail model, the Asian American Gail model, and the Korean model using data from screening patients matched to the Korean Breast Cancer Registration Program. The updated Korean model
shows a better performance than the other three previous models. It is hoped that this validation study can form the ba- sis of a clinical risk assessment program and a future prospec- tive study of breast cancer prevention.
CONFLICT OF INTEREST
The authors declare that they have no competing interests.
REFERENCES
1. Gail MH, Brinton LA, Byar DP, Corle DK, Green SB, Schairer C, et al.
Projecting individualized probabilities of developing breast cancer for white females who are being examined annually. J Natl Cancer Inst 1989;81:1879-86.
2. Fisher B, Costantino JP, Wickerham DL, Redmond CK, Kavanah M, Cronin WM, et al. Tamoxifen for prevention of breast cancer: report of the National Surgical Adjuvant Breast and Bowel Project P-1 Study. J Natl Cancer Inst 1998;90:1371-88.
3. Vogel VG, Costantino JP, Wickerham DL, Cronin WM, Cecchini RS, Atkins JN, et al. Effects of tamoxifen vs raloxifene on the risk of devel- oping invasive breast cancer and other disease outcomes: the NSABP Study of Tamoxifen and Raloxifene (STAR) P-2 trial. JAMA 2006;295:
2727-41.
4. Chay WY, Ong WS, Tan PH, Jie Leo NQ, Ho GH, Wong CS, et al. Vali- dation of the Gail model for predicting individual breast cancer risk in a prospective nationwide study of 28,104 Singapore women. Breast Can- cer Res 2012;14:R19.
5. Kim SH, Chae YS, Son WJ, Shin DJ, Kim YM, Chang MC. Estimation of individualized probabilities of developing breast cancer for Korean women. J Korean Surg Soc 2008;74:405-11.
6. Park SK, Yoo KY, Kang DH, Ahn SH, Noh DY, Choe KJ. The estimation of breast cancer disease-probability by difference of individual suscepti- bility. Cancer Res Treat 2003;35:35-51.
7. Ko BS, Noh WC, Kang SS, Park BW, Kang EY, Paik NS, et al. Changing patterns in the clinical characteristics of Korean breast cancer from 1996-2010 using an online nationwide breast cancer database. J Breast Cancer 2012;15:393-400.
8. Matsuno RK, Costantino JP, Ziegler RG, Anderson GL, Li H, Pee D, et al. Projecting individualized absolute invasive breast cancer risk in Asian and Pacific Islander American women. J Natl Cancer Inst 2011;
103:951-61.
9. Ziegler RG, Hoover RN, Pike MC, Hildesheim A, Nomura AM, West DW, et al. Migration patterns and breast cancer risk in Asian-American women. J Natl Cancer Inst 1993;85:1819-27.
10. Korean Statistical Information System. 2013. Korea National Statistical Office. http://www.kosis.kr/. Accessed November 1st, 2013.
11. Schonfeld SJ, Pee D, Greenlee RT, Hartge P, Lacey JV Jr, Park Y, et al. Ef- fect of changing breast cancer incidence rates on the calibration of the Gail model. J Clin Oncol 2010;28:2411-7.
12. Spiegelman D, Colditz GA, Hunter D, Hertzmark E. Validation of the Gail et al. model for predicting individual breast cancer risk. J Natl Can- cer Inst 1994;86:600-7.
13. Rockhill B, Spiegelman D, Byrne C, Hunter DJ, Colditz GA. Validation
of the Gail et al. model of breast cancer risk prediction and implications for chemoprevention. J Natl Cancer Inst 2001;93:358-66.
14. Kerlikowske K, Grady D, Rubin SM, Sandrock C, Ernster VL. Efficacy of screening mammography: a meta-analysis. JAMA 1995;273:149-54.
15. Kim SH, Kim MH, Oh KK. Analysis and comparison of breast density according to age on mammogram between Korean and Western wom- en. J Korean Radiol Soc 2000;42:1009-14.
16. Gail MH, Costantino JP, Bryant J, Croyle R, Freedman L, Helzlsouer K, et al. Weighing the risks and benefits of tamoxifen treatment for pre- venting breast cancer. J Natl Cancer Inst 1999;91:1829-46.
17. Kim DU, Min JW, Kim YM, Chang MC. Estimating the risks and bene- fits of tamoxifen for prophylactic breast cancer chemoprevention in Korea. J Breast Cancer 2012;15:51-6.