Journal of Bacteriology and Virology 2017. Vol. 47, No. 1 p.64 – 74 http://dx.doi.org/10.4167/jbv.2017.47.1.64
The Effect of Probiotics, Antibiotics, and Antipyretic Analgesics on Gut Microbiota Modification
Yeojun Yun1, Han-Na Kim1, Song E Kim1, Yoosoo Chang2, Seungho Ryu2, Hocheol Shin2, So-Youn Woo3* and Hyung-Lae Kim1*
1Department of Biochemistry, Ewha Medical Research Institute, School of Medicine, Ewha Womans University, Seoul;
2Center for Cohort Studies, Total Healthcare Center, Kangbuk Samsung Hospital, School of Medicine, Sungkyunkwan University, Seoul; 3Department of Microbiology, Ewha Medical Research Institute, School of Medicine, Ewha Womans
University, Seoul, Korea
Human gut microbial community is playing a critical role in human health and associated with different human disease.
In parallel, probiotics, antibiotics, and antipyretic analgesics (AAs) were developed to improve human health or cure human diseases. We therefore examined how probiotics, antibiotics, and AAs influence to the gut microbiota. Three independent case/control studies were designed from the cross-sectional cohort data of 1,463 healthy Koreans. The composition of the gut microbiota in each case and control group was determined via 16S ribosomal RNA Illumina next-generation sequencing. The correlation between microbial taxa and the consumption of each drug was tested using zero-inflated Gaussian mixture models, with covariate adjustment of age, sex, and body mass index (BMI). Probiotics, antibiotics, and AAs consumption yielded the significant differences in the gut microbiota, represented the lower abundance of Megasphaera in probiotics, the higher abundance of Fusobacteria in antibiotics, and the higher abundance of Butyrivibrio and Verrucomicrobia in AAs, compared to each control group. The reduction of Erysipelotrichaceae family was common in three drugs consumption.
Key Words: Gut microbiota, Probiotics, Antibiotics, Antipyretic analgesics
INTRODUCTION
Probiotics, antibiotics, and antipyretic analgesics (AAs) have widely used as prescribed in the clinic and the pharmacy for long time, since they were developed to improve human
health or cure human diseases. However, from the point of view that the human gut is the place for a mutualistic relationship between beneficial symbionts and commensals (1, 2), antibiotics are no longer considered only beneficial, but also potentially harmful drug, as their overuse has been linked to microbiota impairment and related disorder (3).
64
Original Article
Received: February 28, 2017/ Revised: March 14, 2017/ Accepted: March 22, 2017
*Corresponding author: So-Youn Woo. Department of Microbiology, Ewha Womans University, Seoul 07985, Korea.
Phone: +82-2-2650-5737, Fax: +82-2-2653-8891, e-mail: [email protected]
*Corresponding author: Hyung-Lae Kim. Department of Biochemistry, Ewha Womans University, Seoul 07985, Korea.
Phone: +82-2-2650-5727, Fax: +82-2-2650-5727, e-mail: [email protected]
**This research was supported by the National Research Foundation of Korea (NRF), with funding by ICT & Future Planning (NRF-2014R1A2A2A04006291) and the Ministry of Education (NRF-2016R1A6A3A11932719). Additional support was received from the Intramural Research Support Program of Ewha Womans University School of Medicine and the Korea Health Technology R&D Project through the Korea Health Industry Development Institute (KHIDI), with funding by the Ministry of Health & Welfare (HI14C0072).
○CCThis is an Open Access article distributed under the terms of the Creative Commons Attribution Non-Commercial License (http://creativecommons.org/license/by-nc/3.0/).
Conversely, the attention to probiotics has re-emerged be- cause of the potential for the prevention and treatment of a various disease as its definition is a living microorganisms which provides a benefit to the host (4). Both are well known to modify the gut microbiota of not only human beings but also agricultural animals (5). On the other hand, despite AAs, particularly non-steroidal anti-inflammatory drugs (NSAIDs), are the most widely used medication, the gastrointestinal effect of antipyretic analgesics remains surprisingly still underexplored (6).
Probiotics are live organisms ingested either through diet, e.g. yogurt or in the form of a probiotic supplement. Con- vincing clinical efficacy of probiotics applications has been documented for various conditions, including prevention of antibiotic-associated diarrhea, prevention of severe necro- tizing enterocolitis in preterm infants, symptom alleviation in irritable bowel syndrome, and reduction of respiratory tract infection incidence (7). Underlying mechanisms of action are still being investigated, suggested as producing antimicrobial factors and regulating epithelial barrier function and immunity (4).
Antibiotics overexposure leads to the impairment of gut microbiota, and the spread of antibiotic-resistance micro- organism (3). Broad-spectrum antibiotics reduce bacterial diversity while expanding and collapsing membership of specific indigenous taxa. Furthermore, antibiotic treatment selects for resistant bacteria, increases opportunities for hori- zontal gene transfer, and enables intrusion of pathogenic organisms through depletion of occupied natural niches, with profound implications for the emergence of resistance (8, 9). Antibiotics exposure impacts both innate and adaptive immunity, downregulation of antimicrobial peptides like defensins, C-type lectins, and cathelicidins and impact on pattern recognition receptors (PRRs) like Toll-like receptor (TLR)-2, TLR-4, and nucleotide binding oligomerization domain proteins (NOD)-2 (10).
AAs are a group of heterogeneous substances including acidic (NSAIDs) and nonacidic (paracetamol, pyrazolinones) drugs. Moreover, various selective cyclooxygenase-2 (COX- 2) inhibitors with improved gastrointestinal tolerability as compared with conventional NSAIDs have been established
for gastropathy and enteropathy treatment (11). Although NSAID-induced side effects have been recognized for some time, investigators more recently suggested that such effects may originate with dysbiosis, i.e. perturbations in the gut microbiome (12). Rogers et al. reported that the bacterial composition of the gut varied with the type of NSAIDs ingested, with ibuprofen and celecoxib users having similar microbiome profiles, and naproxen and ketorolac users having different profiles (6). Here we examined the correl- ation between the gut microbiota and the consumption of three common drugs-probiotics, antibiotics, and AAs in Korean population.
MATERIALS AND METHODS
Study subjects
The study used data from a total of 1,463 fecal samples from cohort study enrolled in the Kangbuk Samsung Health Study, which is a comprehensive annual or biennial exam- ination at Kangbuk Samsung Hospital Total Healthcare Screening Centers in Seoul, South Korea, between June and September 2014. This study was approved by the In- stitutional Review Board of Kangbuk Samsung Hospital (KBSMC 2013-01-245-008, registered 23 December 2013).
The datasets provided the age, sex, weight, and height for BMI (kg/m2) determination as well as the parameters of metabolic healthy status including fasting blood glucose, blood pressure, triglyceride level, high-density lipoprotein (HDL) cholesterol, and insulin resistance defined as homeo- stasis model assessment of insulin resistance (HOMA-IR = insulin (μU/ml)×glucose (mg/dl)/405). Case groups of this study were included by standardized, self-administrated que- stionnaires with a record of probiotics (n=14), antipyretic analgesics (AAs) medication (n=47) within 4 weeks, or antibiotics (n=55) within 6 weeks. The overlapped consump- tion of any cases was excluded. The ratio of 2 con trols for each case was achieved by picking a random sample matched with age and sex among the control pool of the 1,463 cohort samples. Each case/control study set was described in Table 1 (probiotics set), 2 (antibiotics set), and 3 (AAs set).
DNA extraction and sequence data generation Fecal samples were frozen soon after being collected.
16S rRNA genes were extracted and amplified from stool specimens using the MO-BIO PowerSoil DNA Isolation Kit (MO-BIO Laboratories, Carlsbad, CA, USA) according to the manufacturer's instructions. Amplification and sequencing were performed as described previously for analysis of bac- terial communities. The genomic DNA was amplified using fusion primers targeting 16S V3-V4 rRNA gene with in- dexing barcodes. All samples were pooled for sequencing on the Illumina Miseq platform (Illumina, San Diego, CA, USA) according to the manufacturer's specifications (13).
Sequence analysis
Quality filtering, chimera removal, and de novo oper- ational taxonomic unit (OTU) clustering were carried out using the UPARSE pipeline, which is a recently proven approach that identifies highly accurate OTU from amplicon sequencing data (14). The reads were dereplicated, sorted, and clustered into candidate OTU with removing chimeric OTU. Taxonomic assignment for OTU was annotated by the Ribosomal Database Project (RDP) reference (version 16) with an identity threshold 97% using UTAX command in UPARSE pipeline. OTU table with taxonomic assignments were transformed to 'biom' format for the compatibility of QIIME (version 1.9) software (15).
Alpha diversity was calculated using the Shannon Index by QIIME, which significant difference between case/
control was compared by creating boxplots with a two-sided Student's two-sample t-test (GraphPad Prism version 5.01, La Jolla, CA, USA). Beta diversity on Cumulative Sum Scaling (CSS) normalized OTU tables by QIIME was per- formed using the weighted UniFrac distance metrics based on the phylogenetic distance comparison between commu- nities showing Principal Coordinate Analysis (PCoA) plots and boxplots. A nonparametric p value for boxplots was calculated by 999 Monte Carlo permutation and Bonferroni multiple correction.
Statistical analysis
The zero-inflated Gaussian mixture (fitZIG) model of metagenomeSeq package version 1.14.2 (16) was used for correlation analysis between bacterial normalized count data (as dependent variables) and case/control (as independent categorical variables). Age and sex, and BMI covariates were adjusted for regression analysis. Bacterial count data were aggregated to 90 genera, 41 families, and 11 phylum levels. Each taxa level that were abundant (>50 normalized counts per sample) and prevalent (present in 10% of samples) in each analysis set were applied to the fitZIG model with Bonferroni multiple correction (an adjusted p value <0.05 is significant). This analysis was performed using R software package version 3.2.3.
RESULTS
Effects of probiotics
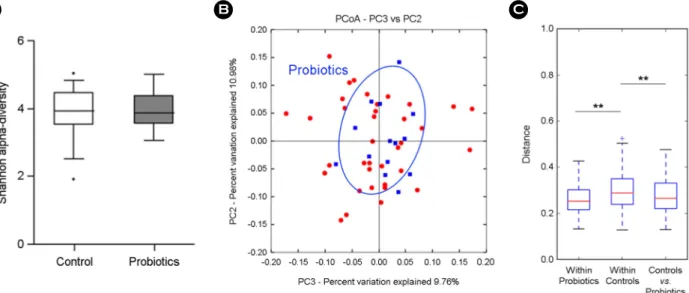
Table 1 shows descriptive statistics of 14 probiotics con- sumption and 28 control groups. Since its study design is the age and sex matched comparison, basically there were no significant difference in the level of BMI, glucose, trigly- cerides, HDL, blood pressure, and HOMA-IR. The gut microbial sequence data of total 42 subjects were analyzed to find out the differences in fecal microbial communities between probiotics and control groups based on taxonomic comparison. Alpha and beta diversity in OTU level were compared to check the significant difference of gut microbial community in case/control groups. There was no significant difference in the microbial diversity (Shannon index) of gut microbiota in probiotics and control groups (Fig. 1A). PCoA plot of weighted UniFrac (beta-diversity) showed probiotics group clustering (Fig. 1B), and in the distance matrix analysis,
"within" control group represented a significant distance with "between" two groups (p = 0.003) as well as "within"
case groups (p = 0.003, Fig. 1C). The taxonomic identity of the sequence reads was assigned by RDP reference using UPARSE pipeline. To obtain a featured change of microbial components, we performed a multivariated regression model, fitZIG, based on the normalized count data of an OTU table.
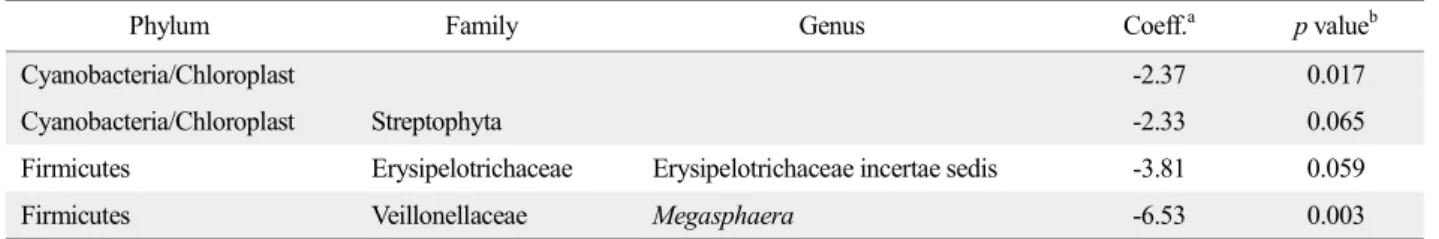
Table 4 shows differential bacterial taxa out of 8 phyla, 34 families, and 78 genera with adjustment for age, sex, and BMI. At the phylum level, Cyanobacteria/Chloroplast (Log2 Coeff. = -2.37, p = 0.017) and Streptophyta family (Log2 Coeff. = -2.37, p = 0.065) which belong to Cyanobacteria/
Chloroplast were consistently negative correlation with pro- biotics group. Within the phylum Firmicutes, Megasphaera (Log2 Coeff. = -6.53) under the family Veillonellaceae was
only significant different in probiotics group (p = 0.003), which displayed a lower abundance in probiotics group compared to the control group. Erysipelotrichceae incertae sedis (Log2 Coeff. = -3.81, p = 0.059) of Firmicutes were negatively correlated with probiotics consumption.
Effects of antibiotics
Fifty-five subjects had taken antibiotics in previous 6 Table 1. Characteristics of probiotics study population
Probiotics Control p value
Count (male) 14 (8) 28 (16)
Age (years) 45.93 ± 9.83 45.93 ± 9.65 1.000
BMI (kg/m2) 23.36 ± 2.75 22.30 ± 2.17 0.179
Glucose (mg/dl) 96.07 ± 11.34 94.96 ± 10.60 0.757
Triglycerides (mg/dl) 124.14 ± 84.00 106.93 ± 53.40 0.423
HDL cholesterol (mg/dl) 58.93 ± 19.44 60.29 ± 15.57 0.808
Systolic BP (mmHg) 105.87 ± 14.30 104.39 ± 11.11 0.717
Diastolic BP (mmHg) 68.86 ± 10.22 67.79 ± 9.08 0.731
HOMA-IR 1.73 ± 1.48 0.98 ± 0.54 0.089
Data are presented as mean ± standard deviation
Abbreviations: BMI, body mass index; HDL, high-density lipoprotein; BP, blood pressure; HOMA-IR, homeostasis model assessment- estimated insulin resistance.
Figure 1. Comparison of gut microbiota between 14 probiotics and 28 control groups. (A) Alpha-diversity (Shannon index), (B) beta-diversity of PCoA plots in probiotics group by weighted UniFrac, (C) weighted UniFrac distance box plot within and between groups (**p < 0.01).
months, and the twice size of control group with same age and sex were chosen randomly from the cohort samples (Table 2). The case of antibiotics group presented high HOMA-IR mean value of 1.45 ± 0.91 compared to 1.13
± 0.77 of the control group (p = 0.027). Since the fasting blood glucose level showed similar values, 94.55 ± 10.20 vs. 95.44 ± 19.90 in case and control respectively, the difference of HOMA-IR was caused by insulin level, 6.08
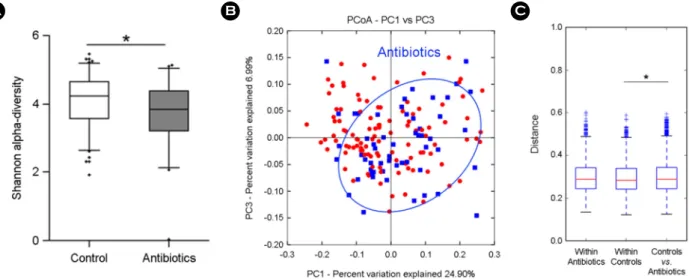
± 3.50 vs. 4.63 ± 2.78 respectively. Other parameters except HOMA-IR showed no significant difference between the case and the control. The gut microbial sequence data of total 165 subjects were analyzed to find out the differences in fecal microbial communities between antibiotics and control groups as probiotics study. Antibiotics consumption group had significant lower diverse gut microbiota than control group, as shown in Fig. 2A (Shannon Index, p <
Table 2. Characteristics of antibiotics study population
Antibiotics Control P value
Count (male) 55 (28) 110 (56)
Age (years) 46.58 ± 10.14 46.64 ± 9.98 0.974
BMI (kg/m2) 23.03 ± 3.22 22.67 ± 2.74 0.483
Glucose (mg/dl) 94.55 ± 10.20 95.44 ± 19.90 0.704
Triglycerides (mg/dl) 125.40 ± 105.50 104.10 ± 68.53 0.178
HDL cholesterol (mg/dl) 59.80 ± 18.36 58.73 ± 15.02 0.709
Systolic BP (mmHg) 108.22 ± 12.45 108.10 ± 14.24 0.956
Diastolic BP (mmHg) 70.64 ± 10.16 69.35 ± 9.60 0.438
HOMA-IR 1.45 ± 0.91 1.13 ± 0.77 0.027
Data are presented as mean ± standard deviation
Abbreviations: BMI, body mass index; HDL, high-density lipoprotein; BP, blood pressure; HOMA-IR, homeostasis model assessment- estimated insulin resistance.
Figure 2. Comparison of gut microbiota between 55 antibiotics and 110 control groups. (A) Alpha-diversity (Shannon index), (B) beta-diversity of PCoA plots in antibiotics group by weighted UniFrac, (C) weighted UniFrac distance box plot within and between groups (*p < 0.05).
0.05). Fig. 2B shows weighted UniFrac PCoA plot with clustering of antibiotics group, which distance between groups represented a significant difference with "within"
controls (Fig. 2C, p = 0.015). Only significant differential bacterial taxa (Bonferroni corrected p < 0.05) out of 8 phyla, 33 families, and 80 genera were resulted in Table 5. Euryar- chaeota in Archea showed a significant decrease in antibiotics group, consistently the lower hierarchy of Methanobac-
teriaceae family and Methanobrevibacter genus as well.
Fusobacteria phylum was only increased taxa, which had no significant family and genus under that phylum. Only Bacteroidetes, Butyricimonas and 10 genera in Fermicutes were all lower abundance in antibiotics group. Paenibacillus, Christensenella, and Enterococcus were consistently low in upper Family level which they belong to. Two genera in each family, Erysipelotrichaceae and Ruminococcaceae,
Table 3. Characteristics of antipyretic analgesics (AAs) study population
AAs Control P value
Count (male) 47 (23) 94 (46)
Age (years) 43.19 ± 8.89 43.18 ± 8.82 0.995
BMI (kg/m2) 23.64 ± 3.69 23.00 ± 2.64 0.295
Glucose (mg/dl) 98.36 ± 25.74 94.53 ± 17.66 0.362
Triglycerides (mg/dl) 117.57 ± 63.46 97.03 ± 44.93 0.051
HDL cholesterol (mg/dl) 56.47 ± 14.18 59.71 ± 14.00 0.202
Systolic blood pressure (mmHg) 108.94 ± 17.34 106.15 ± 11.00 0.318
Diastolic blood pressure (mmHg) 70.81 ± 13.25 68.90 ± 8.75 0.375
HOMA-IR 1.56 ± 1.16 1.19 ± 0.90 0.061
Data are presented as mean ± standard deviation
Abbreviations: BMI, body mass index; HDL, high-density lipoprotein; BP, blood pressure; HOMA-IR, homeostasis model assessment- estimated insulin resistance.
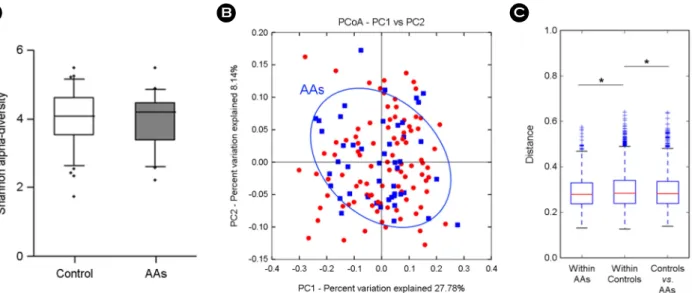
Figure 3. Comparison of gut microbiota between 47 AAs and 94 control groups. (A) Alpha-diversity (Shannon index), (B) beta-diversity of PCoA plots in AAs group by weighted UniFrac, (C) weighted UniFrac distance box plot within and between groups (*p < 0.05).
were negatively correlated with antibiotics consumption.
Megasphaera decreased in probiotics result (Log2 Coeff. = -6.28) was also decreased but with less effect (Log2 Coeff. = -2.50) in antibiotics group.
Effects of antipyretic analgesics (AAs)
Forty-seven case subjects using AAs and 94 age/sex matched control were included as shown in Table 3. All the metabolic health parameter was not significantly different between two groups. Biodiversity of gut microbiota was not Table 4. Significant taxa profiles of gut microbiota assessed by 16S metagenomics sequencing related with probiotics consumption
Phylum Family Genus Coeff.a p valueb
Cyanobacteria/Chloroplast -2.37 0.017
Cyanobacteria/Chloroplast Streptophyta -2.33 0.065
Firmicutes Erysipelotrichaceae Erysipelotrichaceae incertae sedis -3.81 0.059
Firmicutes Veillonellaceae Megasphaera -6.53 0.003
a Log2 ratio coefficient calculated by zero-inflated Gaussian mixture model using metageomeSeq package. Adjusted for age, sex, and BMI.
b Applied by Bonferroni multiple comparison correction
Table 5. Significant taxa profiles of gut microbiota assessed by 16S metagenomics sequencing related with antibiotics consumption
Phylum Family Genus Coeff.a p valueb
Euryarchaeota (Archaea) -2.97 6.04E-08
Euryarchaeota (Archaea) Methanobacteriaceae -3.65 1.51E-10
Euryarchaeota (Archaea) Methanobacteriaceae Methanobrevibacter -3.30 4.33E-09
Bacterodetes Porphyromonadaceae Butyricimonas -1.70 5.59E-04
Firmicutes Paenibacillaceae -2.85 8.06E-12
Firmicutes Paenibacillaceae Paenibacillus -2.85 1.11E-11
Firmicutes Christensenellaceae -1.83 8.78E-06
Firmicutes Christensenellaceae Christensenella -1.77 3.71E-05
Firmicutes Vallitalea -1.59 0.01
Firmicutes Enterococcaceae -1.56 0.003
Firmicutes Enterococcaceae Enterococcus -1.61 0.005
Firmicutes Acidaminococcaceae Acidaminococcus -1.75 0.025
Firmicutes Erysipelotrichaceae Erysipelotrichaceae incertae sedis -4.51 3.28E-17
Firmicutes Erysipelotrichaceae Erysipelothrix -4.07 1.17E-16
Firmicutes Lachnospiraceae Butyrivibrio -3.24 8.28E-08
Firmicutes Ruminococcaceae Fastidiosipila -1.55 1.97E-06
Firmicutes Ruminococcaceae Anaerotruncus -0.93 0.027
Firmicutes Veillonellaceae Megasphaera -2.50 9.54E-05
Fusobacteria 1.98 0.007
a Log2 ratio coefficient calculated by zero-inflated Gaussian mixture model using metageomeSeq package. Adjusted for age,sex, and BMI.
b Applied by Bonferroni multiple comparison correction
significant different neither (Fig. 3A). Although the clustering of AAs group showed no clear trend, the distance between groups represented a significant difference with "within"
controls (p = 0.039) and "within" AAs (p = 0.018) (Fig. 3B and 3C). Microbial difference in AAs group showed in Table 6, resulting out of 8 phyla, 34 families, and 80 genera.
Notably, the taxa with positive correlation were appeared more than the negatively correlated ones, which is contrary to the probiotics and the antibiotics cases. At the phylum level, AAs group contained a high abundance of Euryar- chaeota (Archea) (Log2 Coeff. = 3.10) and Verrucomicrobia (Log2 Coeff. = 1.57), but there were no significant family or genus under both phyla. The family Clostridiaceae (Log2 Coeff. = 1.77) and the genus Desulfovibrio (Log2 Coeff. = 2.57) displayed a high abundance in AAs group.
While both Butyricimonas (Bacteroidetes) and Butyri- vibrio (Firmicutes) genera displayed a decrease in antibiotics group (Table 4), AAs group contained a lower Butyricimonas (Log2 Coeff. = -2.41) and a higher Butyrivibrio (Log2 Coeff. = 4.84) than the control group.
DISCUSSION
We described herein the gut microbial changes by pro- biotics, antibiotics, and antipyretic analgesics consumption.
The alpha-diversity, the diversity of the gut microbial taxa within the individual, was significantly low in the antibiotics group, which is in concordance with previous reports (17,
18), while probiotics and antipyretic analgesics group had no differences with controls. And this actually confirms antibiotics consumption is the utmost impact of three cases onto the gut microecology, as the reduced species diversity has been associated with the predisposition to the metabolic syndrome, such as obesity and type II diabetes, as well as inflammatory bowel disease (IBD), such as Crohn's disease and ulcerative colitis (19). The beta-diversity, inter-individual taxa diversity, using UniFrac, an algorithm that measures similarity among microbial communities based on the phylo- genetic tree (20), showed that the specific bacterial com- ponents of all the three consumption groups were distinct from the control groups.
Probiotics consumption group contained approximately 70-times (Log2 Coeff. = -6.28) lower Megasphaera belongs to the family Veillonellaceae (Firmicutes), which is short- chain fatty acid (SCFA) producer (21). The SCFAs produced by microbes present in colon are mainly acetate, propionate, and butyrate (22). SCFA-producing bacteria can ferment in- digestible dietary fiber and hydrogentrophs utilize H2, an end product of bacterial fermentation (23). This could implicate the negative correlation of the hydrogen producer Cyano- bacteria in probiotics group, presumably along with hydro- gentrophs which was not appeared in the result (24). This suggests that probiotics may affect host energy balance by bacterial metabolism together with SCFA producer, hydrogen producer and hydrogentroph. Especially, Megasphaera was one of significant taxa which was increased in obese subjects Table 6. Significant taxa profiles of gut microbiota assessed by 16S metagenomics sequencing related with AAs consumption
Phylum Family Genus Coeff.a p valueb
Euryarchaeota (Archaea) 3.10 3.34E-05
Verrucomicrobia 1.57 0.015
Firmicutes Clostridiaceae 1.77 0.026
Bacterodetes Porphyromonadaceae Butyricimonas -2.41 2.54E-08
Firmicutes Lachnospiraceae Butyrivibrio 4.84 1.60E-06
Firmicutes Erysipelotrichaceae Erysipelotrichaceae incertae sedis -3.36 1.70E-06
Proteobacteria Desulfovibrionaceae Desulfovibrio 2.57 6.14E-06
a Log2 ratio coefficient calculated by zero-inflated Gaussian mixture model using metageomeSeq package. Adjusted for age, sex, and BMI.
b Applied by Bonferroni multiple comparison correction
from meta-analysis (25). Therefore, this gives the insight that probiotics play a role to protect the obesity, as a previous review suggested (26).
In the antibiotics group, Fusobacteria was almost 4-times (Log2 Coeff. = 1.98) increased, which is supposed to be a potential causative agent of colorectal cancer proven by many reports (27~30). In addition, Methanobrevibacter and Christensenella associated with the leanness (31, 32) were decreased in the antibiotics group, together with Entero- coccus, one of probiotic bacteria (33). These results are in agreement with the detrimental effect of antibiotics on the gut microbiota, with the implication to the gut dysbiosis leading to non-communicable disorder including obesity and IBD (3). However, Megasphaera, which was decreased in probiotics and is positively correlated with obesity (25), showed lower abundance in the antibiotics, which is contrary to the obesogenic property by antibiotics. Besides Megasp- haera, other SCFA producers like Butyricimonas (Bactero- idetes), Acidaminococcus, Butyrivibrio, and Anaerotruncus (Firmicutes) were all decreased in the antibiotics group.
Especially butyrate among SCFAs is a preferred energy source of colonocytes and has also been associated with suppressed growth of colonic tumors (34). Moreover, buty- rate contributes to the maintenance of gut immune homeo- stasis by promoting regulatory T cell (Treg) accumulation in the colon (35). Therefore, the reduction of butyrate-producing bacteria like Butyricimonas and Butyrivibrio could implicate the additional harmful effect of antibiotics.
Interestingly, the AAs group contained 5-times lower Butyricimonas (Log2 Coeff. = -2.41) but almost 30-times higher Butyrivibrio (Log2 Coeff. = 4.84) than the control group, suggesting butyrate production is still working and probably even increased. The high abundance of Verruco- microbia (including Akkermansia, a mucin-degrading bac- terium) augments the possibility of positive effect on the gut microbiota by AAs. Previously, Akkermansia was proposed to be a contributor to the maintenance of gut health and glucose homoeostasis, and it has been associated with a healthier metabolic status and better clinical outcomes after calorie restriction in obese adults (19, 36). Nevertheless, the prostaglandin blocking of NSAIDS might be of concern,
because recent studies reported that prostaglandin E2 (PGE2) acts on innate lymphoid cells which produce interleukin-22, a secreted protein that helps promote intestinal integrity and limits pathogenic bacteria (37, 38). Therefore, our result that the putative positive microbe Akkermansia was increased in AAs will be questionable, and maybe compensatory mechanism followed by AAs' prostaglandin blocking.
Finally, the common gut microbial feature of three cases across probiotics, antibiotics, and AAs groups was the reduc- tion of Erysipelotrichaceae, though it was not significant decrease in probiotics group. Reports documenting a poten- tial role for the bacterial family Erysipelotrichaceae are on the rise, appearing to be highly immunogenic and correlated with inflammation, obesity, and host cholesterol metabolites (39). The mechanism behind this phenomenon will need to be further studied.
Since our study is a cross-sectional, not experimental in design, it cannot be assured whether the gut microbial dif- ference is the consequence by the consumption of probiotics, antibiotics, and AAs. Another limitation of our study is that the self-administrated questionnaires don't include the infor- mation about the kinds or dosages of each drug. However, we can suggest that the bacterial composition can be altered significantly by probiotics, antibiotics, and AAs which are commonly used in adults. Additional investigation to define the functional role of the gut microbiota yielded by the con- sumption of three drugs will contribute to the public health.
REFERENCES
1) Round JL, Mazmanian SK. The gut microbiota shapes intestinal immune responses during health and disease.
Nat Rev Immunol 2009;9:313-23.
2) Clemente JC, Ursell LK, Parfrey LW, Knight R. The Impact of the Gut Microbiota on Human Health: An Integrative View. Cell 2012;148:1258-70.
3) Ianiro G, Tilg H, Gasbarrini A. Antibiotics as deep modulators of gut microbiota: between good and evil.
Gut 2016;65:1906-15.
4) Gareau MG, Sherman PM, Walker WA. Probiotics and the gut microbiota in intestinal health and disease. Nat Rev Gastroenterol Hepatol 2010;7:503-14.
5) Angelakis E, Merhej V, Raoult D. Related actions of probiotics and antibiotics on gut microbiota and weight modification. Lancet Infect Dis 2013;13:889-99.
6) Rogers MA, Aronoff DM. The influence of non-steroidal anti-inflammatory drugs on the gut microbiome. Clin Microbiol Infect 2016;22:178.e1-9.
7) van Baarlen P, Wells JM, Kleerebezem M. Regulation of intestinal homeostasis and immunity with probiotic lactobacilli. Trends Immunol 2013;34:208-15.
8) Modi SR, Collins JJ, Relman DA. Antibiotics and the gut microbiota. J Clin Invest 2014;124:4212-8.
9) Morgun A, Dzutsev A, Dong X, Greer RL, Sexton DJ, Ravel J, et al. Uncovering effects of antibiotics on the host and microbiota using transkingdom gene networks.
Gut 2015;64:1732-43.
10) Peterson CT, Sharma V, Elmén L, Peterson SN. Immune homeostasis, dysbiosis and therapeutic modulation of the gut microbiota. Clin Exp Immunol 2015;179:363-77.
11) Hinz B, Brune K. Antipyretic Analgesics: Nonsteroidal Antiinflammatory Drugs, Selective COX-2 Inhibitors, Paracetamol and Pyrazolinones. In: Analgesia Edited by C Stein. Berlin, Heidelberg: Springer Berlin Heidelberg;
2007. p.65-93.
12)Syer SD, Wallace JL. Environmental and NSAID- Enteropathy: Dysbiosis as a Common Factor. Curr Gastroenterol Rep 2014;16:377.
13)Fadrosh DW, Ma B, Gajer P, Sengamalay N, Ott S, Brotman RM, et al. An improved dual-indexing approach for multiplexed 16S rRNA gene sequencing on the Illumina MiSeq platform. Microbiome 2014;2:6.
14) Edgar RC. UPARSE: highly accurate OTU sequences from microbial amplicon reads. Nat Methods 2013;10:
996-8.
15)Navas-Molina JA, Peralta-Sánchez JM, González A, McMurdie PJ, Vázquez-Baeza Y, Xu Z, et al. Advancing our understanding of the human microbiome using QIIME. Methods Enzymol 2013;531:371-444.
16) Paulson JN, Stine OC, Bravo HC, Pop M. Differential abundance analysis for microbial marker-gene surveys.
Nat Methods 2013;10:1200-2.
17) Jernberg C, Löfmark S, Edlund C, Jansson JK. Long- term ecological impacts of antibiotic administration on the human intestinal microbiota. ISME J 2007;1:56-66.
18) Relman DA. The human microbiome: ecosystem resili-
ence and health. Nutr Rev 2012;70:S2-9.
19) Joyce SA, Gahan CG. The gut microbiota and the meta- bolic health of the host. Curr Opin Gastroenterol 2014;
30:120-7.
20) Lozupone C, Knight R. UniFrac: a New Phylogenetic Method for Comparing Microbial Communities. Appl Environ Microbiol 2005;71:8228-35.
21)Hansen TA. Acidaminobacter. In: Bergey's Manual of Systematics of Archaea and Bacteria: John Wiley &
Sons, Ltd; 2015.
22) Wong JM, de Souza R, Kendall CW, Emam A, Jenkins DJ. Colonic Health: Fermentation and Short Chain Fatty Acids. J Clin Gastroenterol 2006;40:235-43.
23)den Besten G, van Eunen K, Groen AK, Venema K, Reijngoud DJ, Bakker BM. The role of short-chain fatty acids in the interplay between diet, gut microbiota, and host energy metabolism. J Lipid Res 2013;54:2325-40.
24)Di Rienzi SC, Sharon I, Wrighton KC, Koren O, Hug LA, Thomas BC, et al. The human gut and ground- water harbor non-photosynthetic bacteria belonging to a new candidate phylum sibling to Cyanobacteria. Elife 2013;2:e01102.
25) Walters WA, Xu Z, Knight R. Meta-analyses of human gut microbes associated with obesity and IBD. FEBS Lett 2014;588:4223-33.
26)Boulangé CL, Neves AL, Chilloux J, Nicholson JK, Dumas ME. Impact of the gut microbiota on inflam- mation, obesity, and metabolic disease. Genome Med 2016;8:42.
27)Castellarin M, Warren RL, Freeman JD, Dreolini L, Krzywinski M, Strauss J, et al. Fusobacterium nucleatum infection is prevalent in human colorectal carcinoma.
Genome Res 2012;22:299-306.
28) Kostic AD, Gevers D, Pedamallu CS, Michaud M, Duke F, Earl AM, et al. Genomic analysis identifies association of Fusobacterium with colorectal carcinoma. Genome Res 2012;22:292-8.
29) McCoy AN, Araújo-Pérez F, Azcárate-Peril A, Yeh JJ, Sandler RS, Keku TO. Fusobacterium Is Associated with Colorectal Adenomas. PLoS ONE 2013;8:e53653.
30) Tahara T, Yamamoto E, Suzuki H, Maruyama R, Chung W, Garriga J, et al. Fusobacterium in colonic flora and molecular features of colorectal carcinoma. Cancer Res 2014;74:1311-8.
31)Million M, Maraninchi M, Henry M, Armougom F, Richet H, Carrieri P, et al. Obesity-associated gut micro- biota is enriched in Lactobacillus reuteri and depleted in Bifidobacterium animalis and Methanobrevibacter smithii. Int J Obes 2012;36:817-25.
32) Goodrich JK, Waters JL, Poole AC, Sutter JL, Koren O, Blekhman R, et al. Human Genetics Shape the Gut Microbiome. Cell 2014;159:789-99.
33) Allen SJ, Martinez EG, Gregorio GV, Dans LF. Cochrane Database of Systematic Reviews-Probiotics for treating acute infectious diarrhoea: John Wiley & Sons, Ltd;
2010.
34) Koropatkin NM, Cameron EA, Martens EC. How glycan metabolism shapes the human gut microbiota. Nat Rev Microbiol 2012;10:323-35.
35) Lee WJ, Hase K. Gut microbiota-generated metabolites in animal health and disease. Nat Chem Biol 2014;10:
416-24.
36)Dao MC, Everard A, Aron-Wisnewsky J, Sokolovska N, Prifti E, Verger EO, et al. Akkermansia muciniphila and improved metabolic health during a dietary inter- vention in obesity: relationship with gut microbiome richness and ecology. Gut 2016;65:426-36.
37) Duffin R, O'Connor RA, Crittenden S, Forster T, Yu C, Zheng X, et al. Prostaglandin E2 constrains systemic inflammation through an innate lymphoid cell-IL-22 axis. Science 2016;351:1333-8.
38)Sakamoto K, Kim YG, Hara H, Kamada N, Caballero- Flores G, Tolosano E, et al. IL-22 controls iron-dependent nutritional immunity against systemic bacterial infections.
Sci Immunol 2017;2.
39)Kaakoush NO. Insights into the role of Erysipelotri- chaceae in the human host. Front Cell Infect Microbiol 2015;5:84.