Copyright Ⓒ 2012 by Korean Society of Spine Surgery
This is an Open Access article distributed under the terms of the Creative Commons Attribution Non-Commercial License (http://creativecommons.org/licenses/by-nc/3.0/) which permits unrestricted non-commercial use, distribution, and reproduction in any medium, provided the original work is properly cited.
Asian Spine Journal • pISSN 1976-1902 eISSN 1976-7846
Received Jan 19, 2012; Revised Mar 22, 2012; Accepted Mar 29, 2012 Corresponding author: Byung Wan Choi, MD
Department of Orthopedic Surgery, Inje University Haeundae Paik Hospital, Inje University College of Medicine, 875 Haeun-daero, Haeundae-gu, Busan 612-862, Korea
Tel: +82-51-797-0240, Fax: +82-51-797-0249, E-male: [email protected]
Effect of the Number of Involved Spinal Cord Segments on Gait Function in Patients with Cervical Spondylotic Myelopathy
Ji Yeon Yoon1, Han Chang2, Kun Bo Park2, Sang Jin Lee2, Byung Wan Choi2
1Motion Analysis Laboratory, Inje University Haeundae Paik Hospital, Inje University College of Medicine, Busan, Korea
2Department of Orthopedic Surgery, Inje University Haeundae Paik Hospital, Inje University College of Medicine, Busan, Korea
Study Design: Retrospective.
Purpose: To determine the effect of severity of cervical spondylotic myelopathy (CSM) on gait parameters according to the number of involved spinal cord segments.
Overview of Literature: Althoug h there are a large number of studies on CSM, almost all studies have focused on hand function and only a few studies have examined the gait function in patients with CSM.
Methods: Twenty-three patients with CSM underwent magnetic resonance imaging and gait analysis. The subjects were di- vided into 2 groups; group I consisted of 9 patients with a single-level stenotic lesion and group II comprised 14 patients with multi-level stenotic lesions. Gait parameters were compared between the 2 groups and the normal control group.
Results: There was no significant difference in the Japanese Orthopaedic Association score between the 2 groups. Cadence, walking speed, stride length, and step length were decreased in group II compared to group I and normal control group.
Peak ankle plantar flexion moments during the stance phase and peak knee flexion angle during the swing phase were decreased in group II. Peak ankle, knee, and hip power generation during the stance phase were decreased in group II; in addition, the peak ankle power generation was decreased in group II than in the normal control group.
Conclusions: Patients with multi-level stenotic lesions had decreased gait ability compared to that in patients with a single- level stenotic lesion. The number of involved spinal cord segments can be one cause of gait deterioration in patients with CSM. Performing a gait analysis is useful for accurate evaluation of the patient.
Key Words: Cervical spondylotic myelopathy, Gait analysis, Multi-level
Introduction
Cervical spondylotic myelopathy (CSM) is the most com- mon cause of cervical spinal cord dysfunction in middle aged and older patients [1,2]. The primary mechanism of CSM is compression of nervous tissue and factors that can lead to spinal and intervertebral foramen narrowing, includ- ing disk degeneration, bulging, spondylosis, and Ossifica- tion of posterior longitudinal ligament [3-5]. In patients with
CSM, magnetic resonance imaging (MRI) is the most use- ful diagnostic test to detect the causes of spinal compression and to confirm the changes in intervertebral disc and soft tissue [1,6].
The representative clinical signs and symptoms of CSM are numbness and loss of dexterity in the upper limb and gait disturbance due to weakness or sensory loss in the lower limbs. The most common level of cervical spinal cord abnormality in patients of all ages is C5-6, C6-7, and C4-5
in descending order [2]. The sensation in the dermatome and muscle group controlled at this spinal cord level can be affected, as well. Gait disturbance is another bothersome symptom in patients with CSM. The gait abnormality due to involvement of the long tract in the spinal cord, often pres- ents as a broad-based, hesitant, and shuffling gait [7]. Al- though there are a lot of studies about CSM, almost all stud- ies have focused on hand function and only a few studies examined the gait function in patients with CSM. In the pre- vious studies related to gait analysis in CSM, the differences between the preoperative and postoperative gait parameters were usually compared and the changes were described [8- 10]. The recovery from gait dysfunction is a major issue in clinical treatment, and many studies have tried to determine the improvement in the gait after operation; however, the cause of gait dysfunction in CSM is not clear. Recently, it has been suggested that a more intense increase in signal intensity on T2-weighted MRI could indicate the presence of gait abnormality [11]. However, there was no study in which the effect of the number of involved spinal cord seg- ments on the gait characteristics was examined in patients with CSM.
The purpose of this study was to investigate the relation- ship between the severity of CSM and gait disturbance in terms of gait analysis in patients with CSM and to deter- mine the effect of the number of stenotic lesions on gait parameters.
Materials and Methods
The present study was a retrospective review, which was approved by the institutional review board of our hospital.
Inclusion criteria were the following: 1) patients who di- agnosed as having CSM on the basis of the clinical findings and imaging methods, 2) degree of stenosis was over than grade 2 as proposed in the study by Muhle et al. [12], and 3) patients who had undergone surgical treatment. Exclusion criteria were the following: 1) patients who could not walk independently without an assistive device, 2) patients who had other combined pathology at another level of the spinal cord or extremities previously were excluded, as well. A to- tal of 23 patients were included. The MRI studies were used to confirm the numbers of involved spinal cord segments were analyzed. Spinal stenosis was classified for each seg- ment according to the following grading system: 0, normal;
1, partial obliteration of the anterior or posterior subarach- noid space; 2, complete obliteration of the anterior or poste-
rior subarachnoid space; and 3, cervical cord compression or displacement [12]. The subjects were classified into 2 groups: group I consisted of 9 patients with a single-level stenotic lesion, and group II consisted of 14 patients with multi-level stenotic lesions. There were 10 cases of level 2 involved patients and 4 cases of level 3 involved patients.
The number of cases showing high signal intensity on T2- weighted MRI was evaluated as well.
The Japanese Orthopaedic Association (JOA) score was used to assess the motor function in the upper and lower limbs, as well as sensation and bladder function (Table 1), and the assessment was performed by an orthopaedic spine surgeon before the surgical treatment.
Gait was compared between groups and the temporo- spatial, kinetic, and kinematic parameters were analyzed using 3-dimensional Motion Analysis System (Oxford Met- rics Inc., Oxford, UK) which consisted of 8 VICON MX- T20 infra-red cameras and 2 force-plates (AMTI, Water- town, MA, USA). The signals from the force plates placed on the center of the walking area were synchronized with the kinematic data using a Nexus ver. 1.5.2 (Vicon Motion Systems Ltd., Oxford, UK). A total of 16 reflective markers were used for this study and the markers were placed over each subject’s bilateral anterior and posterior superior iliac spines, lateral thigh, femoral epicondyle, tibia, malleolus, second metatarsal head, and posterior calcaneus. The mark- er placement was performed using the Plug-in Gait model (Vicon Motion System) and carried out by an experienced operator. The capture volume of the cameras was calibrated prior to each assessment to achieve calibration residuals less than 2.5 mm. Anthropometric data were collected according to a standard protocol. Participants were instructed to walk at self-selected comfortable speeds along an 8 m walkway.
After a warm-up trial to familiarize the participant with the protocol, walking trials were continued until 10 trials with good quality data of participants striking the force plate clearly had been achieved. The gait cycle events (heel strike and toe off) were identified automatically from the force plate data during walking. The kinematic and kinetic data were calculated in 3 planes and the data for the trials were filtered by using the Woltring filter.
The JOA score, gait parameters during stance, and swing phase were compared. For the comparison of the JOA score between 2 groups, total scores and motor dysfunction of the lower extremity scores were compared respectively. Gait parameters were compared between the 2 groups and the normal control group.
An SAS ver. 4.2 (SAS Institute, Cary, NC, USA) was used for statistical analysis. The significance of difference in the JOA score between the 2 patient groups with CSM was tested using the Mann-Whitney test. Temporo-spatial and kinematic parameters between the 2 patient groups and the normal control group that was selected from our normative database of 15 age-matched healthy volunteers were tested by the one-way analysis of variance. Multiple comparisons were done using the Bonferroni’s procedure; statistical sig-
nificance was defined as p < 0.05.
Results
In group I, the average age was 58.3 ± 10.8 years (range, 42 to 76 years) and the average duration of symptoms was 7.1 ± 11.0 months (range, 0.3 to 36 months). In group II, the average age was 58.1 ± 9.0 years (range, 43 to 73 years) and the average duration of symptoms was 17.1 ± 22.8 months Table 1. An assessment scale for disability due to cervical myelopathy (JOA score)
Category Score (point)
I. Motor dysfunction of the upper extremity 0
Unable to feed oneself 1
Unable to handle chopsticks, able to eat with a spoon 2
Able to handle chopsticks with much difficulty 3
Able to handle chopsticks with slight difficulty 4
None
II. Motor dysfunction of the lower extremity
Unable to walk 0
Can walk on flat floor with walking aid 1
Can walk up and/or down stairs with handrail 2
Lack of stability and smooth gait 3
None 4
III. Sensory deficit Upper extremity
Severe sensory loss or pain 0
Mild sensory loss 1
None 2
Lower extremity
Severe sensory loss or pain 0
Mild sensory loss 1
None 2
Trunk
Severe sensory loss or pain 0
Mild sensory loss 1
None 2
IV. Sphincter dysfunction
Unable to void 0
Marked difficulty in micturition (retention) 1
Difficulty in micturition (frequency, hesitation) 2
None 3
The JOA score in a healthy subject is the total of the best scores: (I+II+III+IV) = 17 points.
JOA: Japanese Orthopaedic Association.
(range, 0.3 to 60 months). There was no significant differ- ence in the age and duration of symptoms between group I and group II. The mean degree of spinal stenosis was 2.61 grade in group I and 2.54 grade in group II and no signifi- cant was found (p = 0.79). There was no significant differ- ence in the JOA score between group I (13.9 ± 1.3; range, 12 to 15) and group II (13.0 ± 2.1; range, 10 to 16; p = 0.33).
JOA scores of motor dysfunction of the lower extremity between the 2 groups showed no statistically significant dif- ference (group I, 2.3 ± 0.7 and group II, 2.8 ± 1.1; p = 0.09).
There was no statistically significant difference in the ratio of presentation of increased signal intensity on T2-weighted MRI between group I (55.6%) and group II (57.1%) (p = 0.92) (Table 2).
There were statistically significant difference in the ca- dence (p = 0.003), walking speed (p < 0.001), step length (p < 0.001), and stride length (p = 0.012); these were lower
in group II than in group I and in the normal control group.
In addition, the step length in group I was lower than that in the normal control group. There was a significant difference in the step time (p = 0.007) and stride time (p = 0.006) and these were higher in group II than in group I and the normal control group (Table 3).
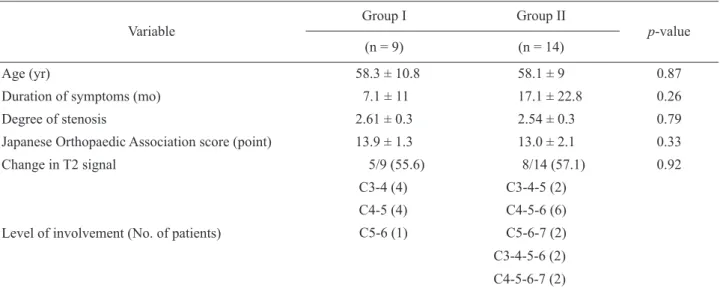
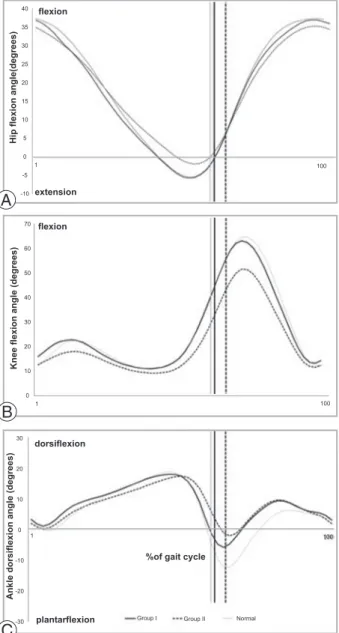
The range of motion of knee and ankle joint was de- creased in group II than in group I and normal control group (Fig. 1). Ankle plantarflexion moment was decreased in group II than in group I and normal control group, but the knee extension moment and hip extension moment were similar between groups (Fig. 2). There was a statistically significant difference in the peak knee flexion angle during the swing phase (p < 0.001) and peak ankle plantarflexion moments during the stance phase (p = 0.002) and these were decreased in group II compared to group I and normal control group. There was a significant difference in the peak Table 2. Subjects’ characteristics
Variable Group I Group II
p-value
(n = 9) (n = 14)
Age (yr) 58.3 ± 10.8 58.1 ± 9 0.87
Duration of symptoms (mo) 7.1 ± 11 17.1 ± 22.8 0.26
Degree of stenosis 2.61 ± 0.3 2.54 ± 0.3 0.79
Japanese Orthopaedic Association score (point) 13.9 ± 1.3 13.0 ± 2.1 0.33
Change in T2 signal 5/9 (55.6) 8/14 (57.1) 0.92
Level of involvement (No. of patients)
C3-4 (4) C3-4-5 (2) C4-5 (4) C4-5-6 (6) C5-6 (1) C5-6-7 (2)
C3-4-5-6 (2) C4-5-6-7 (2) Values are presented as mean ± standard deviation or number (%).
Table 3. Comparison of temporo-spatial parameters between groups
Gait parameter Group I Group IIa,b) Normal p-value
Cadence (step/min) 112.99 ± 12.36 99.56 ± 19.30 111.88 ± 4.17 0.003
Stride time (sec) 1.08 ± 0.14 1.27 ± 0.33 1.07 ± 0.04 0.006
Step time (sec) 0.54 ± 0.07 0.63 ± 0.16 0.54 ± 0.03 0.007
Stride length (m) 1.13 ± 0.11 0.98 ± 0.22 1.26 ± 0.08 0.012
Step length (m) 0.56 ± 0.06a) 0.5 ± 0.11 0.63 ± 0.04 <0.001
Walking speed (m/sec) 1.07 ± 0.17 0.84 ± 0.29 1.17 ± 0.11 <0.001
Values are presented as mean ± standard deviation.
a)p < 0.05 compared with the normal control group, b)p < 0.05 compared with group I.
knee and hip power generation during the stance phase (p
= 0.028, p < 0.001, respectively); these were decreased in group II compared to group I. The peak ankle power gen- eration was decreased in group II compared to group I, as well as the normal control group (p < 0.001). There was no significant difference in the peak ankle power generation between group I and the normal control group (Table 4).
Discussion
Gait disturbance is one of cardinal symptoms in patients with CSM, which develops soon after weakness or clumsi- ness of the upper extremities [13]. The symptoms of a “my-
elopathic gait” include loss of balance, stiffness, unsteadi- ness, and loss of power in the legs, and it is a broad-based and shuffling gait with disruption in smooth, rhythmic func- tion [14]. Previous studies reported regarding the decreased walking speed and step length, but there was a difference in the kinetic and kinematic parameters [8,11,15,16]. Maezawa et al. [16] reported knee hyperextension, whereas Kuhtz- Buschbeck et al. [8] reported reduced ankle joint extension and no difference in knee and hip extension. These stud- ies include patients with CSM and gait disorder, but they did not classify the patient according to the severity of the disease. Suzuki et al. [15] reported loss of knee flexion dur- ing the early stance phase in patients with CSM for >1 year
extension flexion flexion
dorsiflexion
plantarflexion
%of gait cycle
40 35 30 25 20 15 10 5 0 -5 -10
70 60 50 40 30 20 10 0
30
20
10
0
-10
-20
-30
1 100
1 100
1 100
Group I Group II Normal
Fig. 1. Comparison of hip (A), knee (B), ankle (C) sagit- tal angle between groups. The black dashed line (group II) showed decreased knee flexion during the swing phase.
A
B
C
flexion
flexion extention extension
dorsiflexion plantarflexion
%of gait cycle
1.5
1
0.5
0
-0.5
-1
-1.5
1 100
1 100
1 100
Group I Group II Normal
2
1.5
1
0.5
0
-0.5
-1 1
0.5
0
-0.5
-1
Fig. 2. Comparison of hip (A), knee (B), ankle (C) sagittal plane moment between groups. The black dashed line (group II) showed a decreased ankle plantar flexion moment during the stance phase.
A
B
C
and Kim et al. [11] reported a limited range of motion of knee and ankle in patients with CSM with increased signal intensity on T2-weighted MRI. In this study, we tried to de- termine the abnormal gait pattern in multi-level and single- level CSM.
The JOA score is a commonly used clinical assessment to classify the severity of CSM. In our study, there was no difference in the JOA score between group I and group II and a similar finding was reported in a previous study [11].
We selected the patients who could walk independently without any assistive device to perform gait analysis. This means that the functional assessment by the JOA score did not correlate with the quality of the gait pattern in ambula- tory patients with CSM. To investigate the quality of gait in this group, we should apply a different evaluation method, such as gait analysis. Gait analysis by 3-dimensional motion capture system has been used for precise and quantitative assessment of abnormal gait in the field of orthopaedic sur- gery [15]. McDermott et al. [17] reported that 3-dimensional gait analysis is a useful method that has excellent reliability when evaluating the gait changes in patients with CSM. In this study, patients with multi-level stenotic lesions (group II) showed decreased step length, cadence and walking speed, and a longer step time compared to the normal con- trol group. This was in line with the results of previous stud- ies in which walking speed and step length were decreased, and double support time and step width were increased [8,11,15,16]. However, in group I, only the step length was
decreased compared to normal control group. Between the groups, the clinical severity of CSM appeared to be similar in terms of the JOA score, but the quality of gait was differ- ent.
Patients with multi-level stenotic lesions (group II) ex- hibited decreased peak knee flexion angle during the swing phase compared to that in patients with single-level stenotic lesion (group I) and normal control group. These results corresponded with those in the studies by Kim et al. [11]
and Maezawa et al. [16]. Maezawa et al. [16] reported that patients with a JOA score of more than 10 points showed only decreased knee flexion during the swing phase. In our study, patients in group I and group II had a JOA score of more than 10 points, but only patients in group II show de- creased knee flexion during the swing phase. Kim et al. [11]
suggested that gait dysfunction in CSM might be associated with increased upper motor neuron signs and increased sig- nal intensity on T2-weighted MRI and reduced knee flexion due to knee joint spasticity in patients with spinal cord or brain injuries was reported as well [15,18]. Although they used the modified JOA score, the average modified JOA score in their study was more than 16 points. In the 2 groups of our study, the ratio of presentation of change in the signal on T2-weighted MRI was similar. In group I, 55.6% of pa- tients had increased signal intensity on T2-weighted MRI, but there was no significant difference in peak knee flexion during the swing phase compared to the normal control group and the temporo-spatial parameters were similar to Table 4. Comparison of kinetic and kinematic parameters between groups
Gait parameters Group I Group II Normal p-value
Peak ankle plantarflexion moment (Nm/kg) 1.32 ± 0.13 1.17 ± 0.28a,b) 1.38 ± 0.10 0.002
Peak knee extension moment (Nm/kg) 0.58 ± 0.21 0.45 ± 0.26 0.60 ± 0.22 0.062
Peak hip extension moment (Nm/kg) 0.83 ± 0.35 0.65 ± 0.29 0.66 ± 0.18 0.090
Peak ankle power generation (W/kg) 3.24 ± 0.89 2.29 ± 1.43a,b) 3.75 ± 0.54 <0.001 Peak knee power generation (W/kg) 0.73 ± 0.36 0.49 ± 0.33b) 0.67 ± 0.27 0.028 Peak hip power generation (W/kg) 1.46 ± 0.52 0.95 ± 0.47b) 1.90 ± 0.25 <0.001 Peak ankle dorsiflexion angle during the stance phase (º) 18.47 ± 4.25 18.61 ± 5.21 18.78 ± 2.92 0.977 Peak ankle plantarflexion angle at the terminal stance phase (º) 4.24 ± 5.71 3.75 ± 7.37 8.30 ± 6.23 0.055 Peak knee flexion angle during the swing phase (º) 63.86 ± 6 .41 53.62 ± 13.40a,b) 64.66 ± 6.03 <0.001 Peak knee extension angle during the stance phase (º) 12.6 ± 4.17 10.91 ± 6.76 11.71 ± 4.68 0.602 Peak hip flexion angle during the stance phase (º) 36.61 ± 8.54 34.76 ± 5.92 37.22 ± 7.17 0.458 Values are presented as mean ± standard deviation.
a)p < 0.05 compared with the normal control group, b) p < 0.05 compared with group I.
those in the normal control group. In CSM patients with a relatively high JOA score, we suggest that not only the increased signal intensity, but also the number of stenotic le- sions could be the cause of gait dysfunction.
Peak knee and hip power generation during the stance phase were decreased in group II compared to group I, and the peak ankle power generation and peak ankle plan- tarflexion moment during the stance phase were decreased in group II compared to group I, as well as normal control group. In association with changes in the linear parameters such as decreased walking speed, patients with multi-level stenotic lesions showed reduced peak knee flexion angle during the swing phase as well as a reduced peak ankle power and peak ankle plantarflexion moment. These find- ings could be interpreted to reflect the decreased power while walking forward [19]. Although there was no statisti- cally significant difference in ankle plantarflexion angle in our study, decreased ankle plantarflexion angle in the graph was reported, which could have resulted from decreased ankle power generation and plantarflexion moment [16].
Gait dysfunction may be present in patients with neurologi- cal deficit because of lower limb stiffness and muscle weak- ness [10,16], and according to our results the decreased power generation and plantarflexion moment by the ankle plantarflexor muscle is the predominant cause of gait dys- function.
The knee hyperextension gait was also reported in pa- tients with CSM for >1 year [15] or who had a JOA score of less than 6 points [16]. In our study, although the aver- age duration of symptoms in group II (17.1 ± 22.8 months;
range, 0.3 to 60 months) was more than 1 year, there was no statistically significant difference in duration of symptoms between group I and group II and the average JOA score was more than 10 points in both groups, as well. Although there was no statistically significant difference between groups, the average knee sagittal angle during gait had a relatively increased knee extension in group II than in group I and normal control group. So, it could be postulated that if the patients in group II had a longer duration of symptoms or a lesser JOA score, then the upper motor neuron signs such as increased gastrocnemius muscle tone [16] would be more prominent and hyperextension of the knee could oc- cur.
There are several limitations to this study. We selected only those subjects who could walk at least 20 m indepen- dently to perform gait analysis. So, patients with severe gait dysfunction or who could only walk with assistive devices
were not evaluated in our study. Although the stenotic le- sions on MRI were evaluated [12], it was a relatively sub- jective method and we do not know about the relationship between stenotic lesion and upper motor neuron signs. We classified the patients according to the number of stenotic lesions, thus we could not consider the severity of stenotic lesion. The signs and symptoms of CSM depend on the level of spinal cord involvement and CSM is often a multi- level process [20]. To evaluate the relationship between the severity of stenotic lesion and gait dysfunction, a further study classifying the patients according to the severity of stenotic lesion should be performed. Although our study has several limitations, this is the first study considering the effect of the number of involved spinal cord segments on gait dysfunction in patients with CSM. We found that even though there was no difference in the JOA score between groups, CSM patients with multi-level stenotic lesions had a higher degree of gait dysfunction compared to that in CSM patients with a single-level stenotic lesion. The number of involved spinal cord segments may be one of the associated factors related to gait deterioration in CSM. For the exact evaluation of the lower extremity function in myelopathic patients, gait analysis is recommended.
Conclusions
Patients with multi-level stenotic lesions had decreased gait ability compared to that in patients with a single- level stenotic lesion. The number of involved spinal cord segments can be one of the causes of gait deterioration in patients with CSM. JOA score has some limitation in the evaluation of gait ability in the CSM patient. For the exact evaluation of the lower extremity function in myelopathic patients, gait analysis is recommended.
REFERENCES
1. Emery SE. Cervical spondylotic myelopathy: diagnosis and treatment. J Am Acad Orthop Surg 2001;9:376-88.
2. Montgomery DM, Brower RS. Cervical spondylotic myelopathy. Clinical syndrome and natural history. Or- thop Clin North Am 1992;23:487-93.
3. Bohlman HH, Emery SE. The pathophysiology of cervical spondylosis and myelopathy. Spine (Phila Pa 1976) 1988;13:843-6.
4. Lestini WF, Wiesel SW. The pathogenesis of cervical spondylosis. Clin Orthop Relat Res 1989;(239):69-93.
5. Nurick S. The pathogenesis of the spinal cord disorder associated with cervical spondylosis. Brain 1972;95:87- 100.
6. Edwards CC 2nd, Riew KD, Anderson PA, Hilibrand AS, Vaccaro AF. Cervical myelopathy. current diagnos- tic and treatment strategies. Spine J 2003;3:68-81.
7. Lee J, Koyanagi I, Hida K, Seki T, Iwasaki Y, Mitsumo- ri K. Spinal cord edema: unusual magnetic resonance imaging findings in cervical spondylosis. J Neurosurg 2003;99:8-13.
8. Kuhtz-Buschbeck JP, Jöhnk K, Mäder S, Stolze H, Me- hdorn M. Analysis of gait in cervical myelopathy. Gait Posture 1999;9:184-9.
9. Sairyo K, Katoh S, Sakai T, Mishiro T, Ikata T. Char- acteristics of velocity-controlled knee movement in patients with cervical compression myelopathy: what is the optimal rehabilitation exercise for spastic gait?
Spine (Phila Pa 1976) 2001;26:E535-8.
10. Singh A, Crockard HA. Quantitative assessment of cer- vical spondylotic myelopathy by a simple walking test.
Lancet 1999;354:370-3.
11. Kim CR, Yoo JY, Lee SH, Lee DH, Rhim SC. Gait analysis for evaluating the relationship between in- creased signal intensity on t2-weighted magnetic reso- nance imaging and gait function in cervical spondylotic myelopathy. Arch Phys Med Rehabil 2010;91:1587-92.
12. Muhle C, Metzner J, Weinert D, et al. Classification system based on kinematic MR imaging in cervi-
cal spondylitic myelopathy. AJNR Am J Neuroradiol 1998;19:1763-71.
13. Baron EM, Young WF. Cervical spondylotic myelopa- thy: a brief review of its pathophysiology, clinical course, and diagnosis. Neurosurgery 2007;60:S35-41.
14. Clark CR. Cervical spondylotic myelopathy: his- tory and physical findings. Spine (Phila Pa 1976) 1988;13:847-9.
15. Suzuki E, Nakamura H, Konishi S, Yamano Y. Analysis of the spastic gait caused by cervical compression my- elopathy. J Spinal Disord Tech 2002;15:519-22.
16. Maezawa Y, Uchida K, Baba H. Gait analysis of spastic walking in patients with cervical compressive myelopa- thy. J Orthop Sci 2001;6:378-84.
17. McDermott A, Bolger C, Keating L, McEvoy L, Mel- drum D. Reliability of three-dimensional gait analy- sis in cervical spondylotic myelopathy. Gait Posture 2010;32:552-8.
18. Kerrigan DC, Gronley J, Perry J. Stiff-legged gait in spastic paresis. A study of quadriceps and hamstrings muscle activity. Am J Phys Med Rehabil 1991;70:294- 300.
19. Chao EY, Laughman RK, Schneider E, Stauffer RN.
Normative data of knee joint motion and ground reaction forces in adult level walking. J Biomech 1983;16:219-33.
20. Tracy JA, Bartleson JD. Cervical spondylotic myelopa- thy. Neurologist 2010;16:176-87.