Differing Impact of Weight Cycling on Ambulatory Blood Pressure versus Conventional Blood Pressure Assessment: A Possible Explanation to Controversy
Zachary Stephen Zeigler*, Trevor Carroll Nordin
College of Science, Engineering and Technology, Grand Canyon University, Phoenix, AZ, USA
Background: Weight cycling (WC) is a widespread behavior associated with elevated laboratory blood pres- sure (BP). The impact WC may have on ambulatory BP (ABP) is unknown.
Methods: Impact of self-reported WC history on ABP was assessed via cross-sectional nonexperimental design.
Sixty-five women completed the Weight and Lifestyle Inventory (WALI) questionnaire. The WALI has been shown to be a reliable index of WC (r=0.87, P<0.001). Data were analyzed looking at WC both as a continuous and criterion variable, and subjects were dichotomized as either WC or non-WC (NWC).
Results: WC (n=31) were older (39.7±8.9 vs. 33.1±11.3 years), had a higher percent body fat (47.1%±6.2%
vs. 41.4%±7.8%), and were less fit (21.2±5.4 vs. 26.7±7.6 mL/kg/min) than NWC (n=34). No significant corre- lation between laboratory systolic BP (SBP, P=0.830) or diastolic BP (DBP, P=0.997) and WC was observed. A sig- nificant correlation between the number of WC and systolic ABP (r=0.326, P=0.010) and trend for diastolic ABP (r=0.238, P=0.065) was found. SBP (23% vs. 17%, P<0.001) and DBP (13% vs. 9%, P<0.001) load was higher for WC compared to NWC women.
Conclusion: WC may deleteriously affect BP outcomes that might only be observed when ABP monitoring is used.
Key words: Weight, Ambulatory blood pressure, Obesity, Body fat
Received May 17, 2019 Reviewed June 18, 2019 Accepted July 23, 2019
* Corresponding author Zachary Stephen Zeigler
https://orcid.org/0000-0002-7690-8221 College of Science, Engineering and Technology, Grand Canyon University, 3300 West Camelback Rd, Phoenix, AZ 85017, USA
Tel: +1-480-200-2416 E-mail: [email protected]
INTRODUCTION
National surveys have found that roughly 57% of women had been on a weight loss diet in the preceding year.
1Dishearteningly, upwards of 95% of those who lose weight cannot sustain weight loss.
2Thus, dieters relapse into the predictive pattern of weight loss followed by weight regain sequences termed weight cycling (WC).
Granted, there is controversy for the topic of WC. However, data shows that WC is related to redistribution of body fat towards in- creased abdominal adiposity.
3WC has also been highlighted as a contributor of increased blood pressure (BP).
4A 2010 review
5ana- lyzed the available data on the impact of WC on BP in overweight/
obese adults. This review found five articles that met inclusion cri- teria and only one of the five was deemed to be “adequate” quality.
Nevertheless, of the five articles, three showed no impact of WC on BP while two showed WC increased BP. The authors determined that there was not enough evidence of acceptable quality to draw definitive conclusions and that additional research is needed for looking at the impact of WC on BP. Surprisingly, none of the in- volved studies included the superior technique of ambulatory BP (ABP) monitoring.
6To the authors knowledge, there is no data as- sessing the impact of WC on ABP. Thus, the purpose of this corre- lational nonexperimental study was to assess ABP differences be- tween WC and non-WC (NWC) overweight/obese woman.
Copyright © 2019 Korean Society for the Study of Obesity
This is an Open Access article distributed under the terms of the Creative Commons Attribution Non-Commercial License (http://creativecommons.org/licenses/by-nc/4.0/) which permits unrestricted non-commercial use, distribution, and reproduction in any medium, provided the original work is properly cited.
2017-03-16 https://crossmark-cdn.crossref.org/widget/v2.0/logos/CROSSMARK_Color_square.svg
METHODS
The data for current study was collected in correlation with previ- ous published work assessing the impact of WC on arterial stiffness.
7Sixty-five healthy, overweight/obese, nonsmoking, weight stable, Caucasian women with a body mass index (BMI) > 25 kg/m
2and age of 25–60 years were recruited. Subjects did not have diabetes or cardiovascular disease and were not on medication for either.
The Grand Canyon University Institutional Review Board approved this study (IRB No. 1087754) and informed consent was obtained prior to enrollment.
Subjects came to the laboratory for a single visit. Anthropometric measures of body weight, height, waist and hip circumferences and body fat (air displacement plethysmography; Bod Pod, Cosmed, Concord, CA, USA) were then measured followed by laboratory BP (Connex ProBP 3400 digital BP device; Welch Allyn, Skaneateles Falls, NY, USA). Next, a peak oxygen uptake (VO
2peak) test was completed. VO
2peakwas defined as the 10 second highest consecu- tive two points achieved during the exercise test. Subjects were then given the Weight and Lifestyle Inventory (WALI) questionnaire.
8The WALI has been found reliable in reporting number of diets (r= 0.77) and amount of weight lost (r= 0.87, both P<0.001).
9Subjects were classified as weight cyclers (WC group) if they re- ported a weight loss of ≥ 4.5 kg followed by weight regain of at least three times.
10,11An ABP monitor was given to the subjects (Oscar 2 ABP System; SunTech Medical, Morrisville, NC, USA).
12The Oscar 2 was programmed to take readings every 15 minutes throughout the day (09:00 AM–22:00 PM).
Statistical analysis
Statistical analyses were performed using IBM SPSS version 24.0 (IBM Corp., Armonk, NY, USA). Statistical analysis included ABP data collected from 09:00 AM to 22:00 PM of the same day. Mean day time ABP between groups were compared using independent t-test. Confounding variables of age, body fat, and VO
2peakwere then included as covariates via general linear models. Chi-square tests were used to compare frequency differences in BP load (percentage of readings above 140/90 mmHg). Bivariate Pearson correlations were used to assess linear relationships between number of WC’s, as a continuous variable, and systolic and diastolic laboratory BP
and mean ABP. Hierarchical regression was used to assess if WC significantly added to the model above what age, body fat, waist-to- hip ratio and VO
2peakcontribute to predicting BP outcomes.
RESULTS
Sixty-five overweight/obese female subjects completed the study.
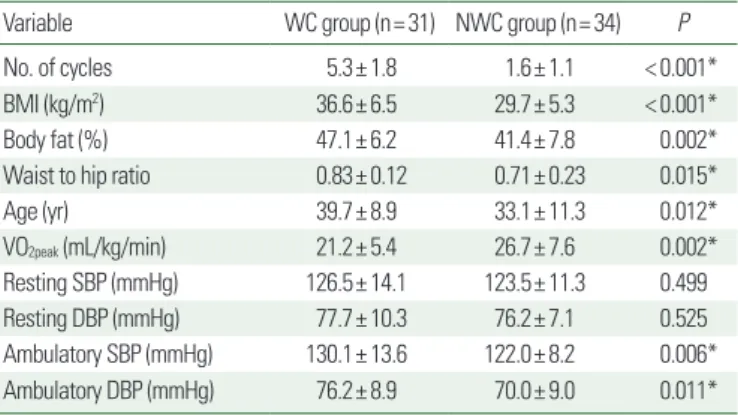
WC women were older, carried more body fat overall and in the abdominal region, and were not as fit as NWC women (Table 1).
Table 1 illustrates that there was no statistical difference in resting (laboratory) systolic BP (SBP) and diastolic BP (DBP) between groups. However, there were statistical differences in mean systolic ABP and diastolic ABP. Because mean group differences were found for age, body fat, waist-to-hip ratio, and VO
2peak, these vari- ables were then adjusted for as covariates. Due to collinearity of body fat, BMI, and waist-to-hip ratio, these variables were included alternately. After adjusting for age, there were still differences be- tween groups for systolic ABP (P=0.040) and borderline signifi- cant difference for diastolic ABP (P=0.056). There was a trend for statistical significance on systolic ABP after adding body fat as a co- variate (P=0.062) while significance was completely lost for dia- stolic ABP (P=0.123). There were still significant systolic and dia- stolic ABP differences between groups after adjusting for waist-to- hip-ratio (P=0.014, P=0.017, respectively).
Because baseline differences in BMI were seen between WC and NWC groups, and since BMI undoubtedly affects BP values, the data was then split into obese (BMI ≥ 30 kg/m
2, n= 37) and non-
Table 1. Demographics
Variable WC group (n= 31) NWC group (n= 34) P
No. of cycles 5.3± 1.8 1.6± 1.1 < 0.001*
BMI (kg/m2) 36.6± 6.5 29.7± 5.3 < 0.001*
Body fat (%) 47.1± 6.2 41.4± 7.8 0.002*
Waist to hip ratio 0.83± 0.12 0.71± 0.23 0.015*
Age (yr) 39.7± 8.9 33.1± 11.3 0.012*
VO2peak (mL/kg/min) 21.2± 5.4 26.7± 7.6 0.002*
Resting SBP (mmHg) 126.5± 14.1 123.5± 11.3 0.499
Resting DBP (mmHg) 77.7± 10.3 76.2± 7.1 0.525
Ambulatory SBP (mmHg) 130.1± 13.6 122.0± 8.2 0.006*
Ambulatory DBP (mmHg) 76.2± 8.9 70.0± 9.0 0.011*
Values are presented as mean± standard deviation.
*Unadjusted P-values.
WC, weight cycling; NWC, non-WC; BMI, body mass index; VO2peak, peak oxygen up- take; SBP, systolic blood pressure; DBP, diastolic blood pressure.
obese (BMI <30 kg/m
2, n=28) subjects. Within the obese subjects, there was no difference in laboratory SBP between WC (n= 23) and NWC (n= 14) groups (129.9± 13.9 vs. 128.4± 12.4 mmHg, respectively, P=0.740). However, there was a significant group dif- ference in systolic ABP (132.5± 12.5 vs. 125.2± 8.7 mmHg, P=
0.048) such that WC had higher values. However, after adding baseline BMI and age into the model as covariates, statistical signif- icance was lost (P=0.468). There were no group differences for laboratory (P=0.995) or ambulatory DBP (P=0.101). When ana- lyzing the non-obese group in isolation, there were no group differ- ences for laboratory SBP (P=0.378), DBP (P=0.484), ambulatory SBP (P=0.374) or ambulatory DBP (P=0.357).
No significant correlation between laboratory SBP and the num- ber of WC’s was observed (P= 0.830). A significant correlation be- tween the number of WC’s and mean systolic ABP exists (r= 0.326, P=0.010). Number of WC did not correlate with laboratory DBP (P=0.997) but there was a trend for number of WC to correlate with diastolic ABP (r= 0.238, P=0.065). A hieratical regression analysis was conducted with age, BMI, fitness, and waist circum- ference entered into the first model as predictor variables and WC (as a continuous variable) entered into the second model as a pre- dictor variable with ABP as the criterion variable. The first model significantly explained 39.0% of the variance on systolic ABP (r=
0.624, P<0.001). The addition of WC showed an r-square change that added 4% of the variance being explained by WC (P=0.068).
When diastolic ABP was used as the criterion variable, the first model significantly explained 28.6% (r= 0.534, P=0.001) but the addition of WC did not enhance the prediction model (P=0.865).
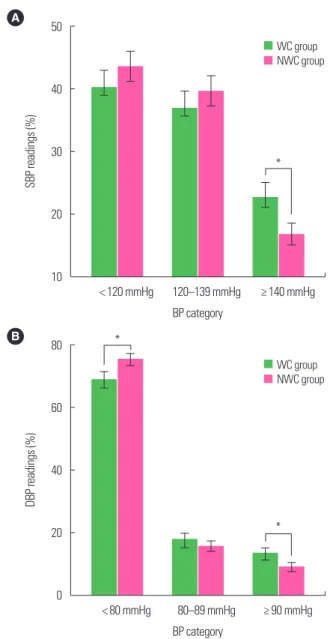
Fig. 1A shows no statistical difference between WC and NWC on the percentage of SBP readings of < 120 or 120–139 mmHg (P>0.05). However, there was a higher percentage of SBP readings above 140 mmHg for WC compared to NWC (23% vs. 17%, P<0.001). Fig. 1B shows a statistically greater percentage of nor- mal DBP readings ( < 80 mmHg) for NWC compared to WC (75% vs. 69%, respectively, P<0.001). There were no differences on the percentage of DBP readings 80–89 mmHg but there was a statistically higher percentage of DBP readings above 90 mmHg for WC compared to NWC (13% vs. 9%, P<0.001).
DISCUSSION
To the authors knowledge, this is the first study to assess the pos- sible impact of WC on ABP. The major finding of this investigation was that WC did not affect laboratory BP but may have an impact on daytime ABP, including BP load. This is significant because past literature assessing the impact of WC on BP has been inconclusive possibly due to the method of BP measurement.
Zeigler et al.
7found higher levels of WC were associated with in-
Figure 1. Percentage of systolic (SBP) and diastolic blood pressure (DBP) accord- ing to weight cycling (WC). Difference in percentage of SBP (A) and DBP (B) cate- gory readings between WC and non-WC (NWC) groups (over 13 hours, 09:00 AM–22:00 PM). Error bar represents 95% confidence interval. *P< 0.05 from chi- square test to compare WC and NWC groups.A 50
40
30
20
10
SBP readings (%)
< 120 mmHg 120–139 mmHg ≥ 140 mmHg BP category
WC group NWC group
*
B 80
60
40
20
0
DBP readings (%)
< 80 mmHg 80–89 mmHg ≥ 90 mmHg BP category
WC group NWC group
*
*