• 검색 결과가 없습니다.

Use of Cardiac Computed Tomography for Ventricular Volumetry in Late Postoperative Patients with Tetralogy of Fallot

N/A
N/A
Protected

Academic year: 2021

Share "Use of Cardiac Computed Tomography for Ventricular Volumetry in Late Postoperative Patients with Tetralogy of Fallot"

Copied!
7
0
0

로드 중.... (전체 텍스트 보기)

전체 글

(1)

ISSN: 2233-601X (Print) ISSN: 2093-6516 (Online)

Received: June 23, 2016, Revised: September 21, 2016, Accepted: October 17, 2016, Published online: April 5, 2017

Corresponding author: Tae-Jin Yun, Division of Pediatric Cardiac Surgery, Asan Medical Center, University of Ulsan College of Medicine, 88 Olympic-ro 43-gil, Songpa-gu, Seoul 05505, Korea

(Tel) 82-2-3010-3589 (Fax) 82-2-3010-6811 (E-mail) tjyun@amc.seoul.kr

© The Korean Society for Thoracic and Cardiovascular Surgery. 2017. All right reserved.

This is an open access article distributed under the terms of the Creative Commons Attribution Non-Commercial License (http://creativecommons.org/

licenses/by-nc/4.0) which permits unrestricted non-commercial use, distribution, and reproduction in any medium, provided the original work is properly cited.

Use of Cardiac Computed Tomography for Ventricular Volumetry in Late Postoperative Patients

with Tetralogy of Fallot

Ho Jin Kim, M.D. 1 , Da Na Mun, M.D. 1 , Hyun Woo Goo, M.D., Ph.D. 2 , Tae-Jin Yun, M.D., Ph.D. 1

1
Division of Pediatric Cardiac Surgery and

2

Department of Diagnostic Imaging, Asan Medical Center, University of Ulsan College of Medicine

Background: Cardiac computed tomography (CT) has emerged as an alternative to magnetic resonance imag- ing (MRI) for ventricular volumetry. However, the clinical use of cardiac CT requires external validation.

Methods: Both cardiac CT and MRI were performed prior to pulmonary valve implantation (PVI) in 11 pa- tients (median age, 19 years) who had undergone total correction of tetralogy of Fallot during infancy. The simplified contouring method (MRI) and semiautomatic 3-dimensional region-growing method (CT) were used to measure ventricular volumes. Results: All volumetric indices measured by CT and MRI generally correlated well with each other, except for the left ventricular end-systolic volume index (LV-ESVI), which showed the following correlations with the other indices: the right ventricular end-diastolic volume index (RV-EDVI) (r=0.88, p<0.001), the right ventricular end-systolic volume index (RV-ESVI) (r=0.84, p=0.001), the left ven- tricular end-diastolic volume index (LV-EDVI) (r=0.90, p=0.001), and the LV-ESVI (r=0.55, p=0.079). While the EDVIs measured by CT were significantly larger than those measured by MRI (median RV-EDVI: 197 mL/m

2

vs. 175 mL/m

2

, p=0.008; median LV-EDVI: 94 mL/m

2

vs. 92 mL/m

2

, p=0.026), no significant differences were found for the RV-ESVI or LV-ESVI. Conclusion: The EDVIs measured by cardiac CT were greater than those measured by MRI, whereas the ESVIs measured by CT and MRI were comparable. The volumetric character- istics of these 2 diagnostic modalities should be taken into account when indications for late PVI after tetral- ogy of Fallot repair are assessed.

Key words: 1. Congenital heart disease 2. Ventricular volumetry

3. Cardiac computed tomography 4. Cardiac magnetic resonance imaging

Introduction

In the preoperative assessment of congenital heart disease, cardiac magnetic resonance imaging (MRI) has been regarded as the gold standard for the measurement of ventricular volume [1,2]. However, long examination times and the potential need for

general anesthesia have limited the use of cardiac MRI in pediatric patients [3,4]. Cardiac computed to- mography (CT) may be a suitable alternative in this regard, as the study time is relatively shorter and there is no requirement for general anesthesia.

Furthermore, cardiac MRI has the disadvantage of low spatial resolution, leading to difficulties in accu-

https://doi.org/10.5090/kjtcs.2017.50.2.71

(2)

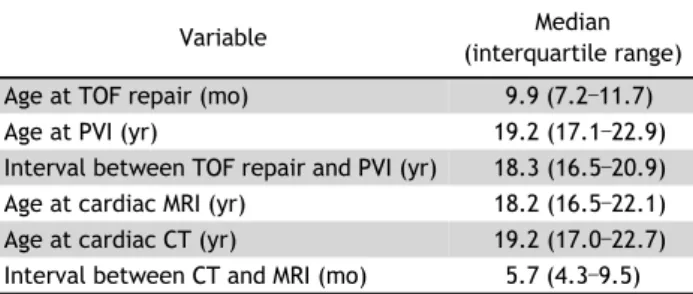
Table 1. Baseline characteristics

Variable Median

(interquartile range) Age at TOF repair (mo) 9.9 (7.2 –11.7)

Age at PVI (yr) 19.2 (17.1 –22.9)

Interval between TOF repair and PVI (yr) 18.3 (16.5 –20.9) Age at cardiac MRI (yr) 18.2 (16.5 –22.1) Age at cardiac CT (yr) 19.2 (17.0 –22.7) Interval between CT and MRI (mo) 5.7 (4.3 –9.5) TOF, tetralogy of Fallot; PVI, pulmonary valve implantation; MRI, magnetic resonance imaging; CT, computed tomography.

rately delineating the endocardial border of the intra- ventricular structures, such as the papillary muscles and trabeculae. This, in turn, may lead to inaccurate volume measurements, as the ventricular volume be- tween these structures may be inadvertently excluded from calculation.

Despite the clinical advantages and putatively su- perior accuracy of cardiac CT over MRI for ven- tricular volumetry in patients with congenital heart disease, few studies have directly compared the val- idity of these 2 imaging modalities in this context [5]. Therefore, we sought to quantify and compare the ventricular volumes measured by both cardiac CT and cardiac MRI in patients with surgically corrected tetralogy of Fallot (TOF) pending pulmonary valve implantation (PVI).

Methods

1) Patients

From our institutional database, we identified 11 patients (1 female) who had undergone total correc- tion of TOF during infancy, and in whom both car- diac MRI and CT examinations were undertaken within 12 months prior to PVI. Cardiac CT was sub- sequently performed in addition to MRI to obtain de- tailed anatomical information, including coronary ar- tery distribution, right ventricular outflow tract mor- phology, and branch pulmonary artery configuration.

During the interval between CT and MRI examina- tions, no catheter or surgical interventions were per- formed, and deterioration of valve function or changes in ventricular function were not observed on echocardiography. Age at TOF repair, PVI, CT, and MRI are detailed in Table 1.

2) Outcomes of interest and statistical analysis The primary outcomes of interest were the ven- tricular end-diastolic volume index (EDVI) and the end-systolic volume index (ESVI), as measured by both cardiac CT and MRI. All variables were pre- sented as medians with the interquartile range (IQR), and the differences between CT and MRI measure- ments for each index were assessed using the Wilcoxon signed-rank test. Furthermore, linear corre- lations between cardiac CT and MRI measurements were analyzed using the Spearman correlation co- efficient (r). Intraclass correlations were also ana-

lyzed to assess the consistency of ventricular volume- try across the 2 imaging modalities. Finally, Bland- Altman analysis was performed for each pair of EDVI and ESVI values to calculate the limits of agreement.

3) Ventricular volumetry on cardiac magnetic re- sonance imaging and cardiac computed tomo- graphy

For the measurement of ventricular volume using cardiac MRI, a simplified contouring method was used to delineate the compacted endocardial border on short-axis slices [6]. The papillary muscles and trabeculae were excluded from mass measurements.

Ventricular volumes at both end-diastolic and end-systolic phases were calculated by adding the endocardial areas of each short-axis slice and multi- plying this total by the interslice distance.

To measure ventricular volume using cardiac CT, dual-source prospective electrocardiogram (ECG)-trig- gered and respiratory-triggered cardiac CT were per- formed using a body size-adapted, low-dose protocol.

The technical details regarding the targeting of the

end-systolic and diastolic phases in prospective

ECG-triggered CT scan are described in a previous

report [2]. Ventricular volume was quantified using a

semiautomatic 3-dimensional (3D) region-growing

method on a commercially available workstation

(Advantage Windows 4.6; GE Healthcare, Milwaukee,

WI, USA). The endocardial border was delineated us-

ing a signal intensity-based thresholding method. The

threshold was manually adjusted until the appear-

ances matched our visual assessment.

(3)

Table 2. Volumetric data measured by cardiac MRI and CT

Variable

Median (interquartile range) Wilcoxon

signed-rank test Spearman test

CT MRI p-value Correlation

coefficient (r) p-value

RV-EDVI (mL/m

2

) 197 (171 –190) 175 (182 –223) 0.008 0.88 <0.001

RV-ESVI (mL/m

2

) 101 (91 –106) 101 (82 –119) 0.722 0.84 0.001

LV-EDVI (mL/m

2

) 94 (82 –97) 92 (88 –104) 0.026 0.90 0.001

LV-ESVI (mL/m

2

) 41 (37 –46) 41 (38 –44) 0.859 0.55 0.079

RVEF (%) 48 (42 –47) 44 (45 –52) 0.075 0.35 0.298

LVEF (%) 58 (51 –56) 54 (52 –61) 0.248 0.25 0.467

MRI, magnetic resonance imaging CT, computed tomography; RV, right ventricle EDVI, end-diastolic volume index; ESVI, end-systolic volume index; LV, left ventricle EF, ejection fraction.

Results

1) Quantification and comparison of volume in- dices measured by cardiac magnetic resonance imaging and computed tomography

Table 2 summarizes the ventricular volume indices measured by cardiac CT and MRI, specifically the right ventricular end-diastolic volume index (RV-EDVI), the right ventricular end-systolic volume index (RV- ESVI), the left ventricular end-diastolic volume index (LV-EDVI), and the left ventricular end-systolic vol- ume index (LV-ESVI). The RV-EDVI calculated using the Wilcoxon signed rank test showed that cardiac CT and MRI measurements differed significantly for the RV-EDVI (p=0.008) and the LV-EDVI (p=0.026):

RV-EDVI on CT, 197 mL/m

2

(IQR, 171–190 mL/m

2

);

RV-EDVI on MRI, 175 mL/m

2

(IQR, 185–223 mL/m

2

);

LV-EDVI on CT, 94 mL/m

2

(IQR, 82–97 mL/m

2

);

LV-EDVI on MRI, 92 mL/m

2

(IQR, 88–104 mL/m

2

).

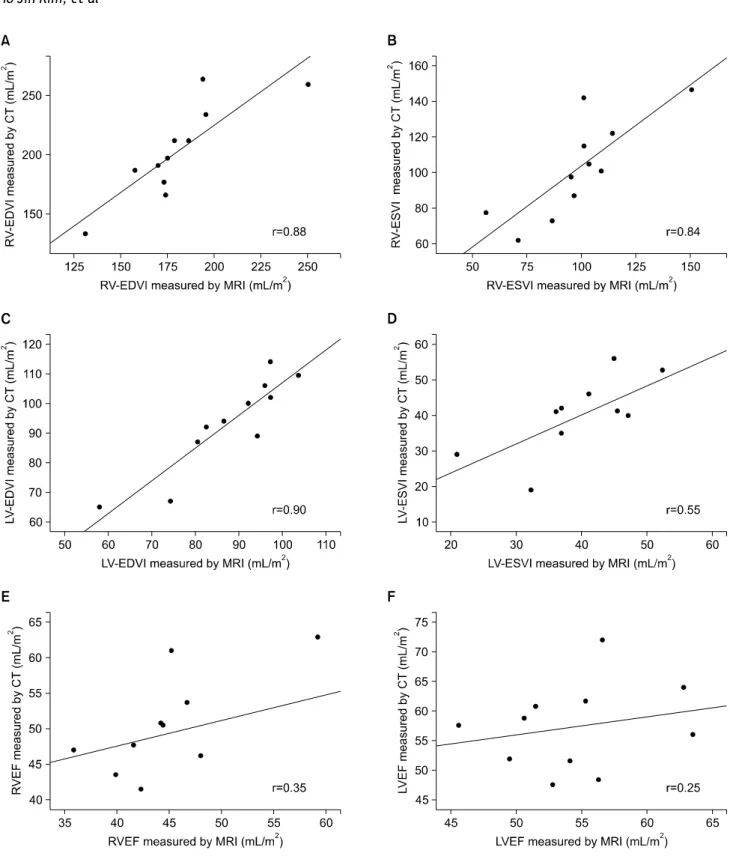
Both measurements were highly correlated for all volumetric indices except for the LV-ESVI (RV-EDVI:

r=0.88, p<0.001; RV-ESVI: r=0.84, p=0.001; LV-EDVI:

r=0.90, p=0.001; LV-ESVI: r=0.55, p=0.079). However, the measurement technique did not lead to a signifi- cant difference for the right ventricular ejection frac- tion (RVEF) (p=0.075) or the left ventricular ejection fraction (LVEF) (p=0.248). Likewise, the RVEF and LVEF as measured by both modalities were not sig- nificantly correlated (RVEF: r=0.35, p=0.298; LVEF:

r=0.25, p=0.467) (Fig. 1).

2) Agreement of ventricular indices measured by cardiac magnetic resonance imaging and com- puted tomography

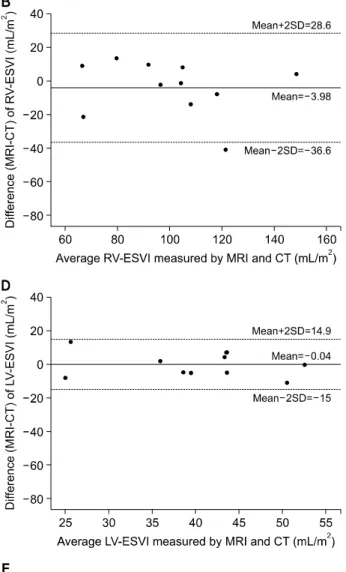
Fig. 2 presents Bland-Altman plots assessing the agreement between measurements made using these 2 imaging modalities. The left ventricular volume in- dices generally showed a better level of agreement than the right-sided volume indices, as indicated by 95% limits of agreement (RV-EDVI, 85.4 mL/m

2

; RV- ESVI, 65.2 mL/m

2

; LV-EDVI, 29.1 mL/m

2

; LV-ESVI, 29.9 mL/m

2

). However, when the descriptive values from the Bland-Altman analysis were converted to percentages to evaluate the ratio of 95% limits of agreement to the average volumes measured using cardiac MRI and CT for each volumetric index, the values (expressed as mean difference, range of 95%

limits of agreement) obtained were: RV-EDVI, −11.1%

(8.7% to −30.8%); RV-ESVI, −3.4% (30.6% to −37.4%);

LV-EDVI, −6.0% (9.2% to −21.3%); LV-ESVI, 7.9%

(46.8% to −45.2%). Intraclass correlations between cardiac CT and MRI measurements indicated that both radiologic modalities showed excellent con- sistency in measuring the ventricular volume indices, except for RV-EDVI and LV-ESVI (RV-EDVI, 0.678;

RV-ESVI, 0.804; LV-EDVI, 0.836; LV-ESVI, 0.712).

Discussion

The main findings of this study are as follows: (1)

the cardiac CT measurements of RV-EDVI and

LV-EDVI were significantly greater than the corre-

sponding MRI measurements, (2) there were no sig-

nificant differences between cardiac MRI and CT

(4)

Fig. 1. Scatterplots with slopes and Spearman r for (A) RV-EDVI, (B) RV-ESVI, (C) LV-EDVI, (D) LV-ESVI, (E) RVEF, and (F) LVEF. CT, com-

puted tomography; MRI, magnetic resonance imaging; RV, right ventricle; EDVI, end-diastolic volume index; ESVI, end-systolic volume in-

dex; LV, left ventricle; EF, ejection fraction.

(5)

Fig. 2. Bland-Altman plots of the differences between (A) RV-EDVI, (B) RV-ESVI, (C) LV-EDVI, (D) LV-ESVI, (E) RVEF, and (F) LVEF meas-

urements by cardiac MRI and CT. MRI, magnetic resonance imaging; CT, computed tomography; SD, standard deviation; RV, right ven-

tricle; EDVI, end-diastolic volume index; ESVI, end-systolic volume index; LV, left ventricle; EF, ejection fraction.

(6)

measurements for other volumetric values (RV-ESVI and LV-ESVI), and (3) all measures of volumetric in- dices by cardiac CT and MRI correlated well, except for the LV-EDVI.

To date, cardiac MRI has been the gold standard for measuring ventricular volume. However, short- comings such as long examination times, the need for general anesthesia in small children, and the increas- ing use of body implants incompatible with high magnetic fields hamper its routine use in the pedia- tric population [4]. On the other hand, cardiac CT al- lows for accurate ventricular volumetry with ex- cellent spatial resolution, and is known to correlate well with cardiac MRI measurements in subjects with normal cardiac anatomy [7]. However, information regarding the collinearity of the ventricular volume- try data obtained either by CT or MRI in patients with congenital heart disease is sparse [5,8,9].

For the measurement of ventricular volumetric in- dices using MRI, radiologists should draw a line de- lineating the ventricular cavity, usually excluding the area of heavy trabeculation. Thus, ventricular volume between the trabeculation is usually excluded at the time of volume measurement (i.e., underestimation of the real ventricular volume). If the radiologist in- cludes a large portion of the area of trabeculation as the ventricular cavity, MRI volumetry data may be greater than the actual ventricular volume (i.e., over- estimation of the real ventricular volume). CT volu- metry measures the area with the same CT number (i.e., the CT number of the blood) and incorporates the ventricular volume between the trabeculations.

Thus, it is plausible that CT volumetry data are close to the real ventricular volume. One interesting result from our study was the finding that both the RV-EDVI and LV-EDVI were significantly higher when using cardiac CT (where semiautomatic 3D thresh- old-based contouring was used) than when using MRI (where simplified contouring was used) for this cohort [6], although a good correlation remained be- tween the data derived from these modalities. This may be attributable to the differences in resolution between the 2 techniques. Compared with cardiac CT, the blood-myocardial contrast is not distinct in car- diac MRI, which leads to low spatial resolution. In contrast, the 3D threshold-based, region-growing con- touring method used in cardiac CT may allow more accurate delineation of the endocardial border, as

structures such as the trabeculae and papillary mus- cles can be clearly identified and therefore be ex- cluded from ventricular volume measurements. In ad- dition, the absence of a significant difference in the systolic volume indices between the 2 modalities may be explained by the smaller ventricular volume between the trabeculation during the systolic phase.

However, the findings of this study are inconsistent with those of previous studies [6,7], which demon- strated that measured ventricular volumes were com- parable regardless of radiologic modalities and con- touring methods. Thus, further studies need to be performed to address this issue.

Although the 95% limits of agreement in Bland- Altman analysis seemed to be better for the left ven- tricular volume indices, the ratio of the 95% limits of agreement to the mean measurements by cardiac MRI and cardiac CT was found to be higher for the left ventricular volume indices. This result signifies that smaller discrepancies in the actual numeric val- ues for left-heart dimensions between these radio- logic modalities should be interpreted in consid- eration of the normal reference values.

Although this study provides several significant in- sights, it also has limitations, including a small sam- ple size and the possibility that the smaller ven- tricular EDVIs found using MRI may have been at- tributable to an institutional bias towards under- estimation of the ventricular volumes, rather than to the inherent characteristics of MRI volumetry.

In conclusion, in patients with surgically corrected TOF, ventricular volumetry with cardiac CT using a semiautomatic 3D region-growing method resulted in higher measurements of LV-EDVI and RV-EDVI than volumetry with cardiac MRI using a simplified con- touring method. The interpretation of ventricular volumetry results obtained from cardiac CT should therefore be made with caution when making clinical decisions and formulating treatment strategies for this subset of patients.

Conflict of interest

No potential conflicts of interest relevant to this

article are reported.

(7)

Acknowledgments

This study was supported by a Grant of the Samsung Vein Clinic Network (Daejeon, Anyang, Cheongju, Cheonan; Fund No. KTCS04-065).

References

1. Grosse-Wortmann L, Yun TJ, Al-Radi O, et al. Borderline hypoplasia of the left ventricle in neonates: insights for decision-making from functional assessment with mag- netic resonance imaging. J Thorac Cardiovasc Surg 2008;

136:1429-36.

2. Goo HW. State-of-the-art CT imaging techniques for con- genital heart disease. Korean J Radiol 2010;11:4-18.

3. Chan FP. MR and CT imaging of the pediatric patient with structural heart disease. Semin Thorac Cardiovasc Surg Pediatr Card Surg Annu 2009:99-105.

4. Kim HJ, Goo HW, Park SH, Yun TJ. Left ventricle volume measured by cardiac CT in an infant with a small left ven- tricle: a new and accurate method in determining uni- or biventricular repair. Pediatr Radiol 2013;43:243-6.

5. Koch K, Oellig F, Oberholzer K, et al. Assessment of right ventricular function by 16-detector-row CT: comparison

with magnetic resonance imaging. Eur Radiol 2005;15:

312-8.

6. Miller CA, Jordan P, Borg A, et al. Quantification of left ventricular indices from SSFP cine imaging: impact of re- al-world variability in analysis methodology and utility of geometric modeling. J Magn Reson Imaging 2013;37:1213- 22.

7. Raman SV, Shah M, McCarthy B, Garcia A, Ferketich AK.

Multi-detector row cardiac computed tomography accu- rately quantifies right and left ventricular size and func- tion compared with cardiac magnetic resonance. Am Heart J 2006;151:736-44.

8. Asferg C, Usinger L, Kristensen TS, Abdulla J. Accuracy of multi-slice computed tomography for measurement of left ventricular ejection fraction compared with cardiac magnetic resonance imaging and two-dimensional trans- thoracic echocardiography: a systematic review and meta-analysis. Eur J Radiol 2012;81:e757-62.

9. Dewey M, Muller M, Eddicks S, et al. Evaluation of global

and regional left ventricular function with 16-slice com-

puted tomography, biplane cineventriculography, and

two-dimensional transthoracic echocardiography: com-

parison with magnetic resonance imaging. J Am Coll

Cardiol 2006;48:2034-44.

수치

Table 1. Baseline characteristics
Table 2. Volumetric data measured by cardiac MRI and CT
Fig. 1. Scatterplots with slopes and Spearman r for (A) RV-EDVI, (B) RV-ESVI, (C) LV-EDVI, (D) LV-ESVI, (E) RVEF, and (F) LVEF
Fig. 2. Bland-Altman plots of the differences between (A) RV-EDVI, (B) RV-ESVI, (C) LV-EDVI, (D) LV-ESVI, (E) RVEF, and (F) LVEF meas- meas-urements by cardiac MRI and CT

참조

관련 문서

Postoperative Postoperative Postoperative Postoperative Magnetic Magnetic Magnetic Magnetic resonance resonance resonance image resonance image image image shows

CT (Computed Tomography) – TDLAS (Tunable Diode Laser Absorption Spectroscopy) is a non-intrusive diagnostic technique that allows for spatially resolved measurements

23 23 23 Standard 23 Standard Standard deviation, Standard deviation, deviation, mean deviation, mean mean mean for for for for the the the the power power

1) Growth behind Planar Incoherent Interfaces.. 5.18 Grain-boundary diffusion can lead to rapid lengthening and thickening of grain boundary precipitates, especially

Consequently, Zr-Cu binary alloys have the potential to be used as biomaterials with nullifying magnetic properties for magnetic resonance imaging diagnosis and

Additionally, all Google user to download the query index data as a CVS file. So, we gather the individual companies listed on KOSPI100’s search volume index by

 In the present study, as a preliminary study, a LACC-based Compton CT was developed to estimate the activity of the spot inside the radioactive waste drum. To

• Project Definition Rating Index (PDRI).. – Simple, easy-to-use tool for measuring the degree of